| You are here: | ||
| <<< Previous | Home | Next >>> |
This chapter discusses the concepts surrounding architecture artifacts and then describes the artifacts that are recommended to be created for each phase within the Architecture Development Method (ADM).
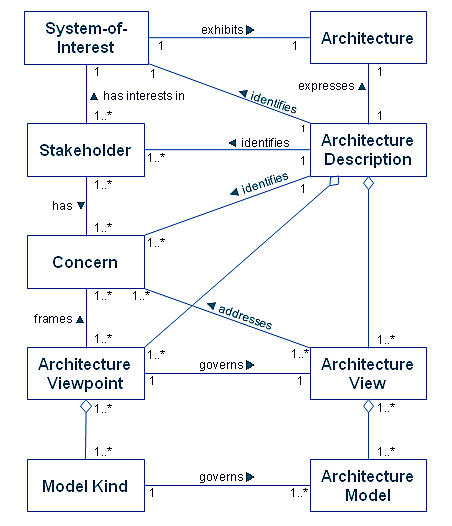
Architectural artifacts are created in order to describe a system, solution, or state of the enterprise. The concepts discussed in this section have been adapted from more formal definitions contained in ISO/IEC/IEEE 42010:2011 and ISO/IEC/IEEE 15288:2015. They are illustrated in Figure 31-1.
The "environment" of a system is the context determining the setting and circumstances of all influences upon a system. The environment of a system includes developmental, technological, business, operational, organizational, political, economic, legal, regulatory, ecological, and social influences.
A "system" is a combination of interacting elements organized to achieve one or more stated purposes.
The "architecture" of a system is the fundamental concepts or properties of a system in its environment embodied in its elements, relationships, and in the principles of its design and evolution.
An "Architecture Description" is a work product used to express an architecture; a collection of architecture views and models that together document the architecture.
"Stakeholders" are individuals, teams, organizations, or classes thereof, having an interest in a system.
"Concerns" are interests in a system relevant to one or more of its stakeholders. Concerns may pertain to any aspect of the system's functioning, development, or operation, including considerations such as performance, reliability, security, distribution, and evolvability and may determine the acceptability of the system.
An "architecture view" is a representation of a system from the perspective of a related set of concerns. It consists of one or more architecture models of the system.
An "Architecture Model" is a representation of a subject of interest. A model provides a smaller scale, simplified, and/or abstract representation of the subject matter.
In capturing or representing the design of a system architecture, the architect will typically create one or more architecture models, possibly using different tools. An architecture view will comprise selected parts of one or more models, chosen so as to demonstrate to a particular stakeholder or group of stakeholders that their concerns are being adequately addressed in the design of the system architecture.
An "architecture viewpoint" is a specification of the conventions for a particular kind of architecture view. It can also be called the definition or schema for that kind of architecture view. It establishes the conventions for constructing, interpreting, and using an architecture view to address a specific concern (or set of concerns) about a system-of-interest.
A "Model Kind" establishes conventions for a type of modeling.
An architecture viewpoint references one or more model kinds; an architecture view incorporates one or more models.
A "viewpoint library" is a collection of the specifications of architecture viewpoints contained in the Reference Library portion of the Architecture Repository.
ISO/IEC/IEEE 42010:2011 encourages architects to define architecture viewpoints explicitly. Making this distinction between the content and schema of a view may seem at first to be an unnecessary overhead, but it provides a mechanism for re-using architecture viewpoints across different architectures.
In summary, then, architecture views are representations of the overall architecture in terms meaningful to stakeholders. They
enable the architecture to be communicated to and understood by the stakeholders, so they can verify that the system will address
their concerns.
Concerns are the root of the process of decomposition into requirements. Concerns are represented in the architecture by these requirements. Requirements should be SMART (e.g., specific metrics).
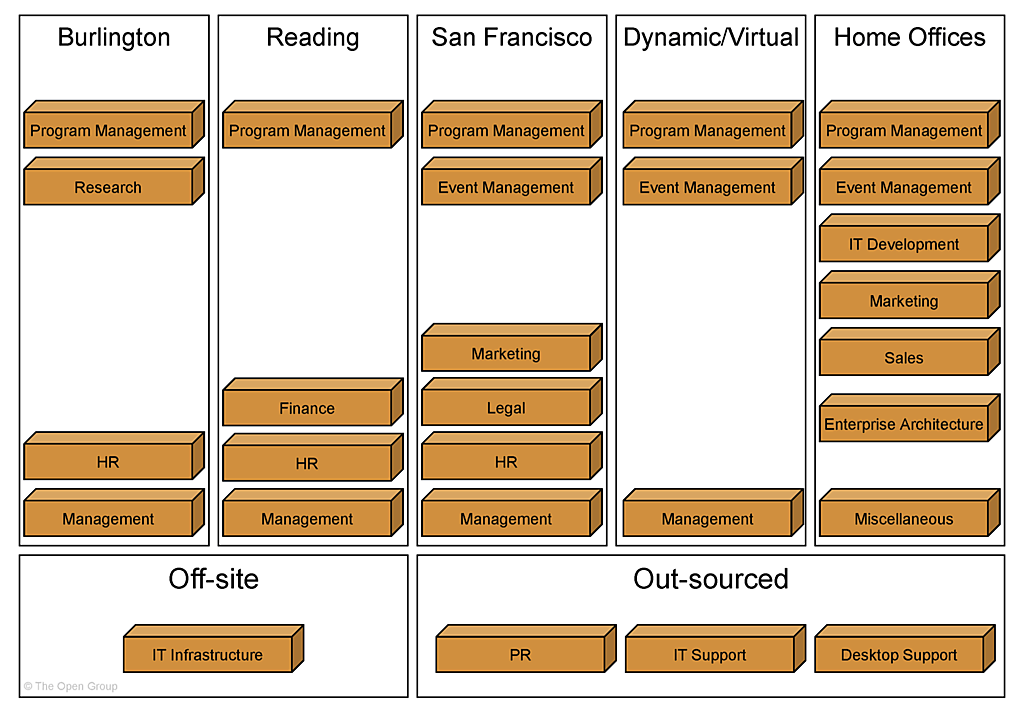
For many architectures, a useful architecture viewpoint is that of business domains, which can be illustrated by an example from The Open Group itself.
The architecture viewpoint is specified as follows:
|
Architecture |
|
|---|---|
|
Viewpoint Element |
Description |
|
Stakeholders |
Management Board, Chief Executive Officer |
|
Concerns |
Show the top-level relationships between US/UK geographical sites and business functions. |
|
Modeling technique |
Nested boxes diagram. |
The corresponding architecture view of The Open Group (in 2017) is shown in Figure 31-2 .
The choice of which particular architecture views to develop is one of the key decisions that the architect has to make.
The architect has a responsibility for ensuring the completeness (fitness-for-purpose) of the architecture, in terms of adequately addressing all the pertinent concerns of its stakeholders; and the integrity of the architecture, in terms of connecting all the various views to each other, satisfactorily reconciling the conflicting concerns of different stakeholders, and showing the trade-offs made in so doing (as between security and performance, for example).
The choice has to be constrained by considerations of practicality, and by the principle of fitness-for-purpose (i.e., the architecture should be developed only to the point at which it is fit-for-purpose, and not reiterated ad infinitum as an academic exercise).
As explained in Part II: Architecture Development Method (ADM), the development of architecture views is an iterative process. The typical progression is from business to technology, using a technique such as business scenarios (see the TOGAF® Series Guide: Business Scenarios) to properly identify all pertinent concerns; and from high-level overview to lower-level detail, continually referring back to the concerns and requirements of the stakeholders throughout the process.
Moreover, each of these progressions has to be made for two distinct environments: the existing environment (referred to as the baseline in the ADM) and the target environment. The architect must develop pertinent architecture views of both the Baseline Architecture and the Target Architecture. This provides the context for the gap analysis at the end of Phases B, C, and D of the ADM, which establishes the elements of the Baseline Architecture to be carried forward and the elements to be added, removed, or replaced.
This whole process is explained in Part III, 23. Gap Analysis .
As mentioned above, the TOGAF framework encourages but does not mandate the use of ISO/IEC/IEEE 42010:2011. The following description therefore covers both the situation where ISO/IEC/IEEE 42010:2011 has been adopted and where it has not.
ISO/IEC/IEEE 42010:2011 itself does not require any specific process for developing architecture viewpoints or creating views from them. Where ISO/IEC/IEEE 42010:2011 has been adopted and become well-established practice within an organization, it will often be possible to create the required views for a particular architecture by following these steps:
This approach can be expected to bring the following benefits:
However, situations can always arise in which an architecture view is needed for which no appropriate architecture viewpoint has been predefined. This is also the situation, of course, when an organization has not yet incorporated ISO/IEC/IEEE 42010:2011 into its architecture practice and established a library of architecture viewpoints.
In each case, the architect may choose to develop a new architecture viewpoint that will cover the outstanding need, and then generate an architecture view from it. (This is ISO/IEC/IEEE 42010:2011 recommended practice.) Alternatively, a more pragmatic approach can be equally successful: the architect can create an ad hoc architecture view for a specific system and later consider whether a generalized form of the implicit architecture viewpoint should be defined explicitly and saved in a library, so that it can be re-used. (This is one way of establishing a library of architecture viewpoints initially.)
Whatever the context, the architect should be aware that every architecture view has an architecture viewpoint, at least implicitly, and that defining the architecture viewpoint in a systematic way (as recommended by ISO/IEC/IEEE 42010:2011) will help in assessing its effectiveness; i.e., does the architecture viewpoint cover the relevant stakeholder concerns?
The need for architecture views, and the process of developing them following the ADM, are explained above. This section describes the relationships between architecture views, the tools used to develop and analyze them, and a standard language enabling interoperability between the tools.
In order to achieve the goals of completeness and integrity in an architecture, architecture views are usually developed, visualized, communicated, and managed using a tool.
In the current state of the market, different tools normally have to be used to develop and analyze different views of the architecture. It is highly desirable that an Architecture Description be encoded in a standard language, to enable a standard approach to the description of architecture semantics and their re-use among different tools.
An architecture viewpoint is also normally developed, visualized, communicated, and managed using a tool, and it is also highly desirable that standard architecture viewpoints (i.e., templates or schemas) be developed, so that different tools that deal in the same views can interoperate, the fundamental elements of an architecture can be re-used, and the Architecture Description can be shared among tools.
Issues relating to the evaluation of tools for architecture work are discussed in detail in Part V, 38. Tools for Architecture Development .
To illustrate the concepts of architecture views and architecture viewpoints, consider the example of a very simple airport system with two different stakeholders: the pilot and the air traffic controller.
One architecture view can be developed from the architecture viewpoint of the pilot, which addresses the pilot's concerns. Equally, another architecture view can be developed from the architecture viewpoint of the air traffic controller. Neither architecture view completely describes the system in its entirety, because the architecture viewpoint of each stakeholder constrains (and reduces) how each sees the overall system.
The architecture viewpoint of the pilot comprises some concerns that are not relevant to the controller, such as passengers and fuel, while the architecture viewpoint of the controller comprises some concerns not relevant to the pilot, such as other planes. There are also elements shared between the two architecture viewpoints, such as the communication model between the pilot and the controller, and the vital information about the plane itself.
An architecture viewpoint is a model (or description) of the information contained in a view. In our example, one architecture viewpoint is the description of how the pilot sees the system, and the other architecture viewpoint is how the controller sees the system.
Pilots describe the system from their perspective, using a model of their position and vector toward or away from the runway. All pilots use this model, and the model has a specific language that is used to capture information and populate the model.
Controllers describe the system differently, using a model of the airspace and the locations and vectors of aircraft within the airspace. Again, all controllers use a common language derived from the common model in order to capture and communicate information pertinent to their architecture viewpoint.
Fortunately, when controllers talk with pilots, they use a common communication language. (In other words, the models representing their individual architecture viewpoints partially intersect.) Part of this common language is about location and vectors of aircraft, and is essential to safety.
So, in essence, each architecture viewpoint is an abstract model of how all the stakeholders of a particular type - all pilots, or all controllers - view the airport system.
Tools exist to assist stakeholders, especially when they are interacting with complex models such as the model of an airspace, or the model of air flight.
The interface to the human user of a tool is typically close to the model and language associated with the architecture viewpoint. The unique tools of the pilot are fuel, altitude, speed, and location indicators. The main tool of the controller is radar. The common tool is a radio.
To summarize from the above example, we can see that an architecture view can subset the system through the perspective of the stakeholder, such as the pilot versus the controller. This subset can be described by an abstract model called an architecture viewpoint, such as an air flight versus an air space model. This description of the architecture view is documented in a partially specialized language, such as "pilot-speak" versus "controller-speak". Tools are used to assist the stakeholders, and they interface with each other in terms of the language derived from the architecture viewpoint ("pilot-speak" versus' "controller-speak").
When stakeholders use common tools, such as the radio contact between pilot and controller, a common language is essential.
Now let us map this example to the Enterprise Architecture. Consider two stakeholders in a new small computing system: the users and the developers.
The users of the system have an architecture viewpoint that reflects their concerns when interacting with the system, and the developers of the system have a different architecture viewpoint. Architecture views that are developed to address either of the two architecture viewpoints are unlikely to exhaustively describe the whole system, because each perspective reduces how each sees the system.
The architecture viewpoint of the user is comprised of all the ways in which the user interacts with the system, not seeing any details such as applications or Database Management Systems (DBMS).
The architecture viewpoint of the developer is one of productivity and tools, and doesn't include things such as actual live data and connections with consumers.
However, there are things that are shared, such as descriptions of the processes that are enabled by the system and/or communications protocols set up for users to communicate problems directly to development.
In this example, one architecture viewpoint is the description of how the user sees the system, and the other architecture viewpoint is how the developer sees the system. Users describe the system from their perspective, using a model of availability, response time, and access to information. All users of the system use this model, and the model has a specific language.
Developers describe the system differently than users, using a model of software connected to hardware distributed over a network, etc. However, there are many types of developers (database, security, etc.) of the system, and they do not have a common language derived from the model.
Tools exist for both users and developers. Tools such as online help are there specifically for users, and attempt to use the language of the user. Many different tools exist for different types of developers, but they suffer from the lack of a common language that is required to bring the system together. It is difficult, if not impossible, in the current state of the tools market to have one tool interoperate with another tool.
Issues relating to the evaluation of tools for architecture work are discussed in detail in Part V, 38. Tools for Architecture Development .
This section attempts to deal with views in a structured manner, but this is by no means a complete treatise on views.
In general, the TOGAF framework embraces the concepts and definitions presented in ISO/IEC/IEEE 42010:2011, specifically the concepts that help guide the development of an architecture view and make the architecture view actionable. These concepts can be summarized as:
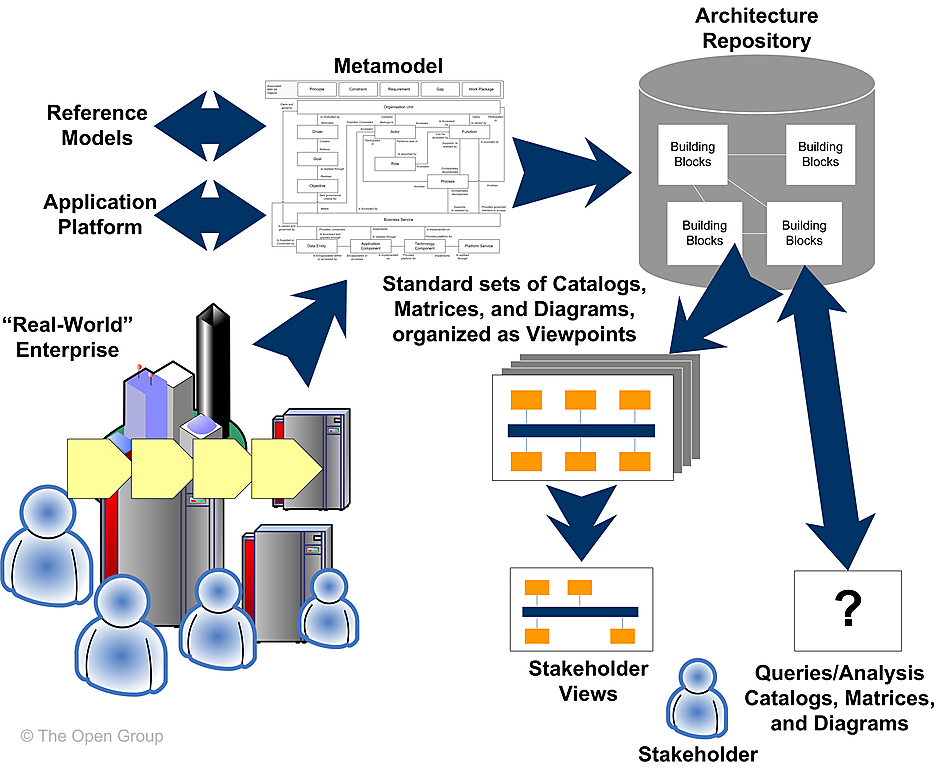
The content metamodel is used as a technique to structure architectural information in an ordered way so that it can be processed to meet the stakeholder needs. The majority of architecture stakeholders do not actually need to know what the architecture metamodel is and are only concerned with specific issues, such as "what functionality does this application support?", "which processes will be impacted by this project?", etc. In order to meet the needs of these stakeholders, the TOGAF concepts of building blocks, catalogs, matrices, and diagrams are used.
Building blocks are entities of a particular type within the metamodel (for example, a business service called "Purchase Order"). Building blocks carry metadata according to the metamodel, which supports query and analysis. For example, business services have a metadata attribute for owner, which allows a stakeholder to query all business services owned by a particular organization. Building blocks may also include dependent or contained entities as appropriate to the context of the architecture (for example, a business service called "Purchase Order" may implicitly include a number of processes, data entities, application components, etc.).
Catalogs are lists of building blocks of a specific type, or of related types, that are used for governance or reference purposes (for example, an organization chart, showing locations and actors). As with building blocks, catalogs carry metadata according to the metamodel, which supports query and analysis.
Matrices are grids that show relationships between two or more model entities. Matrices are used to represent relationships that are list-based rather than graphical in their usage (for example, a CRUD matrix showing which applications Create, Read, Update, and Delete a particular type of data is difficult to represent visually).
Diagrams are renderings of architectural content in a graphical format to allow stakeholders to retrieve the required information. Diagrams can also be used as a technique for graphically populating architecture content or for checking the completeness of information that has been collected. The TOGAF content framework defines a set of architecture diagrams to be created (e.g., organization chart). Each of these diagrams may be created several times for an architecture with different style or content coverage to suit stakeholder concerns.
Building blocks, catalogs, matrices, and diagrams are all concepts that are well supported by leading Enterprise Architecture tools. In environments where tools are used to model the architecture, such tools typically support mechanisms to search, filter, and query the Architecture Repository.
On-demand querying of the Architecture Repository (such as the business service ownership example mentioned above) can be used to generate ad hoc catalogs, matrices, and diagrams of the architecture. As this type of query is by nature required to be flexible, it is therefore not restricted or defined within the content metamodel.
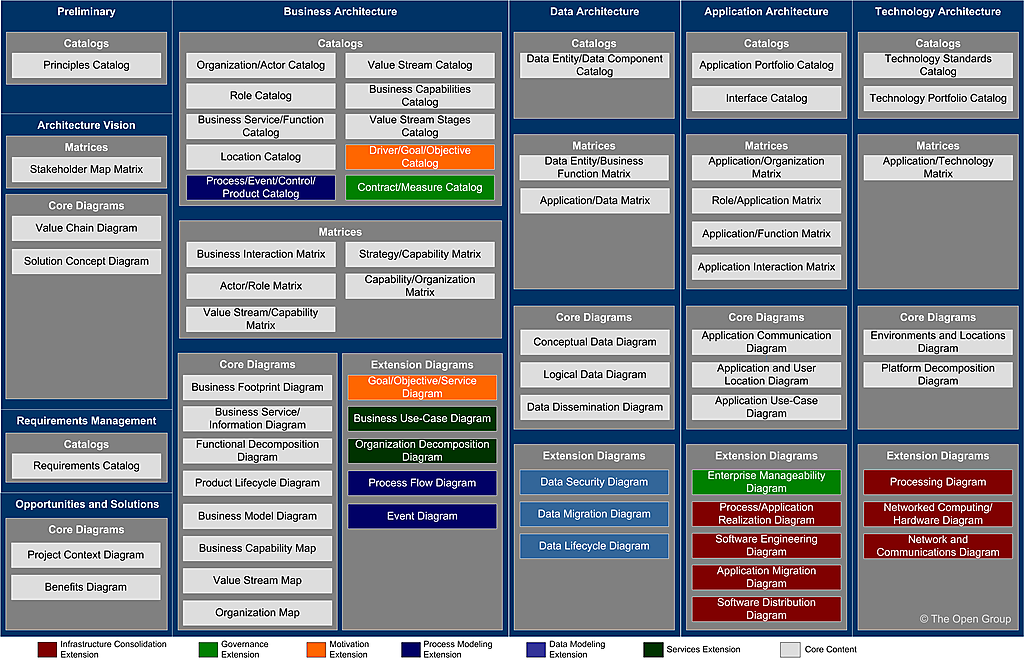
The interactions between metamodel, building blocks, diagrams, and stakeholders are shown in Figure 31-3 . Figure 31-4 shows the artifacts that are associated with the core content metamodel and each of the content extensions.
The recommended artifacts for production in each ADM phase are as follows.
The following describes catalogs, matrices, and diagrams that may be created within the Preliminary Phase, as listed in Part II, 5.4 Outputs .
The Principles catalog captures principles of the Business and Architecture Principles that describe what a "good" solution or architecture should look like. Principles are used to evaluate and agree an outcome for architecture decision points. Principles are also used as a tool to assist in architectural governance of change initiatives.
The Principles catalog contains the following metamodel entities:
The following describes catalogs, matrices, and diagrams that may be created within Phase A (Architecture Vision) as listed in 6.4 Outputs .
The purpose of the Stakeholder Map matrix is to identify the stakeholders for the architecture engagement, their influence over the engagement, and their key questions, issues, or concerns that must be addressed by the architecture framework.
Understanding stakeholders and their requirements allows an architect to focus effort in areas that meet the needs of stakeholders (see Part III, 21. Stakeholder Management).
Due to the potentially sensitive nature of stakeholder mapping information and the fact that the Architecture Vision phase is intended to be conducted using informal modeling techniques, no specific metamodel entities will be used to generate a stakeholder map.
A Value Chain diagram provides a high-level orientation view of an enterprise and how it interacts with the outside world. In contrast to the more formal Functional Decomposition diagram developed within Phase B (Business Architecture), the Value Chain diagram focuses on presentational impact.
The purpose of this diagram is to quickly on-board and align stakeholders for a particular change initiative, so that all participants understand the high-level functional and organizational context of the architecture engagement.
A Solution Concept diagram provides a high-level orientation of the solution that is envisaged in order to meet the objectives of the architecture engagement. In contrast to the more formal and detailed architecture diagrams developed in the following phases, the solution concept represents a "pencil sketch" of the expected solution at the outset of the engagement.
This diagram may embody key objectives, requirements, and constraints for the engagement and also highlight work areas to be investigated in more detail with formal architecture modeling.
Its purpose is to quickly on-board and align stakeholders for a particular change initiative, so that all participants understand what the architecture engagement is seeking to achieve and how it is expected that a particular solution approach will meet the needs of the enterprise.
A model describing the rationale for how an enterprise creates, delivers, and captures value.
A family of diagrams representing a definitive listing of a particular ability that a business may possess or exchange to achieve a specific purpose.
A family of diagrams representing a definitive listing of an end-to-end collection of value-adding activities that create an overall result for a customer, stakeholder, or end user.
The following describes catalogs, matrices, and diagrams that may be created within Phase B (Business Architecture) as listed in 7.4 Outputs .
The purpose of the Organization/Actor catalog is to capture a definitive listing of all participants that interact with IT, including users and owners of IT systems.
The Organization/Actor catalog can be referenced when developing requirements in order to test for completeness.
For example, requirements for an application that services customers can be tested for completeness by verifying exactly which customer types need to be supported and whether there are any particular requirements or restrictions for user types.
The Organization/Actor catalog contains the following metamodel entities:
The purpose of the Driver/Goal/Objective catalog is to provide a cross-organizational reference of how an organization meets its drivers in practical terms through goals, objectives, and (optionally) measures.
Publishing a definitive breakdown of drivers, goals, and objectives allows change initiatives within the enterprise to identify synergies across the organization (e.g., multiple organizations attempting to achieve similar objectives), which in turn allow stakeholders to be identified and related change initiatives to be aligned or consolidated.
The Driver/Goal/Objective catalog contains the following metamodel entities:
The purpose of the Role catalog is to provide a listing of all authorization levels or zones within an enterprise. Frequently, application security or behavior is defined against locally understood concepts of authorization that create complex and unexpected consequences when combined on the user desktop.
If roles are defined, understood, and aligned across organizations and applications, this allows for a more seamless user experience and generally more secure applications, as administrators do not need to resort to workarounds in order to enable users to carry out their jobs.
In addition to supporting security definition for the enterprise, the Role catalog also forms a key input to identifying organizational change management impacts, defining job functions, and executing end-user training.
As each role implies access to a number of business functions, if any of these business functions are impacted then change management will be required, organizational responsibilities may need to be redefined, and retraining may be needed.
The Role catalog contains the following metamodel entities:
The purpose of the Business Service/Function catalog is to provide a functional decomposition in a form that can be filtered, reported on, and queried, as a supplement to graphical Functional Decomposition diagrams.
The Business Service/Function catalog can be used to identify capabilities of an organization and to understand the
level that governance is applied to the functions of an organization. This functional decomposition can be used to identify new
capabilities required to support business change or may be used to determine the scope of change initiatives, applications, or
technology components.
The Business Service/Function catalog contains the following metamodel entities:
The Location catalog provides a listing of all locations where an enterprise carries out business operations or houses architecturally relevant assets, such as data centers or end-user computing equipment.
Maintaining a definitive list of locations allows change initiatives to quickly define a location scope and to test for completeness when assessing current landscapes or proposed target solutions. For example, a project to upgrade desktop operating systems will need to identify all locations where desktop operating systems are deployed.
Similarly, when new systems are being implemented a diagram of locations is essential in order to develop appropriate deployment strategies that comprehend both user and application location and identify location-related issues, such as internationalization, localization, timezone impacts on availability, distance impacts on latency, network impacts on bandwidth, and access.
The Location catalog contains the following metamodel entities:
The Process/Event/Control/Product catalog provides a hierarchy of processes, events that trigger processes, outputs from processes, and controls applied to the execution of processes. This catalog provides a supplement to any Process Flow diagrams that are created and allows an enterprise to filter, report, and query across organizations and processes to identify scope, commonality, or impact.
For example, the Process/Event/Control/Product catalog allows an enterprise to see relationships of processes to sub-processes in order to identify the full chain of impacts resulting from changing a high-level process.
The Process/Event/Control/Product catalog contains the following metamodel entities:
The Contract/Measure catalog provides a listing of all agreed service contracts and the measures attached to those
contracts. It forms the master list of service levels agreed to across the enterprise.
The Contract/Measure catalog contains the following metamodel entities:
A definitive listing of particular abilities that a business may possess or exchange to achieve a specific purpose.
A definitive listing of end-to-end collections of value-adding activities that create an overall result for a customer, stakeholder, or end user.
A definitive listing of end-to-end collections of the different stages for the value-adding activities that create an overall result for a customer, stakeholder, or end user; it includes the following metamodel entities:
The purpose of this matrix is to depict the relationship interactions between organizations and business functions across the enterprise.
Understanding business interaction of an enterprise is important as it helps to highlight value chain and dependencies across organizations.
The Business Interaction matrix shows the following metamodel entities and relationships:
The purpose of this matrix is to show which actors perform which roles, supporting definition of security and skills requirements.
Understanding Actor-to-Role relationships is a key supporting tool in definition of training needs, user security settings, and organizational change management.
The Actor/Role matrix shows the following metamodel entities and relationships:
The purpose of this matrix is to show the capabilities required to support each stage of a value stream.
The purpose of this matrix is to show the capabilities required to support specific strategy statements.
The purpose of this matrix is to show the organization elements that implement each capability. The Capability/Organization matrix includes the following metamodel entities:
A Business Footprint diagram describes the links between business goals, organizational units, business functions, and services, and maps these functions to the technical components delivering the required capability.
A Business Footprint diagram provides a clear traceability between a technical component and the business goal that it satisfies, while also demonstrating ownership of the services identified.
A Business Footprint diagram demonstrates only the key facts linking organization unit functions to delivery services and is utilized as a communication platform for senior-level (CxO) stakeholders.
The Business Service/Information diagram shows the information needed to support one or more business services. The Business Service/Information diagram shows what data is consumed by or produced by a business service and may also show the source of information.
The Business Service/Information diagram shows an initial representation of the information present within the architecture and therefore forms a basis for elaboration and refinement within Phase C (Data Architecture).
The purpose of the Functional Decomposition diagram is to show on a single page the capabilities of an organization that are relevant to the consideration of an architecture. By examining the capabilities of an organization from a functional perspective, it is possible to quickly develop models of what the organization does without being dragged into extended debate on how the organization does it.
Once a basic Functional Decomposition diagram has been developed, it becomes possible to layer heat maps on top of this diagram to show scope and decisions. For example, the capabilities to be implemented in different phases of a change program.
The purpose of the Product Lifecycle diagram is to assist in understanding the lifecycles of key entities within the enterprise. Understanding product lifecycles is becoming increasingly important with respect to environmental concerns, legislation, and regulation where products must be tracked from manufacture to disposal. Equally, organizations that create products that involve personal or sensitive information must have a detailed understanding of the product lifecycle during the development of Business Architecture in order to ensure rigor in design of controls, processes, and procedures. Examples of this would include credit cards, debit cards, store/loyalty cards, smart cards, user identity credentials (identity cards, passports, etc.).
The purpose of a Goal/Objective/Service diagram is to define the ways in which a service contributes to the achievement of a business vision or strategy.
Services are associated with the drivers, goals, objectives, and measures that they support, allowing the enterprise to understand which services contribute to similar aspects of business performance. The Goal/Objective/Service diagram also provides qualitative input on what constitutes high performance for a particular service.
A Business Use-Case diagram displays the relationships between consumers and providers of business services. Business services are consumed by actors or other business services and the Business Use-Case diagram provides added richness in describing business capability by illustrating how and when that capability is used.
The purpose of the Business Use-Case diagram is to help to describe and validate the interaction between actors and their roles to processes and functions. As the architecture progresses, the use-case can evolve from the business level to include data, application, and technology details. Architectural business use-cases can also be re-used in systems design work.
An Organization Decomposition diagram describes the links between actor, roles, and location within an organization tree.
An organization map should provide a chain of command of owners and decision-makers in the organization. Although it is not the intent of the Organization Decomposition diagram to link goal to organization, it should be possible to intuitively link the goals to the stakeholders from the Organization Decomposition diagram.
The purpose of the Process Flow diagram is to depict all models and mappings related to the process metamodel entity.
Process Flow diagrams show sequential flow of control between activities and may utilize swim-lane techniques to represent ownership and realization of process steps. For example, the application that supports a process step may be shown as a swim-lane.
In addition to showing a sequence of activity, process flows can also be used to detail the controls that apply to a process, the events that trigger or result from completion of a process, and also the products that are generated from process execution.
Process Flow diagrams are useful in elaborating the architecture with subject specialists, as they allow the specialist to describe "how the job is done" for a particular function. Through this process, each process step can become a more fine-grained function and can then in turn be elaborated as a process.
The purpose of the Event diagram is to depict the relationship between events and process.
Certain events - such as arrival of certain information (e.g., customer submits sales order) or a certain point in time (e.g., end of fiscal quarter) - cause work and certain actions need to be undertaken within the business. These are often referred to as "business events" or simply "events" and are considered as triggers for a process. It is important to note that the event has to trigger a process and generate a business response or result.
A family of diagrams representing a definitive listing of the particular abilities that a business may possess or exchange to achieve a specific purpose.
A family of diagrams representing a definitive listing of end-to-end collections of value-adding activities that create an overall result for a customer, stakeholder, or end user.
The Value Stream map includes the following metamodel entities:
A diagram showing the relationships between the primary entities that make up the enterprise, its partners, and stakeholders.
The following describes catalogs, matrices, and diagrams that may be created within Phase C (Data Architecture) as listed in 9.4 Outputs .
The purpose of the Data Entity/Data Component catalog is to identify and maintain a list of all the data use across the enterprise, including data entities and also the data components where data entities are stored. An agreed Data Entity/Data Component catalog supports the definition and application of information management and data governance policies and also encourages effective data sharing and re-use.
The Data Entity/Data Component catalog contains the following metamodel entities:
The purpose of the Data Entity/Business Function matrix is to depict the relationship between data entities and business functions within the enterprise. Business functions are supported by business services with explicitly defined boundaries and will be supported and realized by business processes. The mapping of the Data Entity-Business Function relationship enables the following to take place:
The Data Entity/Business Function matrix shows the following entities and relationships:
The purpose of the Application/Data matrix is to depict the relationship between applications (i.e., application components) and the data entities that are accessed and updated by them.
Applications will create, read, update, and delete specific data entities that are associated with them. For example, a CRM application will create, read, update, and delete customer entity information.
The data entities in a package/packaged services environment can be classified as master data, reference data, transactional data, content data, and historical data. Applications that operate on the data entities include transactional applications, information management applications, and business warehouse applications.
The mapping of the Application Component-Data Entity relationship is an important step as it enables the following to take place:
The Application/Data matrix is a two-dimensional table with Logical Application Component on one axis and Data Entity on the other axis.
The key purpose of the Conceptual Data diagram is to depict the relationships between critical data entities within the enterprise. This diagram is developed to address the concerns of business stakeholders.
Techniques used include:
The key purpose of the Logical Data diagram is to show logical views of the relationships between critical data entities within the enterprise. This diagram is developed to address the concerns of:
The purpose of the Data Dissemination diagram is to show the relationship between data entity, business service, and application components. The diagram shows how the logical entities are to be physically realized by application components. This allows effective sizing to be carried out and the IT footprint to be refined. Moreover, by assigning business value to data, an indication of the business criticality of application components can be gained.
Additionally, the diagram may show data replication and application ownership of the master reference for data. In this instance, it can show two copies and the master-copy relationship between them. This diagram can include services; that is, services encapsulate data and they reside in an application, or services that reside on an application and access data encapsulated within the application.
Data is considered as an asset to the enterprise and data security simply means ensuring that enterprise data is not compromised and that access to it is suitably controlled.
The purpose of the Data Security diagram is to depict which actor (person, organization, or system) can access which enterprise data. This relationship can be shown in a matrix form between two objects or can be shown as a mapping.
The diagram can also be used to demonstrate compliance with data privacy laws and other applicable regulations (HIPAA, Sarbanes-Oxley, etc). This diagram should also consider any trust implications where an enterprise's partners or other parties may have access to the company's systems, such as an outsourced situation where information may be managed by other people and may even be hosted in a different country.
Data migration is critical when implementing a package or packaged service-based solution. This is particularly true when an existing legacy application is replaced with a package or an enterprise is to be migrated to a larger package/packaged services footprint. Packages tend to have their own data model and during data migration the legacy application data may need to be transformed prior to loading into the package.
Data migration activities will usually involve the following steps:
The purpose of the Data Migration diagram is to show the flow of data from the source to the target applications. The diagram will provide a visual representation of the spread of sources/targets and serve as a tool for data auditing and establishing traceability. This diagram can be elaborated or enhanced as detailed as necessary. For example, the diagram can contain just an overall layout of migration landscape or could go into individual application metadata element level of detail.
The Data Lifecycle diagram is an essential part of managing business data throughout its lifecycle from conception until disposal within the constraints of the business process.
The data is considered as an entity in its own right, decoupled from business process and activity. Each change in state is represented on the diagram which may include the event or rules that trigger that change in state.
The separation of data from process allows common data requirements to be identified which enables resource sharing to be achieved more effectively.
The following describes catalogs, matrices, and diagrams that may be created within Phase C (Application Architecture) as listed in 10.4 Outputs .
The purpose of this catalog is to identify and maintain a list of all the applications in the enterprise. This list helps to define the horizontal scope of change initiatives that may impact particular kinds of applications. An agreed Application Portfolio allows a standard set of applications to be defined and governed.
The Application Portfolio catalog provides a foundation on which to base the remaining matrices and diagrams. It is
typically the start point of the Application Architecture phase.
The Application Portfolio catalog contains the following metamodel entities:
The purpose of the Interface catalog is to scope and document the interfaces between applications to enable the overall dependencies between applications to be scoped as early as possible.
Applications will create, read, update, and delete data within other applications; this will be achieved by some kind of interface, whether via a batch file that is loaded periodically, a direct connection to another application's database, or via some form of API or web service.
The mapping of the Application Component-Application Component entity relationship is an important step as it enables the following to take place:
The Interface catalog contains the following metamodel entities:
The purpose of this matrix is to depict the relationship between applications and organizational units within the enterprise.
Business functions are performed by organizational units. Some of the functions and services performed by those organizational units will be supported by applications. The mapping of the Application Component-Organization Unit relationship is an important step as it enables the following to take place:
The Application/Organization matrix is a two-dimensional table with Logical/Physical Application Component on one axis and Organization Unit on the other axis.
The relationship between these two entities is a composite of a number of metamodel relationships that need validating:
The purpose of the Role/Application matrix is to depict the relationship between applications and the business roles that use them within the enterprise.
People in an organization interact with applications. During this interaction, these people assume a specific role to perform a task; for example, product buyer.
The mapping of the Application Component-Role relationship is an important step as it enables the following to take place:
The Role/Application matrix is a two-dimensional table with Logical Application Component on one axis and Role on the other axis.
The relationship between these two entities is a composite of a number of metamodel relationships that need validating:
The purpose of the Application/Function matrix is to depict the relationship between applications and business functions within the enterprise.
Business functions are performed by organizational units. Some of the business functions and services will be supported by applications. The mapping of the Application Component-Function relationship is an important step as it enables the following to take place:
The Application/Function matrix is a two-dimensional table with Logical Application Component on one axis and Function on the other axis.
The relationship between these two entities is a composite of a number of metamodel relationships that need validating:
The purpose of the Application Interaction matrix is to depict communications relationships between applications.
The mapping of the application interactions shows in matrix form the equivalent of the Interface Catalog or an Application Communication diagram.
The Application Interaction matrix is a two-dimensional table with Application Service, Logical Application Component, and Physical Application Component on both the rows and the columns of the table.
The relationships depicted by this matrix include:
The purpose of the Application Communication diagram is to depict all models and mappings related to communication between applications in the metamodel entity.
It shows application components and interfaces between components. Interfaces may be associated with data entities where appropriate. Applications may be associated with business services where appropriate. Communication should be logical and should only show intermediary technology where it is architecturally relevant.
The Application and User Location diagram shows the geographical distribution of applications. It can be used to show where applications are used by the end user; the distribution of where the host application is executed and/or delivered in thin client scenarios; the distribution of where applications are developed, tested, and released; etc.
Analysis can reveal opportunities for rationalization, as well as duplication and/or gaps.
The purpose of this diagram is to clearly depict the business locations from which business users typically interact with the applications, but also the hosting location of the application infrastructure.
The diagram enables:
Users typically interact with applications in a variety of ways; for example:
An Application Use-Case diagram displays the relationships between consumers and providers of application services. Application services are consumed by actors or other application services and the Application Use-Case diagram provides added richness in describing application functionality by illustrating how and when that functionality is used.
The purpose of the Application Use-Case diagram is to help to describe and validate the interaction between actors and their roles with applications. As the architecture progresses, the use-case can evolve from functional information to include technical realization detail.
Application use-cases can also be re-used in more detailed systems design work.
The Enterprise Manageability diagram shows how one or more applications interact with application and technology components that support operational management of a solution.
This diagram is really a filter on the Application Communication diagram, specifically for enterprise management class software.
Analysis can reveal duplication and gaps, and opportunities in the IT service management operation of an organization.
The purpose of the Process/Application Realization diagram is to clearly depict the sequence of events when multiple applications are involved in executing a business process.
It enhances the Application Communication diagram by augmenting it with any sequencing constraints, and hand-off points between batch and real-time processing.
It would identify complex sequences that could be simplified, and identify possible rationalization points in the architecture in order to provide more timely information to business users. It may also identify process efficiency improvements that may reduce interaction traffic between applications.
The Software Engineering diagram breaks applications into packages, modules, services, and operations from a development perspective.
It enables more detailed impact analysis when planning migration stages, and analyzing opportunities and solutions.
It is ideal for application development teams and application management teams when managing complex development environments.
The Application Migration diagram identifies application migration from baseline to target application components. It enables a more accurate estimation of migration costs by showing precisely which applications and interfaces need to be mapped between migration stages.
It would identify temporary applications, staging areas, and the infrastructure required to support migrations (for example, parallel run environments, etc).
The Software Distribution diagram shows how application software is structured and distributed across the estate. It is useful in systems upgrade or application consolidation projects.
This diagram shows how physical applications are distributed across physical technology and the location of that technology.
This enables a clear view of how the software is hosted, but also enables managed operations staff to understand how that application software is maintained once installed.
The following section describes catalogs, matrices, and diagrams that may be created within Phase D (Technology Architecture) as listed in 11.4 Outputs .
The Technology Standards catalog documents the agreed standards for technology across the enterprise covering technologies, and versions, the technology lifecycles, and the refresh cycles for the technology.
Depending upon the organization, this may also include location or business domain-specific standards information.
This catalog provides a snapshot of the enterprise standard technologies that are or can be deployed, and also helps identify the discrepancies across the enterprise.
The Technology Standards catalog contains the following metamodel entities:
If technology standards are currently in place, apply these to the Technology Portfolio catalog to gain a baseline view of compliance with technology standards.
The purpose of this catalog is to identify and maintain a list of all the technology in use across the enterprise, including hardware, infrastructure software, and application software. An agreed technology portfolio supports lifecycle management of technology products and versions and also forms the basis for definition of technology standards.
The Technology Portfolio catalog provides a foundation on which to base the remaining matrices and diagrams. It is typically the start point of the Technology Architecture phase.
Technology registries and repositories also provide input into this catalog from a baseline and target perspective.
Technologies in the catalog should be classified against the defined taxonomy in use in the enterprise, such as the TOGAF TRM - see the TOGAF® Series Guide: The TOGAF® Technical Reference Model (TRM) - adapted as necessary to fit the classification of technology products in use.
The Technology Portfolio catalog contains the following metamodel entities:
The Application/Technology matrix documents the mapping of applications to technology platform.
This matrix should be aligned with and complement one or more platform decomposition diagrams.
The Application/Technology matrix shows:
The Environments and Locations diagram depicts which locations host which applications, identifies what technologies and/or applications are used at which locations, and finally identifies the locations from which business users typically interact with the applications.
This diagram should also show the existence and location of different deployment environments, including non-production environments, such as development and pre-production.
The Platform Decomposition diagram depicts the technology platform that supports the operations of the Information Systems Architecture. The diagram covers all aspects of the infrastructure platform and provides an overview of the enterprise's technology platform. The diagram can be expanded to map the technology platform to appropriate application components within a specific functional or process area. This diagram may show details of specification, such as product versions, number of CPUs, etc. or simply could be an informal "eye-chart" providing an overview of the technical environment.
The diagram should clearly show the enterprise applications and the technology platform for each application area can further be decomposed as follows:
Depending upon the scope of the Enterprise Architecture work, additional technology cross-platform information (e.g., communications, telco, and video information) may be addressed.
The Processing diagram focuses on deployable units of code/configuration and how these are deployed onto the technology platform. A deployment unit represents grouping of business function, service, or application components. The Processing diagram addresses the following:
The organization and grouping of deployment units depends on separation concerns of the presentation, business logic, and data store layers and service-level requirements of the components. For example, the presentation layer deployment unit is grouped based on the following:
There are several considerations to determine how application components are grouped together. Each deployment unit is made up of sub-units, such as:
Finally, these deployment units are deployed on either dedicated or shared technology components (workstation, web server, application server, or database server, etc.). It is important to note that technology processing can influence and have implications on the services definition and granularity.
Starting with the transformation to client-server systems from mainframes and later with the advent of e-Business and J2EE, large enterprises moved predominantly into a highly network-based distributed network computing environment with firewalls and demilitarized zones. Currently, most of the applications have a web front-end and, looking at the deployment architecture of these applications, it is very common to find three distinct layers in the network landscape; namely a web presentation layer, a business logic or application layer, and a back-end data store layer. It is a common practice for applications to be deployed and hosted in a shared and common infrastructure environment.
So it becomes highly critical to document the mapping between logical applications and the technology components (e.g., server) that supports the application both in the development and production environments. The purpose of this diagram is to show the "as deployed" logical view of logical application components in a distributed network computing environment. The diagram is useful for the following reasons:
The scope of the diagram can be appropriately defined to cover a specific application, business function, or the entire enterprise. If chosen to be developed at the enterprise level, then the network computing landscape can be depicted in an application-agnostic way as well.
The Network and Communications diagram describes the means of communication - the method of sending and receiving information - between these assets in the Technology Architecture; insofar as the selection of package solutions in the preceding architectures put specific requirements on the communications between the applications.
The Network and Communications diagram will take logical connections between client and server components and identify network boundaries and network infrastructure required to physically implement those connections. It does not describe the information format or content, but will address protocol and capacity issues.
The following section describes catalogs, matrices, and diagrams that may be created within Phase E (Opportunities & Solutions) as listed in 12.4 Outputs .
A Project Context diagram shows the scope of a work package to be implemented as a part of a broader transformation roadmap. The Project Context diagram links a work package to the organizations, functions, services, processes, applications, data, and technology that will be added, removed, or impacted by the project.
The Project Context diagram is also a valuable tool for project portfolio management and project mobilization.
The Benefits diagram shows opportunities identified in an architecture definition, classified according to their relative size, benefit, and complexity. This diagram can be used by stakeholders to make selection, prioritization, and sequencing decisions on identified opportunities.
The following section describes catalogs, matrices, and diagrams that may be created within the Requirements Management phase as listed in 16.4 Outputs .
The Requirements catalog captures things that the enterprise needs to do to meet its objectives. Requirements generated from architecture engagements are typically implemented through change initiatives identified and scoped during Phase E (Opportunities & Solutions). Requirements can also be used as a quality assurance tool to ensure that a particular architecture is fit-for-purpose (i.e., can the architecture meet all identified requirements).
The Requirements catalog contains the following metamodel entities: