Digital Practitioner Body of Knowledge™ Standard
A Standard of The Open Group
Copyright © 2019-2020, The Open Group
All rights reserved.
No part of this publication may be reproduced, stored in a retrieval system, or transmitted, in any form or by any means, electronic, mechanical, photocopying, recording, or otherwise, without the prior permission of the copyright owners.
Any use of this publication for commercial purposes is subject to the terms of the Annual Commercial License relating to it. For further information, see www.opengroup.org/legal/licensing.
The Open Group Standard
Digital Practitioner Body of Knowledge™ Standard
Document Number: C196
ISBN: 1-947754-33-1
Published by The Open Group, January 2020.
Comments relating to the material contained in this document may be submitted to:
The Open Group, Apex Plaza, Forbury Road, Reading, Berkshire, RG1 1AX, United Kingdom
or by electronic mail to:
ogspecs@opengroup.org
Built with asciidoctor, version 2.0.10. Backend: html5 Build date: 2020-01-02 06:47:02 UTC
Preface
The Open Group
The Open Group is a global consortium that enables the achievement of business objectives through technology standards. Our diverse membership of more than 700 organizations includes customers, systems and solutions suppliers, tools vendors, integrators, academics, and consultants across multiple industries.
The mission of The Open Group is to drive the creation of Boundaryless Information Flow™ achieved by:
-
Working with customers to capture, understand, and address current and emerging requirements, establish policies, and share best practices
-
Working with suppliers, consortia, and standards bodies to develop consensus and facilitate interoperability, to evolve and integrate specifications and open source technologies
-
Offering a comprehensive set of services to enhance the operational efficiency of consortia
-
Developing and operating the industry’s premier certification service and encouraging procurement of certified products
Further information on The Open Group is available at www.opengroup.org.
The Open Group publishes a wide range of technical documentation, most of which is focused on development of Standards and Guides, but which also includes white papers, technical studies, certification and testing documentation, and business titles. Full details and a catalog are available at www.opengroup.org/library.
This Document
This document is the Digital Practitioner Body of Knowledge™ Standard, a standard of The Open Group, also known as the DPBoK™ Standard. It has been developed and approved by The Open Group.
The high-level structure of the document is summarized as follows:
-
Chapter 1, Introduction includes the objectives and overview, conformance requirements, and terminology definitions
-
Chapter 2, Definitions includes the terms and definitions for this document
-
Chapter 3, Digital Transformation describes the key concept of Digital Transformation
-
Chapter 4, Principles of the DPBoK Standard describes the principles by which the document will evolve and be maintained, and how Digital Practitioner competencies will be defined
-
Chapter 5, Structure of the Body of Knowledge describes how the Body of Knowledge is structured
-
Chapter 6, The Body of Knowledge contains the Body of Knowledge, divided into four stages, called Contexts, which correspond to the stages of evolution of a digital practice. These stages are explained in the section on Context Summaries, and summarized as follows:
Context I: Individual/Founder
Foundational drivers of, and technical capabilities for, delivering digital value
Context II: Team
The critical product management, collaboration, and operational skills necessary for producing digital value
Context III: Team of Teams
Key capabilities for partitioning investments and ensuring coherence, alignment, and joint execution across multiple teams
Context IV: Enduring Enterprise
Steering, managing risk, and assuring performance at scale and over increasing time horizons and increasingly complex ecosystems
-
Appendices contains the list of abbreviations used in this document
Background and Intended Value of this Work
Applied computing, now popularly termed "digital technology", is transforming economies and societies worldwide. Digital investments are critical for modern organizations. Participating in their delivery (i.e., working to create and manage them for value) can provide prosperity for both individuals and communities. Computing programs worldwide are under pressure to produce an increasing number of qualified professionals to meet voracious workforce demand. And skill requirements have undergone a seismic shift over the past 20 years. Digital Practitioners require a wide variety of skills and competencies, including cloud architecture and operations, continuous delivery and deployment, collaboration, Agile and Lean methods, product management, and more.
Industry guidance has over the years become fragmented into many overlapping and sometimes conflicting bodies of knowledge, frameworks, and industry standards. The emergence of Agile [8] and DevOps [165] as dominant delivery forms has thrown this already fractured ecosystem of industry guidance into chaos. Organizations with longstanding commitments to existing bodies of knowledge are re-assessing those commitments. Changes in digital delivery are happening too fast for generational turnover to suffice.
Mid-career IT professionals, who still anticipate many more years in the workforce, are especially at risk. Learning the new "digital" approaches is not optional for them. But how to reconcile these new practices with the legacy "best practices" that characterized these workers' initial professional education? Now is the time to re-assess and synthesize new guidance reflecting the developing industry consensus on how digital and IT professionals should approach their responsibilities. Modern higher education is not keeping pace in these topics either. There has been too much of a gap between academic theory and classroom instruction versus the day-to-day practices of managing digital products.
The Digital Practitioner in today’s work environment thus encounters a confusing and diverse array of opinions and diverging viewpoints. This document aims to provide a foundational set of concepts for the practitioner to make sense of the landscape they find in any organization attempting to deliver digital products. It strives to put both old and new in a common context, with well-supported analysis of professional practice. Practically, it should be of value for both academic and industry training purposes.
In conclusion: this document is intended broadly for the development of the Digital Practitioner or professional. It seeks to provide guidance for both new entrants into the digital workforce as well as experienced practitioners seeking to update their understanding on how all the various themes and components of digital and IT management fit together in the new world.
Sources of Material
While this document draws from a wide variety of industry sources, there are two primary sources of material of this work.
The Forums of The Open Group
The Open Group has a number of different related programs of work that contributed substantially to the content of, and interest in, the DPBoK Standard (this document). The initial groundwork was laid by the Digital Business Customer Experience (DBCX) Work Group, which was the predecessor to the Digital Practitioners Work Group, the current maintainers of this document. In addition, this document is informed by and makes reference to other Forums of The Open Group, including:
-
The Architecture Forum
-
The Open Platform 3.0™ Forum
-
The IT4IT™ Forum
The University of St. Thomas
This work is in part derived from material developed by Charles Betz between 2014 and 2017 for use in teaching in the Graduate Programs in Software Engineering at the University of St. Thomas in St. Paul, Minnesota, USA, for SEIS 660 (IT Infrastructure Management), later replaced by SEIS 664 (Information Technology Delivery). Graduate Programs in Software at University of St. Thomas offers Masters' degrees in Software Engineering, Data Science, Information Technology, and Software Management. It is the largest program of its kind in the US and emphasizes rigorous, realistic preparation of practitioners. No suitable collegiate texts were available providing comprehensive survey coverage of the Digital/Lean/Agile transition and its impacts on IT management generally, so this material was developed collaboratively, incrementally, and iteratively via an open Github project over the course of three years.
Relationship to Prior Publications
The resulting textbook, Managing Digital: Concepts and Practices, was contributed by the author and published by The Open Group Press to serve as an experiment in collaborative, open source document development, and also to support worldwide distribution on a low/no-cost basis. That material is separate and distinct from this document, but the agreement allows for the "harvesting" of material from that text. Such harvesting will not be cited, as it is expected to be substantial. The reader of both documents will, therefore, notice deliberate similarities and identical passages. However, the textbook also includes extensive quotations, sidebars, anecdotes, cases, tangential elements, personal observations, exercises, and so forth that will not be found in this document. In general, this document is briefer, drier, and written with a normative should/shall/may/must framing (see IETF RFC 2119, [40]). Eventually, the textbook may be the basis for a "Guide", supporting this document in the same way that (for example) the IT4IT Management Guide [12] supports the IT4IT Standard. See definitions of Standard versus Guide in The Open Group Standards Process [280].
Curation Approach
Relationship of this Document to Other Bodies of Knowledge
This document may source knowledge from other bodies of knowledge. One of the reasons for the existence of this document is that a constellation of new best practices and approaches based on cloud, Agile, Lean, and DevOps is overtaking older approaches based on physical infrastructure, project management, process management, and functional specialization. The Phoenix Project [165] is a useful introduction to the new approaches; evidence of their effectiveness can be seen in the publicly available videos of practitioner case studies presented at the DevOps Enterprise Summit.
Interpretive Aspects
This document should not merely be an assemblage of other sources, however. It may include well-grounded synthesis and interpretation of the curated source material. See the DPBoK principles for further information.
Evidence of Notability
In the current fast-paced digital economy, curating notable and rigorous work by individuals on a fair-use basis into the standard seems advisable.
This will require an ongoing discussion and debate as to relevance and notability of the material. DevOps, design thinking, Agile methods, Site Reliability Engineering (SRE), and many other concepts have emerged of late. How do we know that they are notable and relevant? That they have staying power and merit inclusion? A proposed set of heuristics follows:
-
Existence of an organized community – is there evidence for a concept’s interest in terms of practitioners self-identifying under its banner and choosing to spend their resources attending local, national, or international events?
-
Notable publications – are books in print on the topic from reputable publishers; e.g., O’Reilly or Addison-Wesley? Are these books garnering reviews on Amazon or Goodreads?
-
Media and analyst coverage – there is an active community of professional commentary and analysis; its attention to a given topic is also evidence of notability – social media attention is an important, but not conclusive, subset of this class of evidence (it can be too easily manipulated)
The use of a given body of knowledge or other guidance as broadly used audit criteria (e.g., cloud provider compliance) shall be construed as evidence of notability.
Trademarks
ArchiMate®, DirecNet®, Making Standards Work®, Open O® logo, Open O and Check® Certification logo, OpenPegasus®, Platform 3.0®, The Open Group®, TOGAF®, UNIX®, UNIXWARE®, and the Open Brand X® logo are registered trademarks and Boundaryless Information Flow™, Build with Integrity Buy with Confidence™, Dependability Through Assuredness™, Digital Practitioner Body of Knowledge™, DPBoK™, EMMM™, FACE™, the FACE™ logo, IT4IT™, the IT4IT™ logo, O-DEF™, O-HERA™, O-PAS™, Open FAIR™, Open Platform 3.0™, Open Process Automation™, Open Subsurface Data Universe™, Open Trusted Technology Provider™, O-SDU™, Sensor Integration Simplified™, SOSA™, and the SOSA™ logo are trademarks of The Open Group.
Airbnb™ is a trademark of Airbnb, Inc.
Amazon Web Services® is a registered trademark and Amazon™, AWS™, and Kindle™ are trademarks of Amazon.com, Inc. or its affiliates.
Android™ is a trademark of Google LLC.
Apache®, Apache Mesos®, and CouchDB® are registered trademarks of the Apache Software Foundation (ASF).
Apple®, iPhone®, and MacBook Air® are registered trademarks of Apple Inc.
BABOK® and Business Analysis Body of Knowledge® are registered trademarks owned by International Institute of Business Analysis.
CISSP® is a registered certification mark of the International Information Systems Security Certification Consortium, Inc.
COBIT® is a registered trademark of ISACA.
Debian® is a registered trademark owned by Software in the Public Interest, Inc.
DMBOK® is a registered trademark of DAMA International.
Etsy® is a registered trademark of Etsy, Inc., in the US and/or other countries.
Facebook® is a registered trademark of Facebook, Inc.
Flickr® and Yahoo® are registered trademarks of Yahoo, Inc.
Google® is a registered trademark and Google Compute Engine™ is a trademark of Google LLC.
IBM® is a registered trademark of International Business Machines Corporation in the United States, other countries, or both.
ITIL® and PRINCE2® are registered trademarks of AXELOS Limited.
LinkedIn® is a registered trademarks of LinkedIn Corporation and its affiliates in the United States and/or other countries.
Linux® is a registered trademark of Linus Torvalds in the US and other countries.
Lyft™ is a trademark of Lyft, Inc.
Microsoft® is a registered trademark and Azure™, PowerPoint™, and Visio™ are trademarks of Microsoft Corporation in the United States and/or other countries.
Netflix® is a registered trademark of Netflix, Inc.
NGINX™ is trademark of NGINX, Inc.
OmniGraffle™ is a trademark of The Omni Group.
Oracle® and Java® are registered trademarks and JavaScript™ is a trademark of Oracle and/or its affiliates.
PMBOK®, Project Management Body of Knowledge®, and Project Management Institute® are registered trademarks of the Project Management Institute, Inc.
RabbitMQ® is a registered trademark of Pivotal Software, Inc. in the US and other countries.
SABSA® is a registered trademark of The SABSA Institute.
Scaled Agile Framework® and SAFe® are registered trademarks of Scaled Agile, Inc.
Spotify™ is a trademark of Spotify AB.
UML® is a registered trademark and BPMN™, Business Process Modeling Notation ™, and Unified Modeling Language™ are trademarks of Object Management Group, Inc. in the United States and/or other countries.
Zachman® is a registered trademark of Zachman International, Inc.
All other brands, company, and product names are used for identification purposes only and may be trademarks that are the sole property of their respective owners.
Acknowledgments
The Open Group gratefully acknowledges the contribution of the following people in the development of this document:
-
Charles Betz
-
Georg Bock
-
James Doss
-
Michael Fulton
-
Jim Hietala
-
Mohan Hiremath
-
Dave Hornford
-
Frédéric Le
-
Antoine Lonjon
-
Dave Lounsbury
-
Robert Martin
-
Sriram Sabesan
-
Mark Smalley
Many assisted with and/or contributed to this work before its transition to The Open Group:
-
Glen Alleman
-
Brad Appleton
-
David Bahn
-
Jason Baker
-
Richard Barton
-
Jabe Bloom
-
Terry Brown
-
Kate Campise
-
Murray Cantor
-
Rob England
-
Nicole Forsgren
-
Stephen Fralippolippi
-
Svetlana Gluhova
-
Will Goddard
-
Lorin Hochstein
-
Jez Humble
-
Majid Iqbal
-
Mark Kennaley
-
Firasat Khan
-
Gene Kim
-
Dmitry and Alina Kirsanov
-
Mary Lebens
-
Evan Leybourn
-
Tom Limoncelli
-
Chris Little
-
Mary Mosman
-
Mark Mzyk
-
Sriram Narayam
-
Amos Olagunju
-
Justin Opatrny
-
Pat Paulson and his students
-
Francisco Piniero
-
Ben Rockwood
-
Mark Smalley
-
John Spangler
-
Grant Spencer
-
Jeff Sussna
-
Halbana Tarmizi
-
Roger K. Williams
Referenced Documents
Normative References
This document does not contain any normative references at the time of publication. These may be added in a future release.
Informative References
-
Thinking in Systems: A Primer by Donella Meadows. White River Junction, VT: Chelsea Green Publishing Company, 2008.
-
Agile Hiring by Sean Landis. Walnut Creek, California: Artima, Inc, 2011.
-
“The Secret to Amazon’s Success ‒ Internal APIs, by Kin Lane,” The API Evangelist. 2012.
-
M. L. Abbott and M. T. Fisher, The Art of Scalability: Scalable Web Architecture, Processes, and Organizations for the Modern Enterprise (2nd Edition). Old Tappan, NJ: Pearson Education, Inc., 2015.
-
D. M. Abrashoff, It’s Your Ship: Management Techniques from the Best Damn Ship in the Navy, 10Th Anniv. Grand Central Publishing, 2012.
-
G. Adzic, Impact Mapping: Making a big impact with software products and projects. Gojko Adzic, 2012.
-
Agile Alliance, “Agile Manifesto and Principles,” no. 4/13/2011. 2001.
-
A. Akera, “Edmund Berkeley and the Origins of the ACM,” Communications of the ACM, vol. 50, no. 5, pp. 31–35, 2007.
-
R. Akershoek, “IT4IT™ for Managing the Business of IT.” 2016.
-
J. Allspaw and P. Hammond, “10 deploys per day: Dev & ops cooperation at Flickr,” Velocity 2009. O’Relly Publications, San Jose, CA, 2009.
-
J. Allspaw and J. Robbins, Web operations, 1st ed. Beijing China ; Sebastopol, CA: O’Reilly, 2010, pp. xvii, 315 p.
-
A. C. Alonzo and A. W. Gotwals, Learning Progressions in Science. Rotterdam: Sense Publishers, 2012.
-
S. Ambler, “Agile Outsourcing,” Dr. Dobb’s Journal, Mar. 2005.
-
S. Ambler, “Agility@Scale: Strategies for Scaling Agile Software Development.” 2015.
-
S. W. Ambler and M. Lines, Disciplined Agile Delivery: A Practitioner’s Guide to Agile Software Delivery in the Enterprise. 2012, pp. 1–2.
-
S. W. Ambler and P. J. Sadalage, Refactoring databases : evolutionary database design. Harlow, U.K.: Addison-Wesley, 2006, pp. xxvii, 350 p.
-
D. J. Anderson, Kanban: Successful Evolutionary Change for your Technology Business. Sequim, WA: Blue Hole Press, 2010.
-
T. Arbogast, B. Vodde, and C. Larman, “Agile Contracts Primer.” 2012.
-
J. Arnold, “Tilt the playing field: discover, nurture, and speed up the delivery of value.” Liberio, 2013.
-
C. Bank and J. Cao, The Guide to Usability Testing. uxpin.com, 2016.
-
K. Beck, extreme programming eXplained : embrace change. Reading, MA: Addison-Wesley, 2000, pp. xxi, 190 p.
-
S. Beer, “What is cybernetics?,” Kybernetes, vol. 31, no. 2, pp. 209–219, 2002.
-
S. Bell et al., Run grow transform : integrating business and lean IT. Boca Raton, FL: CRC Press, 2013, pp. xlii, 336 p.
-
S. C. Bell and M. A. Orzen, Lean IT: Enabling and Sustaining Your Lean Transformation. Boca Raton, Florida: CRC Press, 2010.
-
S. Bente, U. Bombosch, and S. Langade, Collaborative Enterprise Architecture: Enriching EA with Lean, Agile, and Enterprise 2.0 Practices. Waltham, MA: Morgan Kaufman - Elsevier, 2012.
-
S. Bernard, An Introduction to Enterprise Architecture. AuthorHouse, 2012.
-
C. Betz, “Release management integration pattern - seeking devops comments,” Lean4IT: The architecture of IT value, vol. 2014. 2011.
-
C. Betz, “The CMDB is not a data warehouse,” Integrated IT Management. Enterprise Management Associates, 2011.
-
C. T. Betz, Architecture and Patterns for IT: Service and Portfolio Management and Governance (Making Shoes for the Cobbler’s Children), 2nd Edition. Amsterdam: Elsevier/Morgan Kaufman, 2011.
-
C. T. Betz, “A DevOps Causal Loop Diagram parts 1 and 2,” Lean4IT: The architecture of IT value. 2013.
-
B. Beyer, C. Jones, J. Petoff, and N. R. Murphy, Site Reliability Engineering: How Google Runs Production Systems. Sebastopol, CA: O’Reilly Media, Inc., 2016.
-
J. Bezos, “Jeff Bezos’ 2016 Letter to Amazon Shareholders.” 2016.
-
S. Blank, The Four Steps to the Epiphany: Successful Strategies for Products That Win, 2nd ed. Steve Blank, 2013.
-
J. Bloomberg, “Agile Enterprise Architecture Finally Crosses the Chasm,” Forbes. Jul-2014.
-
B. Boehm, “A Spiral Model of Software Development and Enhancement,” IEEE Computer, vol. 21, no. 5, pp. 61–72, 1988.
-
L. Bossavit, “The Leprechauns of Software Engineering: How folklore turns into fact and what to do about it.” 2015.
-
D. Breston, “DevOps and SIAM: The Happy Nexus,” ITSMTools.com blog. 2017.
-
F. P. Brooks, The mythical man-month : essays on software engineering. Reading, Mass.: Addison-Wesley Pub. Co., 1975, pp. xi, 195 p.
-
F. P. Brooks, The mythical man-month : essays on software engineering, Anniversar. Reading, Mass.: Addison-Wesley Pub. Co., 1995, pp. xiii, 322 p.
-
A. Brown, N. Forsgren, J. Humble, N. Kersten, and G. Kim, “2016 State of DevOps report,” Puppet Labs, 2016.
-
J. Brustein, “Microsoft Kills Its Hated Stack Rankings. Does Anyone Do Employee Reviews Right?,” Bloomberg Business Week. 2013.
-
M. Buckingham and A. Goodall, “Reinventing performance management,” Harvard Business Review, vol. 93, no. 4, pp. 40–50, 2015.
-
M. Burgess, “When and where order matters,” homepage mark burgess. .
-
M. Burrows, Kanban from the Inside: Understand the Kanban Method, connect it to what you already know, introduce it with impact (Kindle ed.), Kindle. Sequim, Washington: Blue Hole Press, 2015.
-
M. G. I. Burrows, “The Chubby lock service for loosely-coupled distributed systems,” in _ 7th symposium on Operating systems design and implementation (OSDI ’06)_, 2006, pp. Pages 335–350 .
-
Business Architecture Guild, A Guide to the Business Architecture Body of Knowledge (BIZBOK Guide). Business Architecture Guild, 2016.
-
B. Butler, “Free cloud storage service MegaCloud goes dark,” Network World. 2013.
-
B. Butler, “Cloud’s worst-case scenario: What to do if your provider goes belly up,” Network World. 2014.
-
M. Cagan, Inspired: How to Create Products Customers Love. SVPG Press, 2008.
-
S. K. Card, J. D. Mackinlay, and B. Shneiderman, Readings in Information Visualization: Using Vision to Think. San Diego: Academic Press, 1999.
-
N. Carr, “IT Doesn’t Matter,” Harvard Business Review, pp. 5–12, 2003.
-
K. Cherry, “Multitasking: Bad for Your Productivity and Brain Health,” verywell.com. 2016.
-
M. Cherubini, G. Venolia, R. Deline, and A. J. Ko, “Let ’ s Go to the Whiteboard: How and Why Software Developers Use Drawings,” CHI 2007 Proceedings, pp. 557–566, 2007.
-
J. Choi, “The Science Behind Why Jeff Bezos’s Two-Pizza Team Rule Works.” Jan-2014.
-
C. Christensen, S. Cook, and T. Hall, “What Customers Want from Your Products,” Working Knowledge (Harvard Business School). 2006.
-
Clayton Christensen Institute, “Jobs to be Done,” http://www.christenseninstitute.org/. 2015.
-
Cloud Native Computing Foundation, “CNCF Cloud Native Definition v1.0,” CNCF TOC repository. 2018.
-
R. Coase, “The nature of the firm,” Economica, vol. 4, pp. 386–405, 1937.
-
A. Cockburn, “Walking skeleton,” http://alistair.cockburn.us/. 1996.
-
A. Cockburn, Agile Software Development: The Cooperative Game, 2nd ed. Boston, MA: Pearson Education, Inc., 2007.
-
M. Cohn, “Agile estimating and planning,” in VTT Symposium (Valtion Teknillinen Tutkimuskeskus), 2006, no. 241, pp. 37–39.
-
M. Cohn, Succeeding with Agile: Software Development Using Scrum. Upper Saddle River, New Jersey: Addison-Wesley, 2010.
-
S. Comella-Dorda, L. Santiago, and G. Speksnijder, “An operating model for company-wide agile development,” McKinsey & Company. 2016.
-
Committee on the Financial Aspects of Corporate Governance, “Report of the Committee on the Financial Aspects of Corporate Governance (aka Cadbury Report),” Gee and Co, Ltd., London, 1992.
-
Computer History Museum, “Memory & Storage,” Timeline of Computer History. 2019.
-
W. Contributors, “Technology Business Management Council,” Wikipedia, The Free Encyclopedia. 2019.
-
A. Cooper, R. Reimann, and D. Cronin, “About Face 3: The Essentials of Interaction Design.” 2009.
-
Cornell University, “Explaining Why the Millenium Bridge Wobbled,” Science Daily. 2005.
-
COSO Commission, “Internal Control — Integrated Framework (2013).” 2013.
-
M. Csikszentmihalyi, Flow : the psychology of optimal experience, 1st ed. New York: Harper & Row, 1990, pp. xii, 303 p.
-
W. Cunningham, “Experience Report: The WyCash Portfolio Management System,” OOPSLA ’92, vol. 4, no. 2. pp. 29–30, Mar-1992.
-
W. Cunningham, “Do The Simplest Thing That Could Possibly Work,” wiki.c2.com. 2014.
-
T. Data Management Association, The DAMA Guide to The Data Management Body of Knowledge (DAMA-DMBOK Guide). Bradley Beach, NJ: Technics Publications, LLC, 2009.
-
Dave Hornford, Sriram Sabesan, Vidhya Sriram, and Ken Street, “The Seven Levers of Digital Transformation,” The Open Group, 2017.
-
A. De Nicola and M. Missikoff, “A Lightweight Methodology for Rapid Ontology Engineering,” Communications of the ACM2, vol. 59, no. 3, pp. 79–86, 2016.
-
S. Dekker, The Field Guide to Understanding ’Human Error.’ Burlington, VT: Ashgate Publishing Company, 2006.
-
J. DeLuccia, IT COMPLIANCE AND CONTROLS: Best Practices for Implementation. Hoboken, N.J.: John Wiley & Sons, Inc., 2008.
-
J. DeLuccia, J. Gallimore, G. Kim, B. Miller, and J. D. L. & J. G. & G. K. & B. Miller, “DevOps Audit Defense Toolkit,” IT Revolution, 2015.
-
DHS, “Report No. 2006-03, The Use of Commercial Data,” DHS Data Privacy and Integrity Advisory Committee, 2006.
-
A. E. Ditri, J. C. Shaw, and W. Atkins, Managing the EDP function. N.Y.: McGraw-Hill, 1971.
-
D. Drogseth, “The Enterprise Service Catalog - Unifying IT Services for the Digital Age,” APM Digest. 2016.
-
P. F. Drucker, Post-capitalist society, 1st ed. New York, NY: HarperBusiness, 1993, pp. 232 p.
-
D. du Preez, “A CIO’s worst nightmare: When your cloud provider goes bankrupt,” diginomica. 2015.
-
R. Dunbar, How Many Friends Does One Person Need? Dunbar’s Number and Other Evolutionary Quirks. Harvard University Press, 2010.
-
P. M. Duvall, S. Matyas, and A. Glover, Continuous integration : improving software quality and reducing risk. Upper Saddle River, NJ: Addison-Wesley, 2007, pp. xxxiii, 283 p.
-
K. M. Eisenhardt, “Agency Theory: An Assessment and Review,” Source: The Academy of Management Review Academy of Management Review, vol. 14, no. 1, pp. 57–74, 1989.
-
R. England, Plus! The Standard+Case Approach: See Service Response in a New Light. Mana, New Zealand: Two Hills Ltd., 2013.
-
R. England, “Service catalogue and request catalogue,” IT Skeptic Blog. 2016.
-
E. Evans, Domain-driven design : tackling complexity in the heart of software. Boston ; London: Addison-Wesley, 2004, pp. xxx, 528 p.
-
R. P. Feynman, “Cargo Cult Science,” Engineering and Science, vol. 33, pp. 10–13, 1974.
-
N. Forsgren, “Continuous Delivery + DevOps = Awesome.” 2016.
-
N. Forsgren, J. Humble, and G. Kim, Accelerate: Building and Scaling High Performing Technology Organizations. Portland, OR: IT Revolution Press, 2018.
-
N. Forsgren, G. Kim, N. Kersten, and J. Humble, “2014 State of DevOps Report,” Puppet Labs, 2014.
-
M. Fowler, Patterns of enterprise application architecture. Boston: Addison-Wesley, 2003, pp. xxiv, 533.
-
A. Fox, E. A. Brewer, and A. Fox, “Harvest, Yield and Scalable Tolerant Systems,” 7th Workshop Hot Topics in Operating Systems (HotOS 99). IEEE CS, 1999.
-
J. Gall, The Systems Bible: The beginner’s guide to systems large and small. General Systemantics Pr/Liberty, 2012.
-
E. Gamma, R. Helm, R. Johnson, and J. Vlissides, Design patterns : elements of reusable object-oriented software. Reading, Mass.: Addison-Wesley, 1995, pp. xv, 395.
-
A. Gawande, The Checklist Manifesto. New York, N.Y: Picador, 2010.
-
R. Gillett, “Productivity Hack Of The Week: The Two Pizza Approach To Productive Teamwork | Fast Company | Business + Innovation,” fastcompany.com. 2014.
-
R. L. Glass, Software runaways. Upper Saddle River, NJ: Prentice Hall PTR, 1998, pp. xvi, 259.
-
E. M. Goldratt, Critical chain. Great Barrington, Ma.: North River, 1997, pp. 246 p.
-
B. Goodwin, “How CIOs can raise their ’IT clock speed’ as pressure to innovate grows,” ComputerWeekly.com. 2015.
-
J. Gothelf and J. S. Seiden, Lean UX: Applying Lean Principles to Improve User Experience. Sebastopol, CA: O’Reilly Media, Inc., 2013.
-
Great Schools Partnership, “Learning Progression,” Glossary of Education Reform. 2013.
-
M. Griffin, How To Write a Policy Manual. www.templatezone.com, 2016.
-
T. Griffin, “Two Powerful Mental Models: Network Effects and Critical Mass – Andreessen Horowitz,” Andreessen Horowitz. .
-
G. Gruver, M. Young, and P. Fulghum, A Practical Approach to Large-Scale Agile Development: How HP Transformed Laserjet Futuresmart Firmware. Upper Saddle River, N.J.: Pearson Education, Inc., 2013, pp. xxiv, 183 pages.
-
E. Hallikainen, “Service Catalog and Configuration Management Database as the Foundation of SIAM,” PhD thesis, 2015.
-
P. Hammant, “Legacy Application Strangulation : Case Studies,” Paul Hammant’s Blog. 2013.
-
M. Hammer and J. Champy, Reengineering the corporation. London: Nicholas Brealey, 1993, pp. vi,223p.
-
V. Harnish, Scaling Up: How a Few Companies Make It…and Why the Rest Don’t. Gazelles, Inc., 2014.
-
P. Harpring, Introduction to Controlled Vocabularies: Terminology for Art, Architecture and other Cultural Works. Los Angeles, CA: Getty Publications, 2010.
-
S. Harris, CISSP Exam Guide, 6th ed. New York: McGraw-Hill Education, 2013.
-
L. Hassi and M. Laakso, “Design thinking in the management discourse: Defining the elements of the concept,” in 18th international product development conference, Delft, 2011.
-
R. Hastings, “Netflix Culture: Freedom & Responsibility,” Slideshare.net. 2009.
-
D. C. Hay, Data model patterns : conventions of thought. New York: Dorset House ; Chichester : Wiley [distributor], 1996, pp. xix,268p.
-
M. Heller, “GE’s Jim Fowler on the CIO role in the digital industrial economy,” CIO Magazine Online. 2016.
-
G. Hohpe and B. Woolf, Enterprise integration patterns : designing, building, and deploying messaging solutions. Boston ; London: Addison-Wesley, 2003, pp. . cm.
-
J. H. Holland, “Studying Complex Adaptive Systems,” Journal of Systems Science and Complexity, vol. 19, no. 1, pp. 1–8, Mar. 2006.
-
J. Hope and R. Fraser, “Beyond Budgeting Questions and Answers,” Beyond Budgeting Round Table, 2001.
-
M. Housman and D. Minor, “Toxic Workers,” Harvard Business School, 2015.
-
D. W. Hubbard, The Failure of Risk Management. Hoboken, New Jersey: John Wiley & Sons, Inc., 2009.
-
D. W. Hubbard, How to measure anything : finding the value of "intangibles" in business, 2nd ed. Hoboken, N.J.: Wiley, 2010, pp. xv, 304 p.
-
J. Humble, “The Flaw at the Heart of Bimodal IT,” Continuousdelivery.com. 2016.
-
J. Humble and J. Molesky, “Why Enterprises Must Adopt Devops to Enable Continuous Delivery,” Cutter IT Journal, vol. 24, no. 8, 2011.
-
J. Humble, J. Molesky, and B. O’Reilly, Lean enterprise, First edit. 2013, pp. xxi, 317 pages.
-
J. Humble, J. Molesky, and B. O’Reilly, Lean Enterprise: Adopting Continuous Delivery, DevOps, and Lean Startup at Scale. 2014.
-
J. R. Huntzinger, Lean Cost Management: Accounting for Lean by Establishing Flow. Fort Lauderdale, Fl.: J. Ross Publishing, 2007.
-
IEEE, “Software Engineering Body of Knowledge, version 3,” IEEE, 2014.
-
International Auditing and Assurance Standards Board (IAASB), “ISAE 3000 (Revised), Assurance Engagements Other than Audits or Reviews of Historical Financial Information,” International Federation of Accountants, 2013.
-
International Institute of Business Analysis (IIBA), BABOK v3: A Guide to the Business Analysis Body of Knowledge. Toronto, Canada: International Intitute of Business Analysis, 2015.
-
E. Isaacs and A. Walendowski, Designing from both sides of the screen: How Designers and Engineers Can Collaborate to Build Cooperative Technology. Indianapolis, Indiana: New Riders Publishing, 2002.
-
ISACA, COBIT 5 for Information Security. Rolling Meadows, IL: ISACA, 2012.
-
ISACA, COBIT 5 for Assurance. Rolling Meadows, IL: ISACA, 2013.
-
ISACA, ITAF: A Professional Practices Framework for IS Audit/ Assurance, 3rd Edition. Rolling Meadows, IL: ISACA, 2014.
-
ISACA, “COBIT 2019 Framework: Introduction and Methodology,” ISACA, Schaumberg, IL, 2018.
-
ISACA, “IT Control Objectives for Sarbanes-Oxley Using COBIT 5, 3rd Edition.,” ISACA, 2019.
-
ISO/IEC, “ISO/IEC 7498-1: Open Systems Interconnection – Basic Reference Model: The Basic Model,” International Organization for Standardization, 1994.
-
ISO/IEC, “ISO/IEC 38500 - Corporate governance of information technology.” 2008.
-
ISO/IEC/IEEE, “ISO/IEC/IEEE 42010:2011 - Systems and software engineering – Architecture description,” March, 2011.
-
IT Governance Institute, “IT Controls Objectives for Sarbanes-Oxley,” IT Governance Institute, Rolling Meadows, IL, 2006.
-
F. Ivancsich, R. Kruse, and D. Sharrock, “Why ‘Real Options’ is the biggest fail of the Agile Community so far,” www.agile42.com. 2013.
-
S. H. Kan, Metrics and models in software quality engineering. Reading, Mass.: Addison-Wesley, 1995, pp. xvii, 344.
-
C. Kaner, J. L. Falk, and H. Q. Nguyen, Testing computer software, 2nd ed. New York: Wiley, 1999, pp. xv, 480.
-
R. M. Kanter, The change masters : innovations for productivity in the American corporation. New York: Simon and Schuster, 1983, pp. 432 p.
-
R. S. Kaplan and D. P. Norton, “The balanced scorecard - measure that drive performance.,” Harvard Business Review, no. January-February, pp. 71–79, 1992.
-
M. Kennaley, Sdlc 3.0: Beyond a Tacit Understanding of Agile: Towards the Next Generation of Software Engineering. Fourth Medium Consulting, 2010.
-
G. Kim, K. Behr, and G. Spafford, The Phoenix Project: A Novel About IT, DevOps, and Helping Your Business Win. IT Revolution Press, 2013.
-
G. Kim, J. Humble, P. Debois, and J. Willis, The DevOps Handbook. Portland, OR: IT Revolution Press, 2016.
-
G. Klein, P. J. Feltovich, and D. D. Woods, “Common Ground and Coordination in Joint Activity,” in Organizational simulation, Hoboken, New Jersey: John Wiley & Sons, Inc., 2005.
-
M. Knez and D. Simester, “Making Across-the-Board Incentives Work,” Harvard Business Review, no. Feb 2002, 2002.
-
H. Kniberg and A. Ivarsson, “Scaling Agile @ Spotify with Tribes, Squads, Chapters & Guilds,” Jan. 2012.
-
R. Kohavi, T. Crook, and R. Longbotham, “Online Experimentation At Microsoft.” 2009.
-
B. Kos, “Kanban – Visualize your workflow - AgileLeanLife,” agileleanlife.com. 2016.
-
C. Ladas, Scrumban. Modus Cooperandi Press (January 12, 2009), 2009.
-
D. Laney, “3D Data Management: Controlling Data Volume, Velocity, and Variety,” Meta Group (now Gartner), 2001.
-
C. Larman and V. R. Basili, “Iterative and incremental development: A brief history,” Computer, vol. 36, no. 6. pp. 47–56, 2003.
-
C. Larman and B. Vodde, Scaling lean & agile development : thinking and organizational tools for large-scale Scrum. Upper Saddle River, NJ: Addison-Wesley, 2009, pp. xiv, 348 p.
-
G. Lawton, “Forging an IT service catalog management plan to drive business goals.” 2018.
-
D. Leffingwell, A. Yakyma, D. Jemilo, R. Knaster, A. Shalloway, and I. Oren, “Scaled Agile Framework,” no. 10 October 2015. 2014.
-
T. A. Limoncelli, S. R. Chalup, and C. J. Hogan, The Practice of Cloud System Administration: Designing and Operating Large Distributed Systems, Volume 2, vol. 2. Addison-Wesley Professional, 2014.
-
G. Linden, “Early Amazon: Shopping cart recommendations,” Geeking with Greg. 2006.
-
S. Lins, P. Grochol, S. Schneider, and A. Sunyaev, “Dynamic Certification of Cloud Services: Trust, but Verify!,” IEEE Security & Privacy, vol. 14, no. 2, pp. 66–71, Mar. 2016.
-
J. Loeliger, Version control with Git, 1st ed. Beijing ; Sebastopol, CA: O’Reilly, 2009, pp. xv, 310 p.
-
J. Loftus, “Open source IP case puts spotlight on patents,” techtarget.com. 2006.
-
R. J. Madachy, Software process dynamics. Hoboken, Piscataway, NJ: Wiley IEEE Press, 2008, pp. xxiii, 601 p.
-
A. A. Maestro, “Turn IT into a Service Catalog,” DevOps.com blog. 2015.
-
B. Maizlish and R. Handler, IT Portfolio Management Step-By-Step: Unlocking the Business Value of Technology. Hoboken, New Jersey: John Wiley & Sons, 2005.
-
R. Malan and D. Bredemeyer, “The Art of Change: Fractal and Emergent,” Cutter Consortium Enterprise Architecture Advisory Service Executive Report, vol. 13, no. 5, 2010.
-
T. W. Malone and K. Crowston, “The Interdisciplinary Study of Coordination, by Malone, Thomas W and Crowston, Kevin,” ACM Computing Surveys, vol. 26, no. 1, 1994.
-
H. Marks, “Code Spaces: A Lesson In Cloud Backup,” Network Computing. 2014.
-
D. L. Marquet, Turn the Ship Around!: A True Story of Turning Followers into Leaders: L. David Marquet, Stephen R. Covey: 8601411904479: Amazon.com: Books. Portfolio, 2013.
-
C. Matts and O. Maassen, “‘Real Options’ Underlie Agile Practices,” InfoQ. 2007.
-
J. McAdam, “Information Technology Measurements,” in Chargeback and IT Cost Accounting, T. A. Quinlan, Ed. Santa Barbara, CA: IT Financial Management Association, 2003, pp. 90–91.
-
S. McChrystal, T. Collins, D. Silverman, and C. Fussell, Team of Teams: New Rules of Engagement for a Complex World. New York, New York: Portfolio/Penguin (Random House), 2015.
-
D. McCrory, “Data Gravity – in the Clouds,” McCrory’s Blog. 2010.
-
P. Mell and T. Grance, “The NIST Definition of Cloud Computing (Technical report), Special publication 800-145,” National Institute of Standards and Technology: U.S. Department of Commerce., 2011.
-
N. D. Meyer, Internal Market Economics: practical resource-governance processes based on principles we all believe in. Dansbury, CT: NDMA Publishing, 2013.
-
C. Millard, Ed., Cloud Computing Law. Oxford, UK: Oxford University Press, 2013.
-
C. Millotat, “Understanding the Prussian-German General Staff System,” Strategic Studies Institute (US MIlitary), Carlisle Barracks, PA, 1992.
-
R. R. Moeller, Executive’s Guide to IT Governance: Improving Systems Processes with Service Management, COBIT, and ITIL. Hoboken, New Jersey: John Wiley & Sons, Inc., 2013.
-
D. Moody, “The ‘Physics’ of Notations: Towards a Scientific Basis for Constructing Visual Notations in Software Engineering,” IEEE Transactions on Software Engineering, vol. 35, no. 5, pp. 756–778, 2009.
-
J. M. Morgan and J. K. Liker, Designing the future: how Ford, Toyota, and other world-class organizations use lean product development to drive innovation and transform their business. McGraw-Hill Education.
-
J. M. Morgan and J. K. Liker, The Toyota product development system: Integrating People, Process, and Technology. Productivity Press, 2006.
-
J. P. Morgenthal, “A Reality Check on ‘Everyone’s Moving Everything To The Cloud’ | The Tech Evangelist.” 2016.
-
K. Morris, Infrastructure as Code: Managing Servers in the Cloud. Sebastopol, CA: O’Reilly Media, Inc., 2016.
-
C. Moskowitz, “Mind’s Limit Found: 4 Things at Once,” http://www.livescience.com. 2008.
-
S. Narayam, “Scaling Agile: Problems and Solutions | ThoughtWorks,” Thoughtworks Blogs. 2015.
-
S. Narayam, Agile IT organization design: for digital transformation and continuous delivery. Pearson Education Inc. , 2015.
-
S. Newman, Building microservices : designing fine-grained systems. Sebastopol, CA: O’Reilly Media, Inc., 2015.
-
NIST, “NIST SP 800-145, The NIST Definition of Cloud Computing,” 2011.
-
R. L. Nolan, Managing the data resource function, 1St ed. West, 1974, p. 394p.
-
Office of Government Commerce, Service strategy. Norwich: The Stationery Office, 2007, pp. xi, 261 p.
-
T. Ohno, Toyota production system : beyond large-scale production. Cambridge, Mass.: Productivity Press, 1988.
-
E. Olson, “Microsoft, GE, and the futility of ranking employees,” Fortune, no. November 18, 2013, 2013.
-
A. Opelt, B. Gloger, W. Pfarl, and R. Mittermayr, Agile contracts : creating and managing successful projects with Scrum. Hoboken, N.J.: John Wiley & Sons Inc., 2013, pp. xiv, 282 pages.
-
A. Osterwalder and Y. Pigneur, “Business Model Generation,” Wiley, p. 280, 2010.
-
A. Osterwalder, Y. Pigneur, G. Bernarda, and A. Smith, Value Proposition Design. Hoboken, N.J.: John Wiley & Sons, Inc., 2014.
-
J. Patton, User Story Mapping. Discover the Whole Story, Build the Right Product, First edit. 2014, p. 324.
-
R. Pichler, Agile Product Management with Scrum: Creating Products that Customers Love. Boston, MA: Addison-Wesley - Pearson Education, 2010, p. 160.
-
M. Poppendieck and T. D. Poppendieck, Lean Software Development: An Agile Toolkit. Boston: Addison Wesley, 2003.
-
M. Poppendieck and T. D. Poppendieck, Implementing lean software development : from concept to cash. London: Addison-Wesley, 2007, pp. xxv, 276 p.
-
S. Portny, Project Management for Dummies. Hoboken, New Jersey: John Wiley & Sons, 2013.
-
Project Management Institute and Project Management Institute., A guide to the project management body of knowledge (PMBOK guide), 3rd ed. Newtown Square, Pa.: Project Management Institute Inc., 2013, pp. xxi, 589 pages.
-
Puppet Labs, “2015 State of DevOps Report,” Puppet Labs, 2015.
-
T. A. Quinlan, Chargeback and IT Cost Accounting. Santa Barbara, CA: IT Financial Management Association, 2003.
-
B. Raczynski and B. Curtis, “Software Data Violate SPC’s Underlying Assumptions,” IEEE Software, vol. 25, no. 3, pp. 49–51, 2008.
-
Rational Software, Rational Software Corporation, and R. Software, “Rational Unified Process: Best Practices for Software Development Teams,” IBM, 2011.
-
D. J. Reifer, Making the software business case : improvement by the numbers. Boston: Addison Wesley, 2002, pp. xviii, 300.
-
D. G. Reinertsen, Managing the design factory: a product developer’s toolkit. New York ; London: Free Press, 1997, pp. xi,269p.
-
D. G. Reinertsen, The principles of product development flow: second generation lean product development. Redondo Beach, Calif.: Celeritas, 2009, pp. ix, 294 p.
-
G. L. Richardson, Project Management Theory and Practice. Boca Raton: Auerbach Publications, Taylor & Francis Group, 2010.
-
E. Ries, The lean startup : how today’s entrepreneurs use continuous innovation to create radically successful businesses, 1st ed. New York: Crown Business, 2011, pp. 320 p.
-
D. K. Rigby, J. Sutherland, and A. Noble, “Agile At Scale: How To Go From A Few Teams To Hundreds,” Harvard Business Review, 2018.
-
D. K. Rigby, J. Sutherland, and H. Takeuchi, “Embracing Agile,” Harvard Business Review, no. May, 2016.
-
H. Rock, David; Grant, “Why Diverse Teams Are Smarter,” Harvard Business Review. 2016.
-
E. Rogers, Diffusion of Innovations, 5th ed. New York, N.Y.: Free Press - Simon & Schuster, Inc., 2003.
-
J. W. Ross, P. Weill, and D. Robertson, Enterprise architecture as strategy : creating a foundation for business execution. Boston, Mass.: Harvard Business School Press, 2006, pp. xviii, 234 p.
-
M. Rother, Toyota kata : managing people for improvement, adaptiveness, and superior results. New York: McGraw Hill, 2010, pp. xx, 306 p.
-
M. Rother and J. Shook, “Learning to See: Value Stream Mapping to Add Value and Eliminate MUDA [Spiral-bound],” Lean Enterprise Institute. p. 102, 2003.
-
J. Rothman, “Not Ready for Agile? Start Your Journey with Release Trains,” Stickyminds.com. 2011.
-
W. Royce, “Managing the Development of Large Software Systems,” in Proc. IEEE WESCON, Los Angeles, 1970, pp. 1–9.
-
J. Rozovsky, “The five keys to a successful Google team,” re:Work, Mar. 2015.
-
K. S. Rubin, Essential Scrum : a practical guide to the most popular agile process. Upper Saddle River, NJ: Addison-Wesley, 2012, pp. xliii, 452 p.
-
G. A. Rummler and A. P. Brache, Improving performance: how to manage the white space on the organization chart, 2nd ed. San Francisco, CA: Jossey-Bass, 1995, pp. xxv, 226.
-
SAFe, “Agile Release Train – Scaled Agile Framework,” http://www.scaledagileframework.com/. 2016.
-
Scaled Agile Framework, “Guidance – Features and Components – Scaled Agile Framework.” 2016.
-
S. Schlarman, “Developing Effective Policy, Procedure, and Standards,” www.disaster-resource.com. 2008.
-
W. E. Schneider, The reengineering alternative : a plan for making your current culture work. McGraw-Hill, 1999, p. 173.
-
K. Schwaber, The Enterprise and Scrum. Redmond, Wash: Microsoft Press, 2007.
-
K. Schwaber and M. I. Beedle, Agile Software Development with Scrum. Upper Saddle River, N.J.: Prentice Hall, 2002.
-
C. Schwartz and J. Schauer, “The Dojo – Implementing an Immersive Learning Environment for Teams | Agile Alliance,” in Agile 2016, Atlanta, GA, 2016.
-
S. B. ; F. Sells Richard S. and S. B. ; F. Sells, “Evaluation of Research on Effects of Visual Training on Visual Functions,” Am J Ophthal, vol. 44, no. 2, pp. 230–236, Aug. 1957.
-
C. E. Shannon, “A symbolic analysis of relay and switching circuits,” Transactions of the American Institute of Electrical Engineers, vol. 57, no. 12, pp. 713–723, 1938.
-
C. E. Shannon and W. Weaver, The mathematical theory of communication. Urbana,: University of Illinois Press, 1949, pp. v (i.e. vii), 117 p.
-
A. Sharp and P. McDermott, Workflow modeling : tools for process improvement and applications development, 2nd ed. Boston: Artech House, 2009, pp. xx, 449 p.
-
E. Sigler, “So, What is ChatOps? And How do I Get Started?,” Pagerduty.Com. 2014.
-
L. Silverston and John Wiley & Sons., “The data model resource CD-ROM. Volume 1 a library of universal data models for all enterprises.” Wiley, New York, pp. 1 computer optical disc 4 3/4 in., 2001.
-
L. Silverston, The data model resource book Vol 1: A library of universal data models for all enterprises, Rev. ed. New York ; Chichester: Wiley, 2001, pp. 2 v.
-
L. Silverston, The data model resource book Vol 3: Universal patterns for data modeling. Indianapolis, Ind.: Wiley, 2008, pp. xxxii, 606 p.
-
C. J. Sims, Scrum: a Breathtakingly Brief and Agile Introduction. Dymaxicon, 2012.
-
R. Sirkiä and M. Laanti, “Lean and Agile Financial Planning,” via Scaled Agile Framework website, 2013.
-
M. Skelton and M. Pais, Team Topologies: Organizing Business and Technology Teams for Fast Flow. Portland, OR: IT Revolution Press, 2019.
-
P. G. Smith and D. G. Reinertsen, Developing products in half the time. New York, N.Y.: Van Nostrand Reinhold, 1991.
-
P. G. Smith and D. G. Reinertsen, Developing products in half the time : new rules, new tools, [New ed.]. New York ; London: Van Nostrand Reinhold, 1998, pp. xix, 298p.
-
O. Solon, “You are Facebook’s product, not customer,” Wired UK. 2011.
-
I. Sommerville, Software engineering, 6th ed. Harlow, England ; New York: Addison-Wesley, 2001, pp. xx, 693.
-
Stephen Watts, “Enterprise Service Management vs IT Service Management: What’s The Difference? – BMC Blogs,” BMC Blogs. .
-
J. Sterman, Business dynamics : systems thinking and modeling for a complex world. Boston: Irwin/McGraw-Hill, 2000, pp. xxvi, 982 p.
-
D. E. Strode and S. L. Huff, “A Taxonomy of Dependencies in Agile Software Development,” in 23rd Australasian Conference on Information Systems, 2012.
-
D. E. Strode, S. L. Huff, B. Hope, and S. Link, “Coordination in co-located agile software development projects,” The Journal of Systems and Software, vol. 85, pp. 1222–1238, 2012.
-
B. Stroustrup, “Viewpoint: What should we teach new software developers? Why?,” Communications of the ACM, vol. 53, no. 1, p. 40, Jan. 2010.
-
J. Sussna, Designing Delivery: Rethinking IT in the Digital Service Economy. O’Relly Publications, 2015.
-
J. V. Sutherland, Scrum : the art of doing twice the work in half the time, First Edit. Crown Business , 2014, pp. viii, 248 pages.
-
R. I. Sutton and H. Rao, Scaling up excellence : getting to more without settling for less. Crown Business/Random House, 2014.
-
A. Sweetser, “A Comparison of System Dynamics (SD) and Discrete Event Simulation (DES).”
-
The Joint Task Force on Computing Curricula IEEE Computer Society Association for Computing Machinery, “Software Engineering 2014: Curriculum Guidelines for Undergraduate Degree Programs in Software Engineering,” Association for Computing Machinery, February, 2015.
-
The National Court Rules Committee, “Federal Rules of Civil Procedure.” 2016.
-
The Open Group, “The Open Group IT4IT™ Reference Architecture, Version 2.1,” 2017.
-
The Open Group, “Standards Process - Definitions and Glossary.” 2018.
-
The Stationery Office, ITIL Service Design: 2011 Edition. Norwich, U.K.: The Stationery Office, 2011.
-
The Stationery Office, ITIL Service Strategy: 2011 Edition. Norwich, U.K: The Stationery Office, 2011.
-
The Stationery Office, ITIL Continual Service Improvement: 2011 Edition. Norwich, U.K.: The Stationery Office, 2011.
-
J. Tidwell, Designing Interfaces. Sebastopol, CA: O’Reilly Media, Inc., 2006.
-
H. Topi et al., “Revising the MSIS Curriculum: Specifying Graduate Competencies (Second Public Deliverable of the ACM/AIS MSIS 2016 Task Force),” Joint ACM/AIS MSIS 2016 Task Force, 2016.
-
D. Traynor, “Focus on the Job, Not the Customer,” Inside Intercom. 2016.
-
M. Treacy and F. Wiersema, The Discipline of Market Leaders: Choose Your Customers, Narrow Your Focus, Dominate Your Market. New York, N.Y.: Basic Books - Perseus Books Group, 1997.
-
E. R. Tufte, The Visual Display of Quantitative Information, vol. 4. 2001.
-
Uptime Institute, “Explaining the Uptime Institute’s Tier Classification System,” Uptime Institute Journal. 2014.
-
Uptime Institute, “Tier Certification Tiers is the Global Language of Data Center Performance Tier Certification is Worldwide Credibility.” 2016.
-
A. Venkatraman, “2e2 datacentre administrators hold customers’ data to \pounds1m ransom,” ComputerWeekly.com. 2013.
-
D. Vergun, “Toxic leaders decrease Soldiers’ effectiveness, experts say,” www.army.mil. 2015.
-
J. von Neumann and H. H. Goldstine, “Planning and Coding of Problems for an Electronic Computing Instrument,” Institute for Advanced Study, Princeton N.J., 1947.
-
A. Ward and D. K. Sobek, Lean Product and Process Development, 2nd Ed. Lean Enterprise Institute, 2014, p. 349.
-
S. Wardley, “Designing for constant evolution,” Hacker Noon. 2017.
-
G. West, Scale: The Universal Laws of Life and Death in Organisms, Cities, and Companies. London: Weidenfeld & Nicolson: The Orion Publishing Group Ltd, 2017.
-
G. Westerman, D. Bonnet, and A. Mcafee, “The Nine Elements of Digital Transformation,” MIT Sloan Management Review, vol. January, pp. 1–6, 2014.
-
WFMC, “Adaptive Case Management,” Http://Www.Xpdl.Org. pp. 1–23, 2010.
-
J. A. Whittaker, J. Arbon, and J. Carollo, How Google tests software. Upper Saddle River, NJ: Addison-Wesley, 2012, pp. xxvii, 281 p.
-
N. Wiener, “Cybernetics,” Scientific American, vol. 179, pp. 14–18, 1948.
-
Wikipedia Authors, “Multicloud,” Wikipedia, The Free Encyclopedia. 2019.
-
J. P. Womack and D. T. Jones, Lean thinking: banish waste and create wealth in your corporation, 1St Free P. New York: Free Press, 2003, pp. 396 p.
-
J. P. Womack, D. T. Jones, D. Roos, and Massachusetts Institute of Technology., The machine that changed the world : based on the Massachusetts Institute of Technology 5-million dollar 5-year study on the future of the automobile. New York: Rawson Associates, 1990, pp. viii, 323 p.
-
A. Woolley, T. W. Malone, and C. F. Chabris, “Why Some Teams Are Smarter Than Others,” New York Times, no. 12. Jan-2015.
-
S. Yegulalp, “Why GPL still gives enterprises the jitters | InfoWorld,” Infoworld.com. 2014.
-
W. Young and N. G. Leveson, “An integrated approach to safety and security based on systems theory,” Communications of the ACM, vol. 57, no. 2, pp. 31–35, Feb. 2014.
-
E. Yourdon and L. L. Constantine, Structured design : fundamentals of a discipline of computer program and systems design. Englewood Cliffs, N.J.: Prentice Hall, 1979, pp. xix, 473.
-
J. Zachman, “Zachman Framework,” IBM Systems Journal, vol. 26, no. 3, pp. 276–292, 1987.
1. Introduction
1.1. Objective
This document is intended to assist individuals and organizations who wish to create and manage product offerings with an increasing digital component, or lead their organization through Digital Transformation. It is a synthesis of practices and guidance from a wide variety of practitioners and professional communities active in digital technology. It integrates concepts from diverse sources such as business model innovation, product research and monetization, behavioral economics, Agile, DevOps, Enterprise Architecture, organizational development, service management, product management, data management, operations management, and corporate governance. Through providing an integrated and rationalized framework, based on notable and proven practices and perspectives, this document is positioned as leading guidance for digital technology and management professionals worldwide.
1.2. Overview
This document describes the resources, services, and assets that may be involved in creating and delivering such experiences. It provides guidance for the Digital Practitioner, whether based in a traditional "IT" organization, manufacturing unit, sales, customer support, or embedded in a cutting-edge integrated product team.
1.3. Conformance
Readers are advised to check The Open Group website for any conformance and certification requirements referencing this standard.
1.4. Terminology
For the purposes of this document, the following terminology definitions apply:
- Can
-
Describes a possible feature or behavior available to the user or application.
- May
-
Describes a feature or behavior that is optional. To avoid ambiguity, the opposite of “may” is expressed as “need not”, instead of “may not”.
- Shall
-
Describes a feature or behavior that is a requirement. To avoid ambiguity, do not use “must” as an alternative to “shall”.
- Shall not
-
Describes a feature or behavior that is an absolute prohibition.
- Should
-
Describes a feature or behavior that is recommended but not required.
- Will
-
Same meaning as “shall”; “shall” is the preferred term.
1.5. Future Directions
While digital is a fast-evolving field, the intent of this document is to identify the business and technical practices needed for a digital business, and to stay as independent of the implementation technology as possible. However, it is expected that this document will need to be revised from time to time to remain current with both practice and technology. To maintain the coherence of the document in the face of this evolution, a set of Principles of the DPBoK Standard have been established.
2. Definitions
For the purposes of this document, the following terms and definitions apply. Merriam-Webster’s Collegiate Dictionary should be referenced for terms not defined in this section.
- Body of Knowledge
-
A collection of knowledge items or areas generally agreed to be essential to understanding a particular subject. [Source:ISO/IEC 24773-1:2019]
- Digital Enterprise
-
An enterprise characterized by: 1. creation of digitalized products or services that are either delivered fully digitally (e.g., digital media or online banking), or 2. where physical products and services are obtained by the customer by digital means (e.g., online car-sharing services).
- Digital Technology
-
IT in the form of a product or service that is digitally consumable to create or enable business value.
- Digital Transformation
-
The radical, fundamental change towards becoming a digital enterprise.
- Digitalization
-
The application of digital technology to create additional business value within the primary value chain of enterprises.
- Digitization
-
The conversion of analog information into digital form.
- Process
-
An ordered, countable set of activities; an event-driven, value-adding sequence that can be measured and improved.
3. Digital Transformation
This chapter describes Digital Transformation.
3.1. Example Scenario
Consider a scenario wherein an individual is looking to buy a prosthetic limb for her brother. Today and in the near future she is likely to perform the following activities:
-
Send a picture of her brother to a limb designer
-
Use an electronic device to measure the limb
-
Visualize the design options of the limb with her brother and designer
-
Get the limb design and connections validated by a specialist several thousand miles from her home
-
Select a facility closer to her home for final fitting and delivery
-
Share the design electronically with the local facility
-
Complete necessary arrangements with the local facility and the insurance company
-
Transfer money to the designer and the print facility
-
Make a reservation and have it honored at the print facility
-
Use a wayfinding application on a smart device
-
Watch the limb 3D printed, quality-tested, assembled, and fitted
-
Make sure the insurance company has paid all parties
-
And, most importantly, watch her brother light up in delight
Each of these experiences is co-created by her desire for value, and the responses of a set of digital resources. It also reflects how distance, time, and costs have shrunk while the consumer’s experience is increasingly customized and personal.
The resources and capabilities required to deliver such experiences are vast and complex, spanning mainframe and distributed computers housed in data centers and managed in various ways, including advanced cloud services. Every individual involved in the design and delivery of these contemporary, evolving digital technologies is a Digital Practitioner.
3.2. Digital Transformation as Strategy
Jim Fowler, CIO of GE, stated in 2016: "When I am in business meetings, I hear people talk about digital as a function or a role. It is not. Digital is a capability that needs to exist in every job. Twenty years ago, we broke e-commerce out into its own organization, and today e-commerce is just a part of the way we work. That’s where digital and IT are headed; IT will be no longer be a distinct function, it will just be the way we work. … we have moved to a flatter organizational model with “teams of teams” who are focused on outcomes. These are co-located groups of people who own a small, minimal viable product deliverable that they can produce in 90 days. The team focuses on one piece of work that they will own through its complete lifecycle … in [the “back-office”] model, the CIO controls infrastructure, the network, storage, and makes the PCs run. The CIOs who choose to play that role will not be relevant for long.” [128]
Digital Transformation is fundamentally a strategy and an operating model change, in which technological advancements are leveraged to improve human experiences and operating efficiencies, and to evolve the products and services to which customers will remain loyal. It is the consequence of:
-
The ability to handle information in the digital form
-
Using digital technologies to manage the process of creating, capturing, and analyzing information to deliver perceptive human-machine interaction experience
The modern digital enterprise faces multiple challenges in its transformation to the digital economy. New technologies (cloud, IoT, machine learning) and new techniques (DPM, reliability engineering, continuous delivery) both demand attention. This family of guidance will address both aspects. However, technologies are faster moving, while techniques and practices evolve at a slower pace.
For organizations to cope with this fast technology evolution pace and succeed in this Digital Transformation, changes should be pervasive through the whole organization. Digital Transformation as strategy should be aligned with the overall organization context and environment, and should be derived and sometimes even replace the existing organization strategy.
This strategy shift should encompass the new business and IT disruptive trends, using an outside-in perspective, and lead the development of new business and operational models connected with digital technologies and platforms and with the digital economy as a whole.
3.3. What is Digital?
Being "digital", in the sense of digitizing information, is not new. It has existed, arguably, since Shannon mapped Boolean logic onto electronic circuits [253]. This document uses the definitions defined in Chapter 2, Definitions.
A "digital-first" culture is where the business models, plans, architectures, and implementation strategies are based on a digital organization architecture that inspires and rewards a number of desired behaviors, such as servant leadership, strategic value chain thinking, consumer focus, fault tolerance, agility, and more. It requires a workforce with a sense of psychological safety, digitally savvy enough to execute a “digital-first approach".
As part of this paradigm shift, it is important to have a clear understanding of the existing capabilities, which can be retired, and the new ones that will be needed. In some cases, organizations may need to deal with all these changes while keeping their current legacy platform and supporting applications.
3.4. Seven Levers of Change
To succeed in today’s digital era, organizations will need to consider the following seven levers of change, as discussed in the White Paper: "The Seven Levers of Digital Transformation" [81]:
-
Business process transformation
-
Customer engagement and experience
-
Product or service digitization
-
IT and delivery transformation
-
Organizational culture
-
Strategy
-
Business ecosystem
These levers require a fundamental understanding of value creation for both the organization and the customer. They equip businesses with a structure to reduce the number of failed projects, guide investment decisions, and create a set of products and services designed to seal customer loyalty. For digital success you will need to assess readiness, actively include your people, measure and govern for value - not activities performed, develop your roadmap top-down, and pivot often with bottom-up learnings.
The example given at the start of this section is an illustration of the impact of seven levers to the primary value chain. In the example, some organizations that enabled the experience may be startups, but others may be more established firms now changing the way they have been operating. The printing facility, the orthopedic and prosthetic specialist, and even the customer changed their expectations and ways they used to function. The change has been made possible with the innovations in digital technologies.
Technology is the glue that connects all players in the ecosystem – suppliers, distributors, service providers, employees, and the customers - and it is a powerful means to building a future-ready organization. However, it is worth bearing in mind that it is not an end in itself. The seven levers are symbiotic pillars that amplify the effects of one another.
For an organization to become Agile, change should start with organizational structure and cultural change – the whole organization should be aligned with the Agile view. The new paradigm for an Agile enterprise should focus on becoming flexible by design: the ability to modify tactics and operations to respond to changing conditions.
4. Principles of the DPBoK Standard
4.1. Guiding Concepts
The content of this document will change over time, but shall remain consistent with these core guiding concepts:
-
Comprehensiveness
-
Currency
-
Capability-based
-
Verifiability
-
Fine-grained and Clinical Terminology
-
Compatibility with Other Frameworks
-
Compatibility with Agile Principles
-
Compatibility with Enterprise Architecture
-
A Learning Artifact
-
Developed as a Digital Product
-
Competency-based Content
-
Scaling Model as Learning Progression
4.2. Comprehensiveness
This document shall provide comprehensive guidance for the digital and IT professional in his or her professional contexts, whether market-facing or supporting. It shall address the complete spectrum of concerns encountered by the Digital Practitioner, from the initial decision for digital investment through value discovery, design, construction, delivery, operation, and ongoing evolution. It shall cover management and organizational development topics of collaboration, coordination, structure, and culture, in the context of Digital Product Management (DPM). It shall cover sourcing and human resource management in the digital context. It shall cover Governance, Risk Management, and Compliance (GRC), data and information management, and architecture. It shall strive to be the “go-to” guidance for orienting Digital Practitioners worldwide to their chosen career.
This document shall demonstrate thorough and current consistency with the principles and practices of Agile development and related trends, such as continuous delivery, DevOps, Lean Product Development, Kanban and Lean IT, design thinking in the digital context, SRE, and web-scale computing. It shall curate notable current guidance while maintaining a neutral and clinical overall position on controversial topics. It shall serve the Digital Practitioner by identifying relationships and overarching themes across this curated Body of Knowledge.
The focus of this document, however, is on longer-lived professional and management practices, not the ephemeral aspects of technology. The following should be, in general, discussed primarily by reference at a level suitable for non-technical audiences:
-
Technical standards (platforms, protocols, formats, interoperability, etc.)
-
Specific programming languages and frameworks
The following in general should be avoided, even by reference:
-
Particular vendors and commercial products (this does not include notable open source products with demonstrated longevity); if commercial products are mentioned as examples, at least two examples should be supplied
-
Specific commercial methodologies (some exceptions to this may exist, such as ITIL and SAFe, subject to evidence of substantial notability and demonstrated longevity)
Specific technical practices, such as Infrastructure as Code (IaC), virtualization, cloud, and SRE, may be in scope, to be determined on a case-by-case basis. Broader technical trends such as Internet of Things (IoT) and cognitive technologies may be discussed, primarily in terms of their impact on technical practices. (There are many other bodies of work for the practitioner to refer to on such topics.) In general, this document should not be so technically-neutral and abstract as to appear academic and irrelevant to the modern Digital Practitioner.
4.3. Currency
This document shall remain current with industry practices and trends, subject to evidence of notability and reasonable longevity.
4.4. Capability-Based
Much current computing and IT guidance uses the concept of “process” as a fundamental building block, with various issues:
-
Inconsistency with the definition of “process” favored by the Business Process Management (BPM) community [32]
-
Promotion of formalized “process” as a primary, preferred coordination and delivery model and basis for improvement, rather than one mechanism among several
This document should prefer the concept of “capability” as its fundamental structure, in a definition consistent with other work of The Open Group. The concept of “practice” may also be used. The highest-order DPBoK capabilities shall be cross-cutting, large-grained concepts, not to be confused with organizational functions or processes. They shall be derived and ordered based on a scaling model. Establishment or alteration of DPBoK capabilities and practices must be evidence-based. This document shall align with emerging Business Architecture standards in this regard.
4.5. Verifiability
In the computing and digital professions, there is currently a significant and destructive gap between academic theory and research and industrial practice. This can be corrected. For example, medicine has a much more productive feedback loop between researchers and practicing clinicians.
In the interest of narrowing this gap, this document shall be verifiable. Its concepts must be well-grounded, with clear evidence as to their notability. It must not propose concepts or terminology that have little or no evidence of practical adoption in industry. Its structure, principles, practices, and concepts must be falsifiable. It shall be open to rational skepticism and criticism and adaptive in the face of evidence such as surveys, market assessments, analysis of industry narratives and cases, and simulations of socio-technical systems. It should also demonstrate an awareness of useful academic research and problem framing.
The principle of verifiability does permit for analysis, synthesis, and interpretation. This document should seek to "add value" to industry understanding wherever possible, but must also remain well-grounded while doing so.
Finally, this document must not fall into the trap of excessive semantic debate and the fruitless search for universally applicable abstract ontologies. A framework with recognized inconsistencies but well grounded in industry domain language is preferable to a perfectly consistent framework based on conjectural concepts.
4.6. Fine-Grained and Clinical Terminology
Within its capability progression, this document shall strive to employ terminology and concepts that are fine-grained, precise, objective, well-supported, and clinical. For example, it is helpful to break a management concern such as “process management” down into lower-level concepts of task ordering and dependencies, cadence, and synchronization. See, for example, Reinertsen’s work on “Managing Flow under Variability” ([230], Chapter 7).
4.7. Compatibility with Other Frameworks
This document should be to the greatest extent possible compatible with other bodies of knowledge and frameworks, while still adhering to the previously articulated principles. It should be positioned as a “standard of standards”, with the objective of aligning and bringing a coherent approach to navigating the currently fragmented information base in the digital industry.
Because other frameworks are large-grained combinations of many concerns, it may not be possible to be compatible in all regards. This document should seek to interoperate with other frameworks using fine-grained terminology. For example, rather than asserting consistency with the Project Management Body of Knowledge® (PMBOK®) as a whole, it is preferable that this document frames its relationship in terms of components such as investment management, planning, resource allocation, risk management, and execution. Similarly, rather than characterizing its relationship to ITIL as a whole, this document should frame its relationship more specifically in terms of the ITIL approaches to product management, process management, and continuous improvement.
Where other frameworks cover a topic sufficiently, this document shall not repeat that coverage. The role of this document is to integrate and synthesize. However, this document shall not overlook or fail to identify points where its point of view varies from the recommendations of other guidance. In such cases, it shall do so in a principled fashion based on clear evidence and with specificity as to the nature of the differences.
Not all sound practice has been formalized through standards. This document may, subject to evidence of notability, reference the contributions of individuals.
4.8. Compatibility with Agile Principles
Agile software development has emerged as a dominant approach in software-intensive systems creation, and is expanding its reach and insights into non-software, non-computing fields as well [234, 233]. There are a variety of principles and perspectives on Agile, starting with the well-known Agile Manifesto [8], furthered by the work of the Agile Alliance. Commercial Agile frameworks are increasing in number and scope; for example, [177, 18].
Agile principles can be described in specific and precise ways; Agile’s history and influence in the computing profession are broad and notable [174], and the underlying intellectual foundations of Agile are robust [250, 230]. Agile describes sound approaches and practices for product management with a high Research and Development (R&D) component. Using collaborative, focused, cross-functional teams with iterative, feedback-enhanced methods is the most effective approach for solving complex problems (as compared to routing problem-solving work across functional team boundaries with sequential “phase gates”). Where digital systems management involves the discovery of information and coping with “unknown unknowns”, this document shall favor Agile principles.
However, Agile (as a specific set of documented, curated practices) is at its strongest in the cohesive team context. It does not have the same level of consensus or clarity in larger contexts, and the topic of “scaling Agile” is controversial in the industry. This document should approach the scaling problem in part as a problem of coordination, which is a topic of research attention in academia. Scaling issues are also driven by the organization’s approach to internal investment and organizational development, up to and including culture. Corporate governance must be addressed as well. These are broad topics in management, with many notable and qualified influences for this document to curate into the digital context.
4.9. Compatibility with Enterprise Architecture
As part of the paradigm shift to digital, it is important to have a clear understanding of which existing capabilities can be retired, and which new ones will be needed. In some cases, organizations may need to deal with all these changes while keeping their current legacy platform and supporting applications. Integrating new capabilities with existing ones in an effective and efficient way requires a clear landscape and overall view of the organization context. This is provided by Enterprise Architecture. While architecture as a competency area is covered in Competency Area 12, this document should implicitly reflect its principles throughout:
-
A systemic view of organizational reality, capabilities, and dependencies
-
Recognizing and communicating internal and external context, integrating the "outside in" and "inside out" views
-
Driving strategic alignment and synergy among organizational components
-
Enabling innovation while also managing technical debt
This systemic and holistic view can be provided by an Enterprise Architecture capability. Due to the continuous and rapid evolution of these disruptive trends, however, a shift to a more Agile style in the Enterprise Architecture capability is also needed. Evolvability should become an Enterprise Architecture concern that facilitates the modification of the enterprise’s products and supporting operating model while preserving non-functional requirements. An example can be seen in The Open Group White Paper "Agile Architecture in the Digital Age".
Enterprise Architecture standards such as the TOGAF Standard, Version 9.2 and the ArchiMate Specification can be used to achieve this, and should be used along with other practices like Agile, Lean, and DevOps methodologies mentioned later.
4.10. A Learning Artifact
Participants in developing this document shall recognize their responsibility in developing a learning artifact. This document may be used in both commercial and academic settings for educating the next generation of Digital Practitioners, and assisting Digital Practitioners and leaders in understanding their challenges and options. This document may in part be expressed as competencies and learning objectives compatible with Bloom’s taxonomy.
4.11. Developed as a Digital Product
This document itself must exemplify the new practices it describes. It is itself a product entering a market. It must have:
-
Clear and broad feedback channels
-
Clear audience targeting
-
A defined release cadence
-
As frictionless and collaborative a development process as possible
-
A production pipeline automated to the highest degree possible
Its audiences also need to be clearly stated; for example:
-
Executive
-
Management
-
Technologist
-
New to workforce
-
Domain audiences
-
Service management
-
Architecture
-
Information management
-
4.12. Competency-Based Content
This document shall contain competency-based content, and shall be organized based on the structure of the 2016 rewrite of the Masters' level Information Systems guidance (MSIS2016) [285]. It shall contain:
-
Contexts (four, ordered by scale; this layer is additional to MSIS2016)
-
Competency Areas (Chapters)
-
Competency Categories
-
Example Competencies
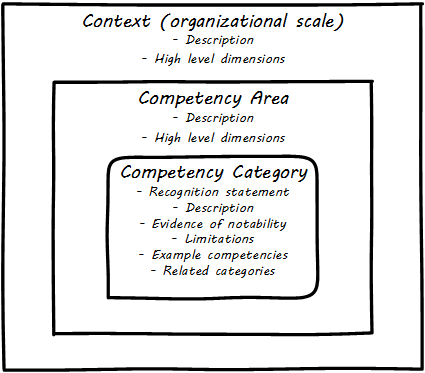
Contexts and Competency Areas contain descriptions and high-level "dimensions" that will list the expected competency outcomes for the area as a whole.
Formalized Competency Categories shall be the majority of the standard and shall follow this structure:
-
Description statement(s): the Competency Category consists of …
-
Evidence of Notability statement: the evidence for this competency’s importance is … (sources must be cited)
-
Limitations: known ways in which the Competency Category can fail, be mis-applied, or lead to undesired results
-
Example Competencies: competencies are granular and more transient; a decision will need to be made as to how "normative" they are. Note that Example Competencies are not the same as Learning Objectives, especially Learning Objectives that are "Lower Order" Dimensions in Bloom’s Taxonomy (Remembering, Understanding). They may be based on, or reflect, "Higher Order" Dimensions in Bloom’s Taxonomy (Applying, Evaluating, Creating). This document follows the MSIS2016 lead in describing competency as "an integrative concept that brings together [the learner’s] knowledge, skills, and attitudes" [285 p. 8].
|
Note
|
As of the DPBoK Standard, Version 1, competencies are mostly undefined and some stated dimensions may need further evolution from a learning outcome bias to a true competency orientation. |
-
Related Competency Categories: the following topic(s) underpin/relate to/depend on this topic
Example
This is an example only and the actual Competency Category for this topic may differ from this.
Context: Individual
Competency Area: Infrastructure
Competency Category: Infrastructure as Code
Description. Per Kief Morris, "Infrastructure as Code (IaC) is an approach to infrastructure automation based on practices from software development" [203]. For example, instead of using an interactive console to create and configure virtual servers on a one-time basis, an IaC approach would define the parameters of the desired resources (OS, capacity, software installed) as a text artifact. This text artifact can then be employed by configuration management tooling to create the infrastructure consistently.
Evidence. Evidence for this topic’s importance is pervasive throughout the modern cloud, DevOps, Agile, and SRE communities. Current examples include the Phoenix Project [165], Infrastructure as Code by Kief Morris [203], and …
Limitations. Infrastructure as Code may not be possible in certain environments where infrastructure management platforms are not driven by text artifacts.
Competency examples. Suggested competencies with reference to current sources are as follows:
-
Compare and contrast various current approaches for infrastructure as code, such as shell scripts, declarative configuration management, and open source Cloud-native technologies (e.g., Helm, CNAB) and define an appropriate approach for a given organization.
-
Define, deploy, and manage an application as a distributed system across several nodes using infrastructure as code techniques
Related Topics:
End of Example
|
Note
|
It is expected that the material will have extensive internal cross-referencing. The above example depends on other Competency Areas, such as source control and configuration management. Use of pervasive cross-referencing will help with the inevitable taxonomy debates over "does X belong under Y?". |
4.13. Scaling Model as Learning Progression
The sequence or learning progression of any body of knowledge is critical for its transmission and adoption [15]. Bodies of knowledge are used in part to educate newcomers to a field, and should reflect an ordering suitable for this purpose. For maximum accessibility, the structure of this document shall be based on a scaling model, that can be summarized as "from startup to enterprise".
See Models for Learning Progression in the next chapter.
5. Structure of the Body of Knowledge
This chapter describes how the Body of Knowledge is structured.
5.1. Models for Learning Progression
The term learning progression refers to the purposeful sequencing of teaching and learning expectations across multiple developmental stages, ages, or grade levels. The term is most commonly used in reference to learning standards - concise, clearly articulated descriptions of what students should know and be able to do at a specific stage of their education. [115]
If a learning progression starts with overly abstract or remote concerns, it may be less accessible to the student. Some may dismiss the course of learning as irrelevant, despite the presence of valuable material further in. In this section we consider a number of models.
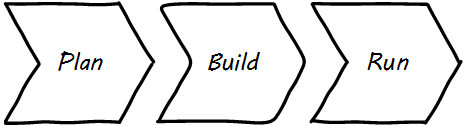
Lifecycle Approach
Many bodies of knowledge in the digital profession are ordered using a "lifecycle" (planning, designing, building, running). See Figure 2, “Lifecycle Dimension”. The biggest challenge with the "lifecycle" concept is that it is easily mistaken for advocacy of sequential, stage-gated, open-loop "waterfall" development methods. Ordering a standard with "requirements" or "analysis" as an initial section also raises concerns from an Agile perspective. Professionals oriented to Agile methods deprecate excessive focus on requirements prior to actual system delivery, preferring instead to deliver "walking skeletons" or "Minimum Viable Products (MVPs)" in an overall strategy of iterative learning.
Starting with planning is also challenging because planning is an abstract activity and difficult to formalize. It is an activity that is deeply controversial and scale and organization-dependent, with few "best practices" and many contrary points of view. When guidance begins with an in-depth discussion of planning (because that is "where the lifecycle starts"), it risks plunging the student or trainee immediately into remote concerns that are experienced primarily by senior personnel in larger-scale organizations.
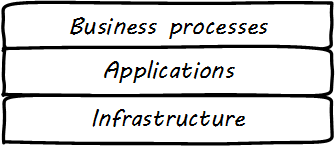
Stack Approach
Other guidance (e.g., the Zachman® Framework for Enterprise Architecture) is based on a "stack" of abstractions. See Figure 3, “Stack Dimension”. Computer engineers and scientists start "at the bottom" of the stack, with electrical and electronic engineering, Boolean logic, automata theory, and so forth. This foundational material is difficult and abstract; not all practitioners need to follow such a learning progression (although certain fundamentals such as the concept of computability should be understood at least at a high level by all Digital Practitioners). Conversely, Enterprise Architects are taught decomposition from business objectives, to data, to applications, to technologies.
Whether bottom-up or top-down, layered approaches to technology have utility, but are also prone to reductionism; i.e., that a complex system can be understood as "merely an application" of an underlying layer, or that once a business intent is defined, automating it with a computer is "merely a matter of execution" in decomposition, design, and implementation.
Scaling Model
For maximum accessibility, a different "on-ramp" is needed to best serve the modern Digital Practitioner. The DPBoK structure is based on a scaling model, that can be summarized as "from startup to enterprise".
Verne Harnish, in the book Scaling Up [122 pp. 25-26], describes how companies tend to cluster at certain levels of scale. (See Figure 4, “Organizations Cluster at Certain Sizes”, similar to [122 p. 25].) Of 28 million US firms, the majority of firms (96%) never grow beyond a founder; a small percentage emerge as a viable team of 8-12, and even smaller numbers make it to the stable plateaus of 40-70 and 350-500. The “scaling crisis” is the challenge of moving from one major level to the next. (Harnish uses the more poetic term “Valley of Death".) This scaling model, and the needs that emerge as companies grow through these different stages, is the basis for this document’s learning progression.
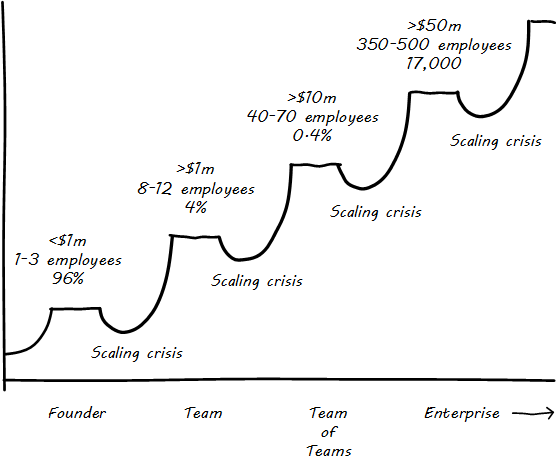
It draws from the concepts and research of Robin Dunbar [91] and Verne Harnish [122], Barry Boehm’s Spiral Model [38], Eric Ries' Lean Startup [232], Alistair Cockburn’s Walking Skeleton design pattern [64], John Gall’s heuristic that complex systems always evolve from simpler, functional systems [107], Scott Ambler’s work on Agility@Scale [17], and the early Ward Cunningham recommendation: "Do the simplest thing that could possibly work … if you’re not sure what to do yet" [79]. A related approach can be seen in Simon Wardley’s concepts of "pioneer/settler/town planner" [296]. The book Scale by physicist Geoffrey West [297] provides a useful foundation, based on fundamental physical principles.
The scaling progression can be seen as a third dimension to the previously discussed Stack and Lifecycle (see Figure 5, “Scale as Third Dimension”).
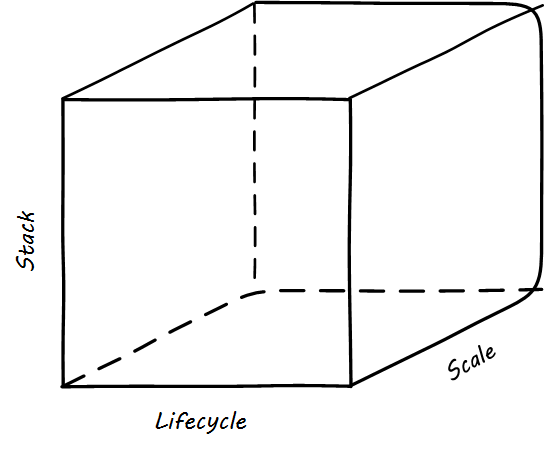
A scaling digital startup exposes with great clarity the linkage between IT and “the business". The success or failure of the company itself depends on the adept and responsive creation and deployment of the software-based systems. The lessons that digital entrepreneurs have learned through this trial by fire shed great light on IT’s value to the business. Thinking about a startup allows us to consider the most fundamental principles as a sort of microcosm, a small laboratory model of the same problems that the largest enterprises face.
The thought experiment does not limit the DPBoK Standard to entrepreneurial startups. It also may represent the individual’s journey through their career in the organization, from individual developer or engineer, to team lead, to group manager, to senior executive. Or, the journey of an experimental product within an enterprise portfolio.
The Scaling Model and Enterprise Digital Transformation
Large enterprises may find the scaling model useful in their Digital Transformation execution. By reviewing each layer of the model, they can identify whether they are sufficiently supporting critical delivery capabilities. One common problem in the enterprise is the proliferation of processes and controls at the upper levels (Contexts III and IV), to the point where team collaboration and cohesiveness (Context II) is degraded.
5.2. Four Contexts
The DPBoK structure represents four contexts of organizational evolution:
-
Individual/Founder
-
Team
-
Team of Teams
-
Enduring Enterprise
The thought experiment is as follows:
Take a startup, one or two people in the proverbial garage, or an autonomous "skunkworks" team in a large enterprise, with a powerful idea for a new product with a large digital component. Assume they intend to remain self-funding and grow organically (no venture capital acceleration, or large corporate budget until they have proven their viability). What capabilities do these people need to attract enough revenue to hire others and form a team?
Suppose they succeed in building a viable concept, and hire a team. What new capabilities does this organization need? (And, by omission, which can be deferred until further growth?)
Suppose the team grows to the point that it must be divided into multiple teams, or the internal product is at a point where it must be re-integrated into the enterprise. Again, what new capabilities are needed? And why?
Suppose that, finally, the organization (or product value stream) grows large enough to have formal corporate governance, regulation, external audits, and/or relatively long time spans to manage in terms of its core operating concepts, product portfolio, technology base, and commitments to both suppliers and customers? What new capabilities are needed?
Criteria of Likely Formalization
Topics shall be selected to each context based on the criteria of likely formalization. For example, it would be unusual for a two-person startup to establish a formal portfolio management process for structuring investments; the startup is almost always one unitary investment (perhaps, itself, part of a larger venture portfolio). It would also be unusual for a small startup to have a formalized risk management process. Conversely, it would be unusual for an established large organization to not have a formal portfolio or risk management.
The DPBoK hypothesis is that the conflict between Agile methods and traditional approaches revolves around the transition from a single, collaborative team to a "team of teams" requiring coordination, and the eventual institution of architecture and governance practices. The DPBoK shall curate the most current and relevant industry guidance and academic research on these matters. Providing a rich set of resources and approaches for solving this problem will be valuable for DPBoK consumers struggling to integrate collaborative Agile approaches with service management, process management, project management, architecture, and governance.
The progression shall be held to the above principle of verifiability. It is expected and hoped that the concept of likely formalization will be supported by empirical evidence of organizational development research. Such research might inform further evolution or re-ordering of the proposed capabilities.
Any DPBoK capability may be a concern at any time in an organization’s evolution. Security and architectural thinking are of course required from Day 1. Formalization, however, implies one or more of the following:
-
The concern is explicit rather than tacit
-
Dedicated staff or organization
-
Defined processes or practices
As with Boehm’s spiral model, the same concern may be addressed from different perspectives or contexts in the framework. Attempting to cover all nuances of a given practice area such as requirements, or release management when it is first encountered in the team context, results in coverage that is too detailed, bringing in the enterprise context too soon. Advanced discussions or representations of the framework may include foreshadowing of higher-context concerns (e.g., discussion of security or architecture concerns in the Individual/Founder context, pre-formalization).
5.3. Context Summaries
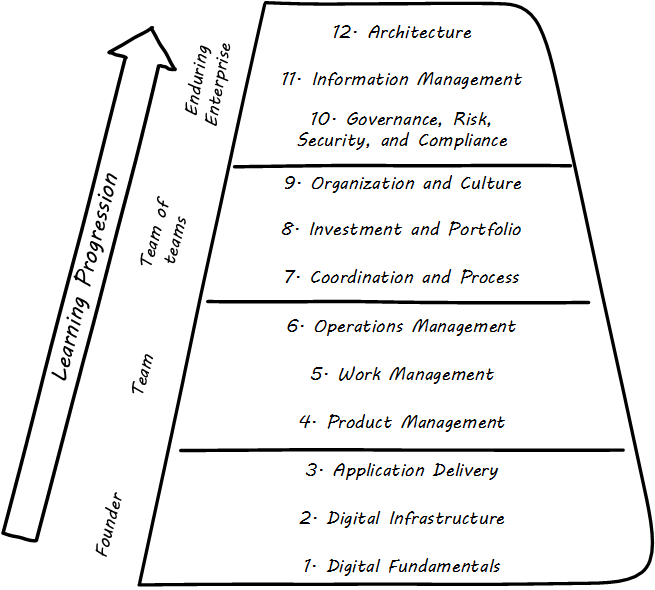
Brief summaries of the four levels follow.
Context I: Individual/Founder
The Individual/Founder context represents the bare minimum requirements of delivering digital value. The governing thought experiment is that of one or two founders of a startup, or an R&D team with high autonomy (e.g.,"skunkworks") in a larger organization. What are the minimum essential concerns they must address to develop and sustain a basic digital product?
Proposed capabilities include:
-
Conception of digital value
-
Digital infrastructure and related practices; this topic will likely be the most susceptible to the problem of keeping up with the fast pace of technology evolution
-
Agile development and continuous delivery practices
The startup thought experiment should be relevant for individuals in organizations of all sizes. The guidance is not intended for entrepreneurs specifically. Rather, the startup is a powerful frame for all Digital Practitioners, as it represents an environment where there can be no distinctions between "business" and "IT" concerns.
Context II: Team
The collaboration level represents the critical team-level experience. Establishing team collaboration as a fundamental guiding value is essential to successful digital product development. The insights of the Agile movement and related themes such as Lean are primary in this context. Competency Areas include:
-
Product management
-
Work execution
-
Operations
Context III: Team of Teams
The thought experiment here is the "team of teams" (a term borrowed from the title of a well-known book by General Stanley S. McChrystal [192]). Coordinating across the "team of teams" is a hard problem. Too often, coordination mechanisms (such as overly process-centric operating models) degrade team cohesion and performance. The Agile movement can be seen in part as a reaction to this problem. There is a significant opportunity to compile industry guidance on this topic. Competency Areas are focused on the required capabilities to ensure alignment and joint execution:
-
Coordination mechanisms (including process management and ITSM)
-
Investment and sourcing (including project management)
-
Organization and cultural factors
Context IV: Enduring Enterprise
The thought experiment here is "the growing enterprise" and the establishment of additional feedback mechanisms for steering, managing risk, and assuring performance at scale and over increasing time horizons and increasingly complex ecosystems:
-
Governance, risk, security, and compliance
-
Information management
-
Architecture and portfolio management
6. The Body of Knowledge
6.1. Context I: Individual/Founder
This is the introduction to Context I.
Context Description
The founder or individual context represents the bare minimum requirements of delivering digital value. The governing thought experiment is that of one or two founders of a startup, or an R&D team with high autonomy. What are the minimum essential concerns they must address to develop and sustain a product in a digital environment? There is little or no concern for process or method. Approaches and practices are opportunistic and tactical, driven by technical choices such as programming language, delivery pipeline, and target execution platform.
In this context, the guidance must strike a fine balance between being too applied and technical, versus being too abstract and theoretical. In the interest of not becoming outdated, much existing guidance opts for the latter, seeking to provide generic guidance applicable to all forms of technology. However, this approach encounters issues in topics such as Configuration Management, which is challenging to abstract from platform and technology particulars. There is no definitive solution to this problem, but the DPBoK Standard in general should be somewhat more tolerant of real-world examples reflecting actual digital systems practices, while not becoming overly coupled to particular languages, tools, or frameworks. Being technology-agnostic ultimately may not be possible.
6.1.1. Digital Fundamentals
There are many ways in which digital systems deliver value. Some systems serve as the modern equivalent of file cabinets: massive and secure storage for financial transactions, insurance records, medical records, and the like. Other systems enable the transmission of information around the globe, whether as emails, web pages, voice calls, video on-demand, or data to be displayed in a smartphone application (app). Some of these systems support engaged online communities and social interactions with conversations, media sharing, and even massive online gaming ecosystems. Yet other systems enable penetrating analysis and insight by examining the volumes of data contained in the first two kinds of systems for patterns and trends. Sophisticated statistical techniques and cutting-edge approaches like neural network-based machine learning increase the insights of which our digital systems are capable, at a seemingly exponential rate.
Digital technology generates value in both direct and indirect ways. Some of the best known uses of digital technology were and are very indirect — for example, banks and insurance agencies using the earliest computers to automate the work of thousands of typists and file clerks. More directly, people have long consumed (and paid for) communication services, such as telephone services. Broadcast entertainment was a different proposition, however. The consumer (the person with the radio or television) was not the customer (the person paying for the programming to go out over the airwaves). New business models sprung up to support the new media through the sale of advertising air time. In other words, the value proposition was indirect, or at least took multiple parties to achieve: the listener, the broadcaster, and the advertiser. This model, originating in the analog era, has carried through into the digital economy.
From these early business models have evolved and blossomed myriads of creative applications of digital technology for the benefit of human beings in their ongoing pursuit of happiness and security. Digital and IT pervades all of the major industry verticals (e.g., manufacturing, agriculture, finance, retail, healthcare, transportation, services) and common industry functions (e.g., supply chain, human resources, corporate finance, and even IT itself). Digital systems and technologies also are critical components of larger-scale industrial, military, and aerospace systems. For better or worse, general-purpose computers are increasingly found controlling safety-critical infrastructure and serving as an intermediating layer between human actions and machine response. Robotic systems are based on software, and the IoT ultimately will span billions of sensors and controllers in interconnected webs monitoring and adjusting all forms of complex operations across the planet.
6.1.1.1. Digital Context
Description
6.1.1.1.1. Positioning Digital Products
Digital services can be:
-
Directly market and consumer-facing (e.g., Facebook®, LinkedIn®), to be used by external consumers and paid for by either them or closely associated customers (e.g., Netflix®, or an online banking system)
-
Customer “supporting” systems, such as the online system that a bank teller uses when interacting with a customer; customers do not interact directly with such systems, but customer-facing representatives do, and problems with such systems may be readily apparent to the end customer
-
Completely “back-office” systems (human resources, payroll, marketing, etc.)
Note, however, that (especially in the current digitally transforming market) a service previously thought of as “back office” (when run internally) becomes “market-facing” when developed as a profit-seeking offering. For example, a human resources system built internally is “back office”, but Workday is a directly market-facing product, even though the two services may be similar in functionality.
In positioning a digital offering, one must consider the likelihood of its being adopted. Is it part of a broader “movement” of technological innovation? Where is the customer base in terms of its willingness to adopt the innovation? A well-known approach is the idea of "diffusion theory”, first researched by Everett Rogers and proposed in his Diffusion of Innovations, [236].
Rogers' research proposed the idea of “Adopter Categorization on the Basis of Innovativeness”, with a well-known graphic (see Figure 7, “Technology Adoption Categories (Rogers)”, similar to [236] Figure 7-3, p.281).
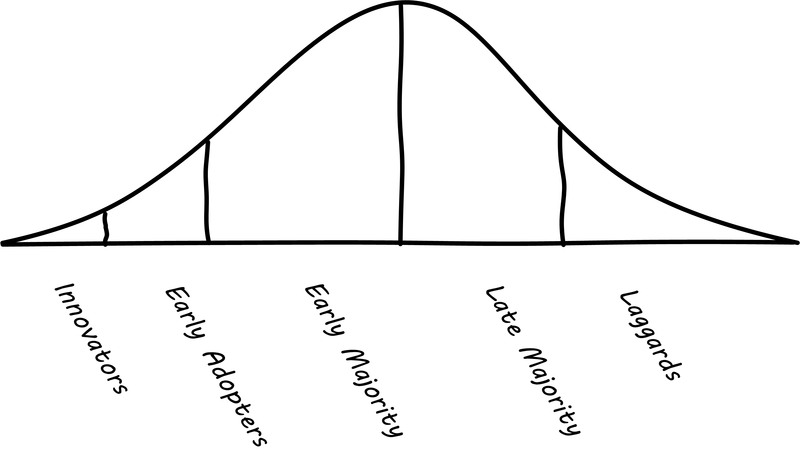
Rogers went on to characterize the various stages:
-
Innovators: venturesome risk-takers
-
Early adopters: opinion leaders
-
Early majority: deliberative, numerous
-
Late majority: skeptical, also numerous
-
Laggards: traditional, isolated, conservative
Steve Blank, in The Four Steps to Epiphany [36], argues there are four categories for startups (p.31):
-
Startups that are entering an existing market
-
Startups that are creating an entirely new market
-
Startups that want to re-segment an existing market as a low-cost entrant
-
Startups that want to re-segment an existing market as a niche player
Understanding which category you are attempting is critical, because “the four types of startups have very different rates of customer adoption and acceptance”.
Another related and well-known categorization of competitive strategies comes from Michael Treacy and Fred Wiersma [287]:
-
Customer intimacy
-
Product leadership
-
Operational excellence
It is not difficult to categorize well-known brands in this way:
| Customer Intimacy | Product Leadership | Operational Excellence |
|---|---|---|
Nordstrom |
Apple |
Dell Technologies |
Home Depot |
Nike |
Wal-Mart |
However, deciding which strategy to pursue as a startup may require some experimentation.
6.1.1.1.2. Defining Consumer, Customer, and Sponsor
In understanding IT value, it is essential to clarify the definitions of user, customer, and sponsor, and understand their perspectives and motivations. Sometimes, the user is the customer. But more often, the user and the customer are different, and the role of system or service sponsor may additionally need to be distinguished.
The following definitions may help:
-
The consumer (sometimes called the user) is the person actually interacting with the IT or digital service
-
The customer is a source of revenue for the service
-
If the service is part of a profit center, the customer is the person actually purchasing the product (e.g., demand deposit banking). If the service is part of a cost center (e.g., a human resources system), the customer is best seen as an internal executive, as the actual revenue-producing customers are too far removed.
-
-
The sponsor is the person who authorizes and controls the funding used to construct and operate the service
Depending on the service type, these roles can be filled by the same or different people. Here are some examples:
| Example | Consumer | Customer | Sponsor | Notes |
|---|---|---|---|---|
Online banking |
Bank account holder |
Managing Director, consumer banking |
Customer-facing profit center with critical digital component |
|
Online restaurant reservation application |
Restaurant customers |
Restaurant owners |
Product owner |
Profit-making digital product |
Enterprise human resources application |
Human resources analyst |
Vice-president, human resources |
Cost center funded through corporate profits |
|
Online video streaming service |
End video consumer (e.g., any family member) |
Streaming account holder (e.g., parent) |
Streaming video product owner |
Profit-making digital product |
Social traffic application |
Driver |
Advertiser, data consumer |
Product owner |
Profit-making digital product |
So, who paid for the user’s enjoyment? The bank and restaurant both had clear motivation for supporting a better online experience, and people now expect that service organizations provide this. The bank experiences less customer turnover and increased likelihood that customers add additional services. The restaurant sees increased traffic and smoother flow from more efficient reservations. Both see increased competitiveness.
The traffic application is a somewhat different story. While it is an engineering marvel, there is still some question as to how to fund it long term. It requires a large user base to operate, and yet end consumers of the service are unlikely to pay for it. At this writing, the service draws on advertising dollars from businesses wishing to advertise to passersby, and also sells its real-time data on traffic patterns to a variety of customers, such as developers considering investments along given routes.
This last example illustrates the maxim (attributed to media theorist and writer Douglas Rushkoff [265]) that “if you don’t know how the product is making money, you are the product”.
Evidence of Notability
The context for the existence and operation of a digital system is fundamental to its existence; the digital system in fact typically operates as part of a larger sociotechnical system. The cybernetics literature [301, 25] provides theoretical grounding. The IT Service Management (ITSM) literature is also concerned with the context for IT services, in terms of the desired outcomes they provide to end consumers [282].
Limitations
Understanding a product context is important; however, there is feedback between a product and its context, so no amount of initial analysis will be able to accurately predict the ultimate outcome of fielding a given digital product (internally or externally). A concrete example is the concept of a network effect, in which a product becomes more valuable due to the size of its user base [117].
Related Topics
6.1.1.2. Digital Value Methods
|
Note
|
This topic is covered in further depth in Context II, when product management emerges as a fully formalized capability. However, even in the individual context the practitioner should have some idea of product positioning and discovery. |
Description
Once context is at least initially understood, there are a number of well-known approaches that can help the practitioner bridge from an understanding of your product context, to an effective vision for building and sustaining a product:
-
Traditional business case analysis
-
Alexander Osterwalder’s Business Model Canvas
-
Eric Ries' Lean Startup
The Business Model Canvas and the Lean Startup may seem more suitable for truly entrepreneurial contexts, but there are many practitioners in larger organizations who apply these techniques as well; the thought experiment is "business within a business"; i.e., intrapreneurship [162].
6.1.1.2.1. Business Model Canvas
One recent book that has been influential among entrepreneurs is Alex Osterwalder’s Business Model Generation [215]. This document is perhaps best known for introducing the concept of the Business Model Canvas, which it defines as: “a shared language for describing, visualizing, assessing, and changing business models”. The Business Model Canvas uses nine major categories to describe the business model:
-
Key Partners
-
Key Activities
-
Value Proposition
-
Customer Relationships
-
Customer Segments
-
Key Resources
-
Channels
-
Cost Structure
-
Revenue Streams
and suggests they be visualized as in Figure 8, “Business Model Canvas” (similar to [215], p.44).
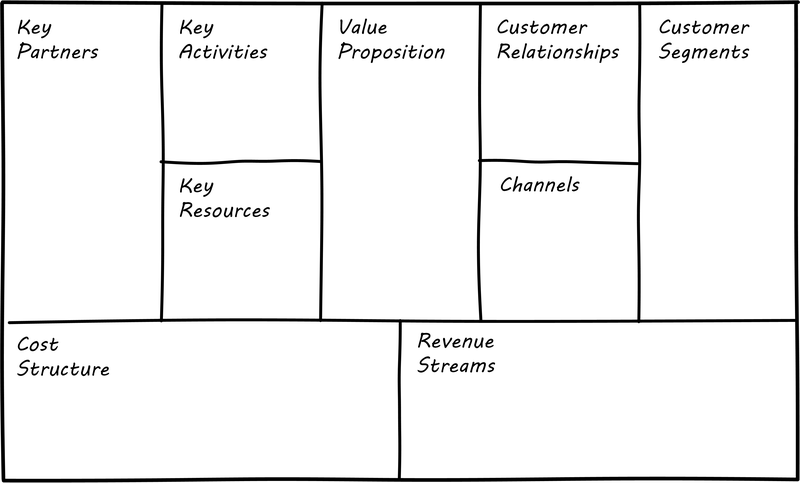
The canvas is then used in collaborative planning; e.g., as a large format wall poster where the business team can brainstorm, discuss, and fill in the boxes (e.g., what is the main “Value Proposition"? Mobile bank account access?).
Osterwalder and his colleagues, in Business Model Generation and the follow-up Value Proposition Design [216], suggest a wide variety of imaginative and creative approaches to developing business models and value propositions, in terms of patterns, processes, design approaches, and overall strategy.
6.1.1.2.2. Business Case Analysis
There are a wide variety of analysis techniques for making a business case at a more detailed level. Donald Reifer, in Making the Software Business Case [228], lists:
-
Breakeven analysis
-
Cause-and-effect analysis
-
Cost/benefit analysis
-
Value chain analysis
-
Investment opportunity analysis
-
Pareto analysis
-
Payback analysis
-
Sensitivity analysis
-
Trend analysis
Empirical, experimental approaches are essential to digital management. Any analysis, carried to an extreme without a sound basis in real data, risks becoming a “castle in the air”. But when real money is on the line (even the opportunity costs of the time you are spending on your startup), it is advisable to look at the decision from various perspectives. These techniques can be useful for that purpose. However, once you have some indication there might be business value in a given idea, applying Lean Startup techniques may be more valuable than continuing to analyze.
6.1.1.2.3. Lean Startup
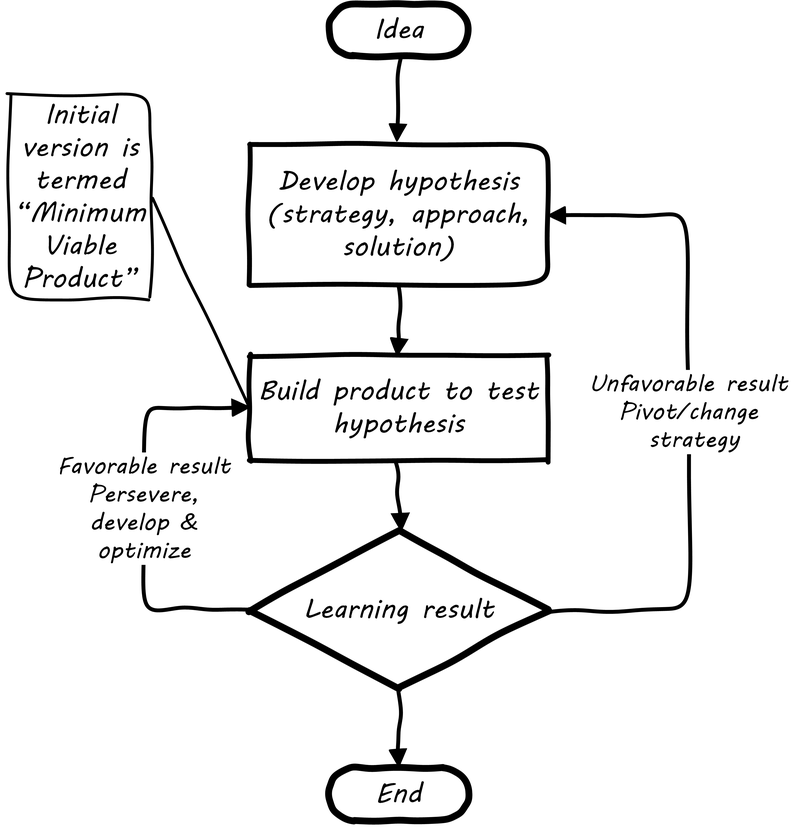
Lean Startup is a philosophy of entrepreneurship developed by Eric Ries [232]. It is not specific to IT; rather, it is broadly applicable to all attempts to understand a product and its market. (According to our definition of product management a workable market position is essential to any product.)
The idea of the Lean Startup has had profound influence on product design, including market-facing and even internal IT systems. It is grounded in Agile concepts such as:
“Do the simplest thing that could possibly work.”
Lean Startup calls for an iterative, “Build-Measure-Learn” cycle (see Figure 9, “Lean Startup Flowchart”, summary of ideas in [232]). Repeating this cycle frequently is the essential process of building a successful startup (whatever the digital proportion):
-
Develop an idea for a "Minimum Viable Product" MVP
-
Measure its effectiveness in the market (internal/external)
-
Learn from the experiment
-
Decide to persevere or pivot (change direction while leveraging momentum)
-
New idea development, evolution of MVP
Flowcharts such as Figure 9, “Lean Startup Flowchart” are often seen to describe the Lean Startup process.
6.1.1.2.4. Digital Security
A Digital Practitioner often starts by thinking about value creation through their digital products or services. However, now is also the time to think about protecting that digital value. Your customers will be sharing data about themselves, their preferences, and even financial information; e.g., credit cards to make purchases. Failure to protect that data can irreparably damage any other digital value you manage to create; it will certainly damage your or your organization’s reputation, and may have financial consequences.
Architects of buildings need to appreciate that the physical materials that will implement their creations need to be strong enough to produce the envisioned construct. Similarly, a Digital Practitioner needs to understand that software can be weak and they need to appreciated how to examine the software artifacts for the precursors of those weaknesses that would threaten the operational capabilities and integrity of their envisioned constructs.
Attack surface analysis, design reviews for security weaknesses, static source code analysis for weaknesses, dynamic fuzz testing, adversary-based pen testing, and binary analysis are all techniques used to gain confidence that dangerous failure modes of the software-based system are not rampant and that some evidence-based argument can be made about the adequacy of the rigor used to create the software.
In the building of buildings, this is done by the engineering elements of a team, along with building code inspectors and material scientists, but the analogous activities are not the norm in software systems. So, as you go through both the analysis and description phase and the construction phase, keep in mind that that all software has strengths and weaknesses and needs to be checked for weaknesses that would impact the intended functionality, reasoning, and logic. See the [Common Weakness Enumeration (Mitre)] for examples of weaknesses with security, performance, reliability, and maintainability consequences.
As software-enabled elements become more entwined in our physical lives, both at work and not, there needs to be attention paid to this line of thinking in the education of the software-based systems work force.
A deeper treatment of this subject can be found in the later chapter on Security and in The Open Group Guide to Integrating Risk and Security Within a TOGAF® Enterprise Architecture.
Evidence of Notability
The complex process of discovering and supporting digital value is covered in industry work on Digital Transformation [298, 81]. It is also addressed as an important sub-topic within the product management literature, especially at its intersection with Agile. Product management is a large and growing professional community, with a major professional organization (the Product Development and Marketing Association) and many less formalized meetings and groups. It has a correspondingly rich body of professional literature [36, 53, 114]. Product management is also a major topic at Agile conferences.
Limitations
Some digital efforts are more instrumental, and provide value in the same way that a cog provides value to a machine. They have little independence. Discussions of value imply greater autonomy to act on the analysis. Business case analysis would rarely be applied in the engineering of a small component; similarly, business case analysis makes less sense with digital systems whose existence is required by a larger whole. It is at the level of that larger whole that value analysis should take place.
Related Topics
6.1.1.3. The Digital Stack
Description
6.1.1.3.1. The Moment of Truth
Any human-facing digital service can be seen as delivering a “moment of truth”. In terms of digital systems, this English-language cliche (elaborated into an important service concept by SAS group president Jan Carlzon [55]) represents the user’s outcome, their experience of value. All discussions of digital value should either start or end there.
In order to view a bank balance, a user may use an application downloaded from a “store” of applications made available to her device. On her device, this “app” is part of an intricate set of components performing functions such as:
-
Accepting “input” (user intent) through a screen or voice input
-
Processing that input through software and acting on her desire to see her bank balance
-
Connecting to the phone network
-
Securely connecting over the mobile carrier network to the Internet and then to the bank
-
Identifying the user to the bank’s systems
-
Requesting the necessary information (in this case, an account balance)
-
Receiving that information and converting it to a form that can be represented on a screen
-
Finally, displaying the information on the screen
The application, or “app”, downloaded to the phone plays a primary role, but is enabled by:
-
The phone’s Operating System (OS) and associated services
-
The phone’s hardware
-
The telecommunications infrastructure (cell phone towers, long distance fiber optic cables, switching offices, and much more)
Of course, without the banking systems on the other end, there is no bank balance to transmit. These systems are similar, but on a much larger scale than the end user’s device:
-
Internet and middleware services to receive the request from the international network
-
Application services to validate the user’s identity and route the request to the appropriate handling service
-
Data services to store the user’s banking information (account identity and transactions) along with millions of other customers
-
Many additional services to detect fraud and security attacks, report on utilization, identify any errors in the systems, and much more
-
Physical data centers full of computers and associated hardware including massive power and cooling infrastructure, and protected by security systems and personnel
Consider: what does all this mean to the user? Does she care about cell phone towers, or middleware, or triply redundant industrial-strength Power Distribution Units ? Usually, not in the least. Therefore, as we study this world, we need to maintain awareness of her perspective. The user is seeking some value that digital technology uniquely can enable, but does not want to consider all the complexity that goes into it. She just wants to go out with friends. The moment of truth (see Figure 10, “The Digital Stack Supports the Moment of Truth”) depends on the service; the service may contain great complexity, but part of its success lies in shielding the user from that complexity.
6.1.1.3.2. Stack Examples
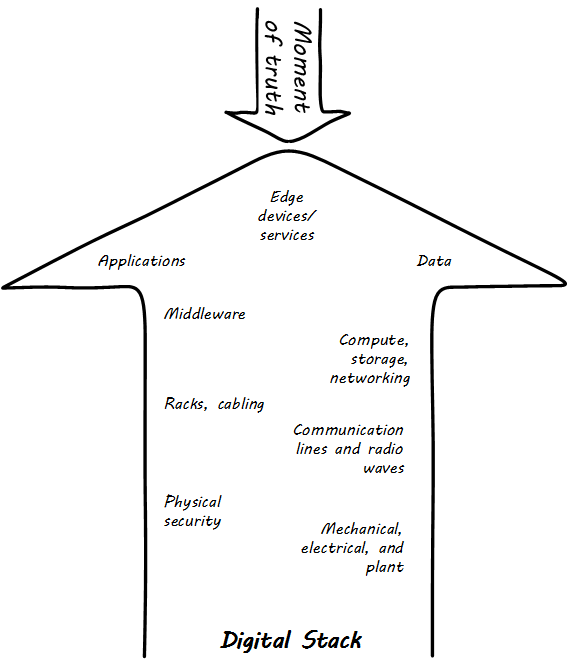
The outcome of a digital service (e.g., an account balance lookup for an online banking application) is supported by a complex, layered structure of technology. For example, a simple systems architecture might be represented in layers as:
-
User interface
-
Middleware/business logic
-
Data management
-
OS
-
Network
Architecture also uses a layered method, but in a different way that is more abstracted from the particular and concrete to the conceptual; for example:
-
Business process architecture
-
Information architecture
-
Application architecture
-
Technical architecture
Evidence of Notability
The use of layered abstractions in digital systems engineering is well established. Such abstractions may be highly technical, such as the OSI stack describing layered networking protocols [154], or more conceptual, such as the Zachman Framework [313].
Limitations
Sometimes, organizations attempt to structure themselves around the stack, with separate functional units for user interface, middleware, data management, network, and so forth. This approach may result in monolithic, hard to change systems. See Conway’s Law.
Related Topics
6.1.1.4. The Digital Lifecycle
6.1.1.4.1. The Essential States of the Digital Product
Description
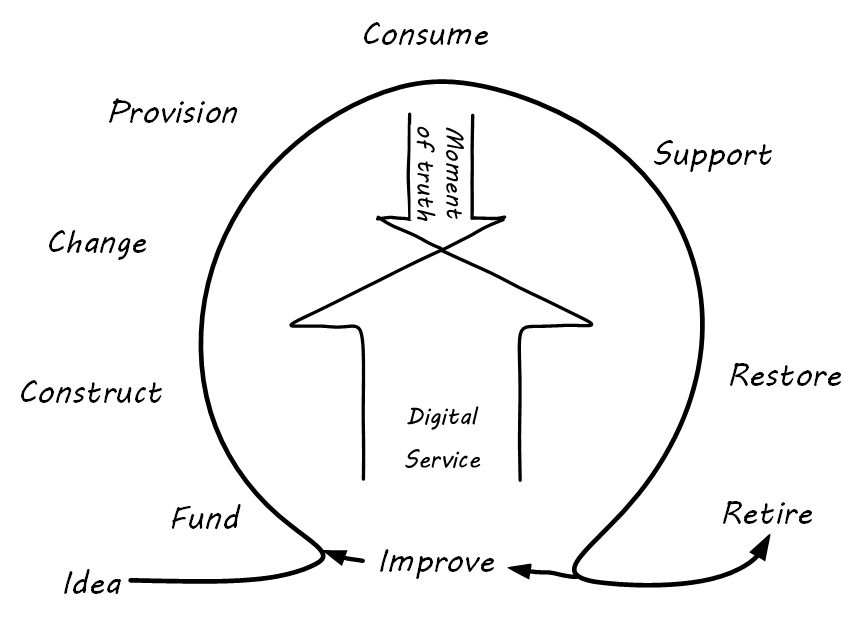
The digital or IT service is based on a complex stack of technology, from local devices to global networks to massive data centers. Software and hardware are layered together in endlessly inventive ways to solve problems people did not even know they had ten years ago. However, these IT service systems must come from somewhere. They must be designed, built, and operated, and continually improved over time. A simple representation of the IT service lifecycle is:
-
An idea is developed for an IT-enabled value proposition that can make a profit, or better fulfill a mission
-
The idea must garner support and resources so that it can be built
-
The idea is then constructed, at least as an initial proof of concept or MVP (construction is assumed to include an element of design; in this document, design and construction are not represented as two large-scale separate phases; the activities may be distinct, but are conducted within a context of faster design-build iterations)
-
There is a critical state transition, however, that will always exist; initially, it is the change from OFF to ON when the system is first constructed - after the system is ON, there are still distinct changes in state when new features are deployed, or incorrect behaviors ("bugs" or "defects") are rectified
-
The system may be ON, but it is not delivering value until the user can access it; sometimes, that may be as simple as providing someone with a network address, but usually there is some initial "provisioning" of system access to the user, who needs to identify themselves
-
The system can then deliver services (moments of truth) to the end users; it may deliver millions or billions of such experiences, depending on its scale and how to count the subjective concept of value experience
-
The user may have access, but may still not receive value, if they do not understand the system well enough to use it; whether via a formal service desk, or informal social media channels, users of IT services will require and seek support on how to maximize the value they are receiving from the system
-
Sometimes, something is wrong with the system itself; if the system is no longer delivering value experiences (bank balances, restaurant reservations, traffic directions) then some action must be taken promptly to restore service
-
All of the previous states in the lifecycle generate data and insight that lead to further evolution of the system; there is a wide variety of ways systems may evolve: new user functionality, more stable technology, increased system capacity, and more - such motivations result in new construction and changes to the existing system, and so the cycle begins again
-
Unless … the system’s time is at an end; if there is no reason for the system to exist any longer, it should be retired
The digital service/product evolves over time, through many repetitions ("iterations") of the improvement cycle. An expanding spiral is a useful visualization:
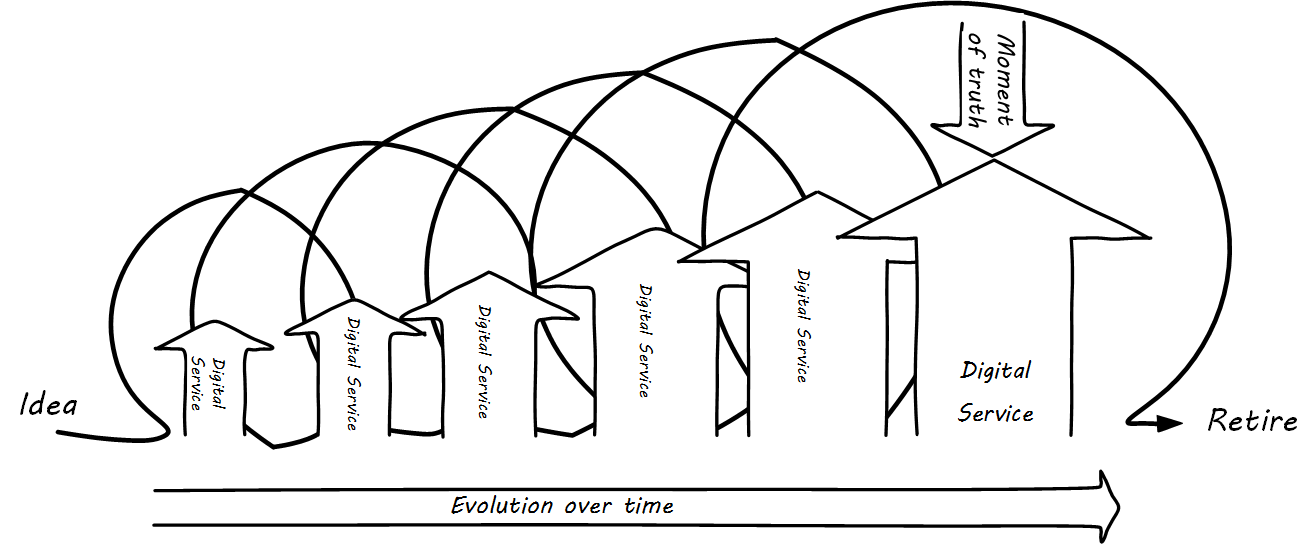
This entire process, from idea to decommissioning (“inspire to retire”) can be understood as the service lifecycle (see Figure 12, “The Digital Service Lifecycle”). Sometimes, the service lifecycle is simplified as "plan, build, run"; however, this can lead to the assumption that only one iteration is required, which is in general incorrect in digital systems. Multiple iterations should be assumed as the product is fine-tuned and evolves to meet changing demand.
We can combine the service experience (moment of truth) with the service/product lifecycle into the “dual-axis value chain” (originally presented in [32]):
The dual-axis value chain can be seen in many representations of IT and digital delivery systems. Product evolution flows from right to left, while day-to-day value flows up, through the technical stack. It provides a basis for (among other things) thinking about the IT user, customer, and sponsor, which we will cover in the next section.
6.1.1.4.2. The Three Ways of DevOps
DevOps is discussed in depth later in this document. At this point, however, as originally conceived in The Phoenix Project [165], there are three core DevOps principles applicable at the earliest stages of the digital product:
-
Flow (the "First Way")
-
Feedback (the "Second Way")
-
Continuous Learning (the "Third Way")
DevOps emphasizes speeding up the flow of value in the product lifecycle (left to right), and the feedback of learning (right to left) "at all stages of the value stream". When this is done consistently at scale over time, DevOps advocates argue that the result is a: "generative, high-trust culture that supports a dynamic, disciplined, and scientific approach to experimentation and risk-taking, facilitating the creation of organizational learning, both from our successes and failures. Furthermore, by continually shortening and amplifying our feedback loops, we create ever-safer systems of work and are better able to take risks and perform experiments that help us learn faster than our competition and win in the marketplace." [166 p. 12].
Limitations
The limitations of relying on a lifecycle model as a basis for systems implementation are by now well known. Attempting to fully understand a system’s "requirements" prior to any development can lead to project failure, and deferring integration of sub-modules until late in a project also is risky. See Agile canon for further discussion (e.g., [250, 220, 230, 68]). Nevertheless, the concept of the lifecycle remains a useful model; these state transitions exist and drive organizational behavior.
Evidence of Notability
The evidence for this topic’s importance is seen across much guidance for software and systems professionals. Examples include the original statement of "waterfall" development [241], the overlapping phases of the Rational Unified Process [227], the ITIL Service Lifecycle’s "strategy/design/transition/operate/improve," [282], the clear reach and influence of the DevOps movement, and many more.
Related Topics
6.1.2. Digital Infrastructure
Area Description
A Digital Practitioner cannot start developing a product until deciding what it will be built with. They also need to understand something of how computers are operated, enough to make decisions on how the system will run. Most startups choose to run IT services on infrastructure owned by a cloud computing provider, but there are other options. As the product scales up, the practitioner will need to be more and more sophisticated in their understanding of its underlying IT services. Finally, developing deep skills in configuring the base platform is one of the most important capabilities for the practitioner.
6.1.2.1. Computing and Information Principles
Description
“Information Technology” (IT) is ultimately based on the work of Claude Shannon, Alan Turing, Alonzo Church, John von Neumann, and the other pioneers who defined the central problems of information theory, digital logic, computability, and computer architecture.
Pragmatically, there are three major physical aspects to “IT infrastructure” relevant to the practitioner:
-
Computing cycles (sometimes called just “compute”)
-
Memory and storage (or “storage”)
-
Networking and communications (or “network”)
6.1.2.1.1. Compute
Compute is the resource that performs the rapid, clock-driven digital logic that transforms data inputs to outputs.
Software is the thing that structures the logic and reasoning of the “compute” and allows for the dynamic use of inputs to vary the output following the logic and reasoning laid down by the software developer. While the computers process instructions at the level of “true” and “false”, represented as binary “1s” and “0s”, because humans cannot easily understand binary data and processing, higher-level abstractions of machine code and programming languages are used.
It is critical to understand that computers, traditionally understood, can only operate in precise, "either-or" ways. Computers are often used to automate business processes, but in order to do so, the process needs to be carefully defined, with no ambiguity. Complications and nuances, intuitive understandings, judgment calls — in general, computers can’t do any of this, unless and until you program them to — at which point the logic is no longer intuitive or a judgment call.
Creating programs for a specific functionality is challenging in two different ways:
-
Understanding the desired functionality, logic, and reasoning of the intended program takes skill as does the implementation of that reasoning into software and requires much testing and validation
-
The software programming languages, designs, and methods used can be flawed and unable to withstand the intended volume of data, user interactions, malicious inputs, or careless inputs, and testing for these must also be done, known as abuse "case testing"
Computer processing is not free. Moving data from one point to another — the fundamental transmission of information — requires matter and energy, and is bound up in physical reality and the laws of thermodynamics. The same applies for changing the state of data, which usually involves moving it somewhere, operating on it, and returning it to its original location. In the real world, even running the simplest calculation has physical and therefore economic cost, and so we must pay for computing.
6.1.2.1.2. Storage
Storage is the act of computation that is bound up with the concept of state, but they are also distinct. Computation is a process; state is a condition. Many technologies have been used for digital storage [71]. Increasingly, the IT professional need not be concerned with the physical infrastructure used for storing data. Storage increasingly is experienced as a virtual resource, accessed through executing programmed logic on cloud platforms. “Underneath the covers” the cloud provider might be using various forms of storage, from Random Access Memory (RAM) to solid state drives to tapes, but the end user is, ideally, shielded from the implementation details (part of the definition of a service).
In general, storage follows a hierarchy. Just as we might “store” a document by holding it in our hands, setting it on a desktop, filing it in a cabinet, or archiving it in a banker’s box in an offsite warehouse, so computer storage also has different levels of speed and accessibility:
-
On-chip registers and cache
-
Random Access Memory (RAM), aka “main memory”
-
Online mass storage, often “disk”
-
Offline mass storage; e.g., “tape”
6.1.2.1.3. Networking
With a computing process, one can change the state of some data, store it, or move it. The last is the basic concern of networking, to transmit data (or information) from one location to another. We see evidence of networking every day; coaxial cables for cable TV, or telephone lines strung from pole to pole in many areas. However, like storage, there is also a hierarchy of networking:
-
Intra-chip pathways
-
Motherboard and backplane circuits
Like storage and compute, networking as a service increasingly is independent of implementation. The developer uses programmatic tools to define expected information transmission, and (ideally) need not be concerned with the specific networking technologies or architectures serving their needs.
Evidence of Notability
-
Body of computer science and information theory (Church/Turing/Shannon et al.)
-
Basic IT curricula guidance and textbooks
Limitations
-
Quantum computing
-
Computing where mechanisms become opaque (e.g., neural nets) and therefore appear to be non-deterministic
Related Topics
6.1.2.2. Virtualization
6.1.2.2.1. Virtualization Basics
Description
Assume a simple, physical computer such as a laptop. When the laptop is first turned on, the OS loads; the OS is itself software, but is able to directly control the computer’s physical resources: its Central Processing Unit (CPU), memory, screen, and any interfaces such as WiFi, USB, and Bluetooth. The OS (in a traditional approach) then is used to run “applications” such as web browsers, media players, word processors, spreadsheets, and the like. Many such programs can also be run as applications within the browser, but the browser still needs to be run as an application.

In the simplest form of virtualization, a specialized application known as a hypervisor is loaded like any other application. The purpose of this hypervisor is to emulate the hardware computer in software. Once the hypervisor is running, it can emulate any number of “virtual” computers, each of which can have its own OS (see Figure 14, “Virtualization is Computers within a Computer”). The hypervisor mediates the "virtual machine" access to the actual, physical hardware of the laptop; the virtual machine can take input from the USB port, and output to the Bluetooth interface, just like the master OS that launched when the laptop was turned on.
There are two different kinds of hypervisors. The example we just discussed was an example of a Type 2 hypervisor, which runs on top of a host OS. In a Type 1 hypervisor, a master host OS is not used; the hypervisor runs on the “bare metal” of the computer and in turn “hosts” multiple virtual machines.
Paravirtualization, e.g., containers, is another form of virtualization found in the marketplace. In a paravirtualized environment, a core OS is able to abstract hardware resources for multiple virtual guest environments without having to virtualize hardware for each guest. The benefit of this type of virtualization is increased Input/Output (I/O) efficiency and performance for each of the guest environments.
However, while hypervisors can support a diverse array of virtual machines with different OSs on a single computing node, guest environments in a paravirtualized system generally share a single OS. See Figure 15, “Virtualization Types” for an overview of all the types.
6.1.2.2.2. Virtualization and Efficiency
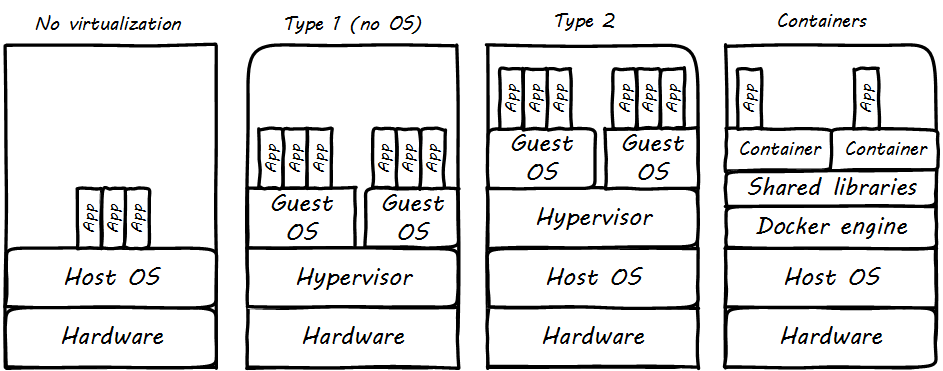
Virtualization attracted business attention as a means to consolidate computing workloads. For years, companies would purchase servers to run applications of various sizes, and in many cases the computers were badly underutilized. Because of configuration issues and (arguably) an overabundance of caution, average utilization in a pre-virtualization data center might average 10-20%. That’s up to 90% of the computer’s capacity being wasted (see Figure 16, “Inefficient Utilization”).
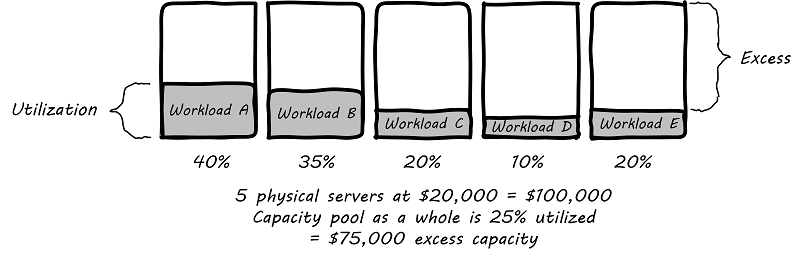
The above figure is a simplification. Computing and storage infrastructure supporting each application stack in the business were sized to support each workload. For example, a payroll server might run on a different infrastructure configuration than a Data Warehouse (DW) server. Large enterprises needed to support hundreds of different infrastructure configurations, increasing maintenance and support costs.
The adoption of virtualization allowed businesses to compress multiple application workloads onto a smaller number of physical servers (see Figure 17, “Efficiency through Virtualization”).
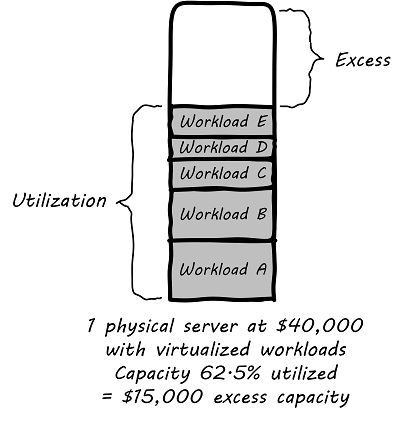
|
Note
|
For illustration only. A utilization of 62.5% might actually be a bit too high for comfort, depending on the variability and criticality of the workloads. |
In most virtualized architectures, the physical servers supporting workloads share a consistent configuration, which makes it easy to add and remove resources from the environment. The virtual machines may still vary greatly in configuration, but the fact of virtualization makes managing that easier — the virtual machines can be easily copied and moved, and increasingly can be defined as a form of code.
Virtualization thus introduced a new design pattern into the enterprise where computing and storage infrastructure became commoditized building blocks supporting an ever-increasing array of services. But what about where the application is large and virtualization is mostly overhead? Virtualization still may make sense in terms of management consistency and ease of system recovery.
6.1.2.2.3. Container Management and Kubernetes
Containers (paravirtualization) have emerged as a powerful and convenient technology for managing various workloads. Architectures based on containers running in Cloud platforms, with strong API provisioning and integrated support for load balancing and autoscaling, are called "cloud-native". The perceived need for a standardized control plane for containers resulted in various initiatives in the 2010s: Docker Swarm, Apache Mesos®, and (emerging as the de facto standard), the Cloud Native Computing Foundation’s Kubernetes.
Kubernetes is an open source orchestration platform based on the following primitives (see Figure 18, “Kubernetes Infrastructure, Pods, and Services”):
-
Pods: group containers
-
Services: a set of pods supporting a common set of functionality
-
Volumes: define persistent storage coupled to the lifetime of pods (therefore lasting across container lifetimes, which can be quite brief)
-
Namespaces: in Kubernetes (as in computing generally) provide mutually-exclusive labeling to partition resources
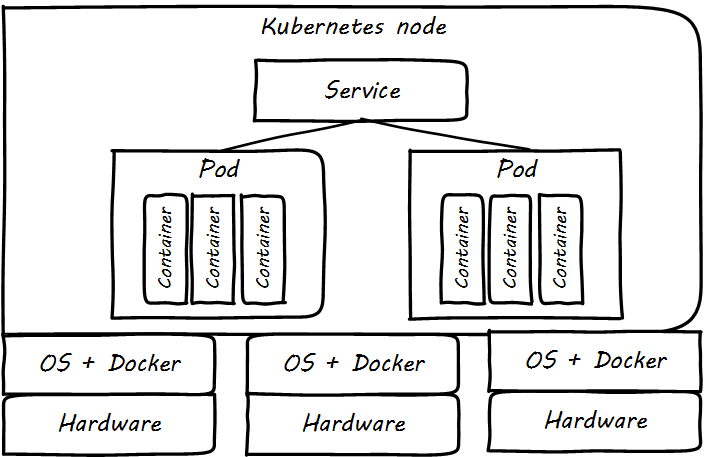
Kubernetes management (see Figure 19, “Kubernetes Cluster Architecture”) is performed via a Master controller which supervisees the nodes. This consists of:
-
API server: the primary communication point for provisioning and control requests
-
Controller manager: implements declarative functionality, in which the state of the cluster is managed against policies; the controller seeks to continually converge the actual state of the cluster with the intended (policy-specified) state (see Imperative and Declarative)
-
Scheduler: manages the supply of computing resources to the stated (policy-drive) demand
The nodes run:
-
Kubelet for managing nodes and containers
-
Kube-proxy for services and traffic management
Much other additional functionality is available and under development; the Kubernetes ecosystem as of 2019 is growing rapidly.
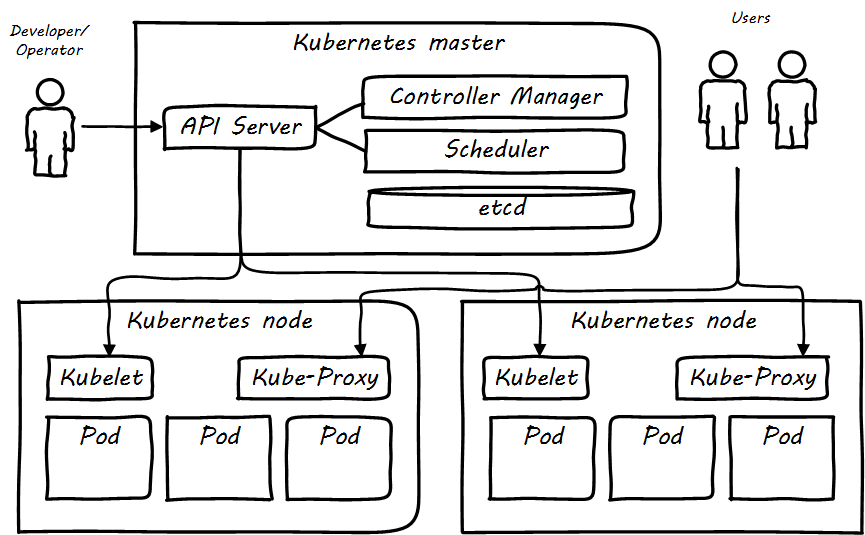
Graphics similar to those presented in [305+]+.
Competency Category "Virtualization" Example Competencies
-
Install and configure a virtual machine
-
Configure several virtual machines to communicate with each other
Evidence of Notability
Virtualization was predicted in the earliest theories that led to the development of computers. Turing and Church realized that any general-purpose computer could emulate any other. Virtual systems have existed in some form since at latest 1967 — only 20 years after the first fully functional computers.
Virtualization is discussed extensively in core computer science and engineering texts and is an essential foundation of cloud computing.
The Cloud-Native community is at this writing (2019) one of the most active communities in computing.
Limitations
Virtualization is mainly relevant to production computing. It is less relevant to edge devices.
Related Topics
6.1.2.3. Cloud Services
Description
Companies have always sought alternatives to owning their own computers. There is a long tradition of managed services, where applications are built out by a customer and then their management is outsourced to a third party. Using fractions of mainframe “time-sharing” systems is a practice that dates back decades. However, such relationships took effort to set up and manage, and might even require bringing physical tapes to the third party (sometimes called a “service bureau”). Fixed-price commitments were usually high (the customer had to guarantee to spend X dollars). Such relationships left much to be desired in terms of responsiveness to change.
As computers became cheaper, companies increasingly acquired their own data centers, investing large amounts of capital in high-technology spaces with extensive power and cooling infrastructure. This was the trend through the late 1980s to about 2010, when cloud computing started to provide a realistic alternative with true “pay as you go” pricing, analogous to electric metering.
The idea of running IT completely as a utility service goes back at least to 1965 and the publication of The Challenge of the Computer Utility, by Douglas Parkhill (see Figure 20, “Initial Statement of Cloud Computing”). While the conceptual idea of cloud and utility computing was foreseeable 50 years ago, it took many years of hard-won IT evolution to support the vision. Reliable hardware of exponentially increasing performance, robust open-source software, Internet backbones of massive speed and capacity, and many other factors converged towards this end.

However, people store data — often private — on computers. In order to deliver compute as a utility, it is essential to segregate each customer’s workload from all others. This is called multi-tenancy. In multi-tenancy, multiple customers share physical resources that provide the illusion of being dedicated.
|
Note
|
The phone system has been multi-tenant ever since they got rid of party lines. A party line was a shared line where anyone on it could hear every other person. |
In order to run compute as a utility, multi-tenancy was essential. This is different from electricity (but similar to the phone system). As noted elsewhere, one watt of electric power is like any other and there is less concern for information leakage or unexpected interactions. People’s bank balances are not encoded somehow into the power generation and distribution infrastructure.
Virtualization is necessary, but not sufficient for cloud. True cloud services are highly automated, and most cloud analysts will insist that if virtual machines cannot be created and configured in a completely automated fashion, the service is not true cloud. This is currently where many in-house “private” cloud efforts struggle; they may have virtualization, but struggle to make it fully self-service.
Cloud services have refined into at least three major models:
-
Software as a Service (SaaS)
-
Platform as a Service (PaaS)
-
Infrastructure as a Service (IaaS)
There are cloud services beyond those listed above (e.g., Storage as a Service). Various platform services have become extensive on providers such as Amazon™, which offers load balancing, development pipelines, various kinds of storage, and much more.
Evidence of Notability
Cloud computing is one of the most economically active sectors in IT. Cloud computing has attracted attention from the US National Institute for Standards and Technology (NIST) [209]. Cloud law is becoming more well defined [196].
Limitations
The future of cloud computing appears assured, but computing and digital competencies also extend to edge devices and in-house computing. The extent to which organizations will retain in-house computing is a topic of industry debate.
Related Topics
6.1.2.4. Configuration Management and Infrastructure as Code
Description
This section covers:
-
Version control
-
Source control
-
Package management
-
Deployment management
-
Configuration management
6.1.2.4.1. Managing Infrastructure
Two computers may both run the same version of an OS, and yet exhibit vastly different behaviors. This is due to how they are configured. One may have web serving software installed; the other may run a database. One may be accessible to the public via the Internet; access to the other may be tightly restricted to an internal network. The parameters and options for configuring general-purpose computers are effectively infinite. Mis-configurations are a common cause of outages and other issues.
In years past, infrastructure administrators relied on the ad hoc issuance of commands either at an operations console or via a GUI-based application. Such commands could also be listed in text files; i.e., "batch files" or "shell scripts" to be used for various repetitive processes, but systems administrators by tradition and culture were empowered to issue arbitrary commands to alter the state of the running system directly.
However, it is becoming more and more rare for a systems administrator to actually “log in” to a server and execute configuration-changing commands in an ad hoc manner. Increasingly, all actual server configuration is based on pre-developed specification.
Because virtualization is becoming so powerful, servers increasingly are destroyed and rebuilt at the first sign of any trouble. In this way, it is certain that the server’s configuration is as intended. This again is a relatively new practice.
Previously, because of the expense and complexity of bare-metal servers, and the cost of having them offline, great pains were taken to fix troubled servers. Systems administrators would spend hours or days troubleshooting obscure configuration problems, such as residual settings left by removed software. Certain servers might start to develop “personalities”. Industry practice has changed dramatically here since around 2010.
As cloud infrastructures have scaled, there has been an increasing need to configure many servers identically. Auto-scaling (adding more servers in response to increasing load) has become a widely used strategy as well. Both call for increased automation in the provisioning of IT infrastructure. It is simply not possible for a human being to be hands on at all times in configuring and enabling such infrastructures, so automation is called for.
Sophisticated Infrastructure as Code techniques are an essential part of modern SRE practices such as those used by Google®. Auto-scaling, self-healing systems, and fast deployments of new features all require that infrastructure be represented as code for maximum speed and reliability of creation.
Infrastructure as Code is defined by Morris as: an approach to infrastructure automation based on practices from software development. It emphasizes consistent, repeatable routines for provisioning and changing systems and their configuration. Changes are made to definitions and then rolled out to systems through unattended processes that include thorough validation. [203+]+
6.1.2.4.2. Infrastructure as Code
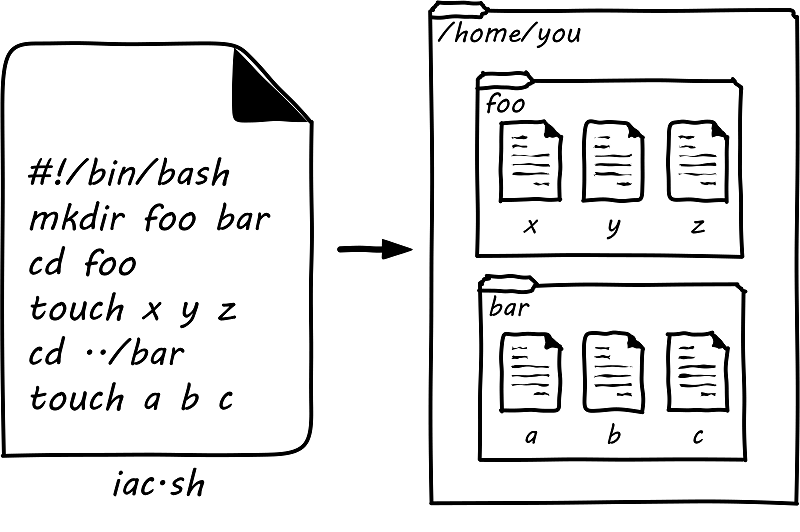
In presenting Infrastructure as Code at its simplest, we will start with the concept of a shell script. Consider the following set of commands:
$ mkdir foo bar
$ cd foo
$ touch x y z
$ cd ../bar
$ touch a b c
What does this do? It tells the computer:
-
Create (
mkdir) two directories, one named foo and one named bar -
Move (
cd) to the one named foo -
Create (
touch) three files, named x, y, and z -
Move to the directory named bar
-
Create three blank files, named a, b, and c
A user with the appropriate permissions at a UNIX® or Linux® command prompt who runs those commands will wind up with a configuration that could be visualized as in Figure 21, “Simple Directory/File Structure Script”. Directory and file layouts count as configuration and in some cases are critical.
Assume further that the same set of commands is entered into a text file thus:
#!/bin/bash
mkdir foo bar
cd foo
touch x y z
cd ../bar
touch a b c
The file might be named iac.sh, and with its permissions set correctly, it could be run so that the computer executes all the commands, rather than a person running them one at a time at the console. If we did so in an empty directory, we would again wind up with that same configuration.
Beyond creating directories and files shell scripts can create and destroy virtual servers and containers, install and remove software, set up and delete users, check on the status of running processes, and much more.
|
Note
|
The state of the art in infrastructure configuration is not to use shell scripts at all but either policy-based infrastructure management or container definition approaches. Modern practice in cloud environments is to use templating capabilities such as Amazon CloudFormation or Hashicorp Terraform (which is emerging as a de facto platform-independent standard for cloud provisioning). |
6.1.2.4.3. Version Control
Consider again the iac.sh file. It is valuable. It documents intentions for how a given configuration should look. It can be run reliably on thousands of machines, and it will always give us two directories and six files. In terms of the previous section, we might choose to run it on every new server we create. Perhaps it should be established it as a known resource in our technical ecosystem. This is where version control and the broader concept of configuration management come in.
For example, a configuration file may be developed specifying the capacity of a virtual server, and what software is to be installed on it. This artifact can be checked into version control and used to re-create an equivalent server on-demand.
Tracking and controlling such work products as they evolve through change after change is important for companies of any size. The practice applies to computer code, configurations, and, increasingly, documentation, which is often written in a lightweight markup language like Markdown or Asciidoc. In terms of infrastructure, configuration management requires three capabilities:
-
The ability to backup or archive a system’s operational state (in general, not including the data it is processing — that is a different concern); taking the backup should not require taking the system down
-
The ability to compare two versions of the system’s state and identify differences
-
The ability to restore the system to a previously archived operational state
Version control is critical for any kind of system with complex, changing content, especially when many people are working on that content. Version control provides the capability of seeing the exact sequence of a complex system’s evolution and isolating any particular moment in its history or providing detailed analysis on how two versions differ. With version control, we can understand what changed and when – which is essential to coping with complexity.
While version control was always deemed important for software artifacts, it has only recently become the preferred paradigm for managing infrastructure state as well. Because of this, version control is possibly the first IT management system you should acquire and implement (perhaps as a cloud service, such as Github, Gitlab, or Bitbucket).
Version control in recent years increasingly distinguishes between source control and package management (see Figure 22, “Types of Version Control” and Figure 27, “Configuration Management and its Components” below): the management of binary files, as distinct from human-understandable symbolic files. It is also important to understand what versions are installed on what computers; this can be termed “deployment management”. (With the advent of containers, this is a particularly fast-changing area.)
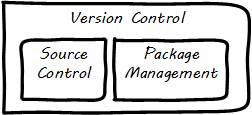
Version control works like an advanced file system with a memory. (Actual file systems that do this are called versioning file systems.) It can remember all the changes you make to its contents, tell you the differences between any two versions, and also bring back the version you had at any point in time.
Survey research presented in the annual State of DevOps report indicates that version control is one of the most critical practices associated with high-performing IT organizations [44]. Forsgren [98] summarizes the practice of version control as:
-
Our application code is in a version control system
-
Our system configurations are in a version control system
-
Our application configurations are in a version control system
-
Our scripts for automating build and configuration are in a version control system
6.1.2.4.4. Source Control
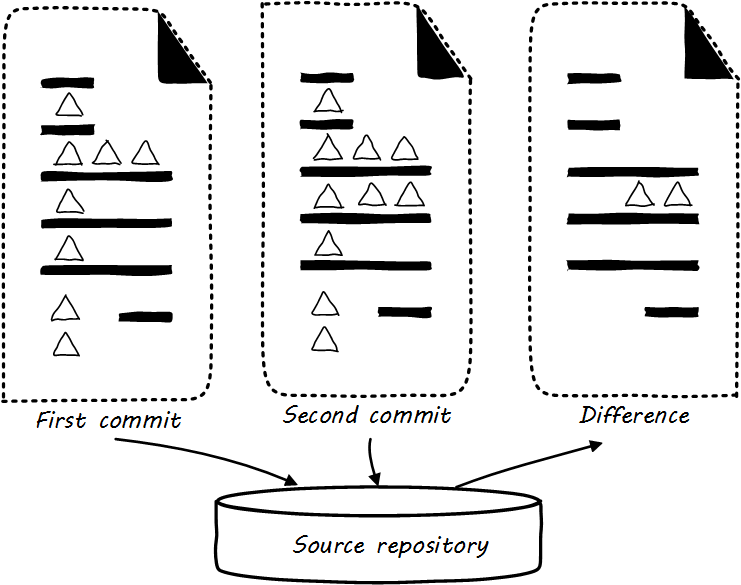
Digital systems start with text files; e.g., those encoded in ASCII or Unicode. Text editors create source code, scripts, and configuration files. These will be transformed in defined ways (e.g., by compilers and build tools) but the human-understandable end of the process is mostly based on text files. In the previous section, we described a simple script that altered the state of a computer system. We care very much about when such a text file changes. One wrong character can completely alter the behavior of a large, complex system. Therefore, our configuration management approach must track to that level of detail.
Source control is at its most powerful when dealing with textual data. It is less useful in dealing with binary data, such as image files. Text files can be analyzed for their differences in an easy to understand way (see Figure 23, “Source Control”). If “abc” is changed to “abd”, then it is clear that the third character has been changed from “c” to “d”. On the other hand, if we start with a digital image (e.g., a *.png file), alter one pixel, and compare the resulting before and after binary files in terms of their data, it would be more difficult to understand what had changed. We might be able to tell that they are two different files easily, but they would look very similar, and the difference in the binary data might be difficult to understand.
The “Commit” Concept
Although implementation details may differ, all version control systems have some concept of “commit”. As stated in Version Control with Git [181]:
In Git, a commit is used to record changes to a repository … Every Git commit represents a single, atomic changeset with respect to the previous state. Regardless of the number of directories, files, lines, or bytes that change with a commit … either all changes apply, or none do. [emphasis added]
The concept of a version or source control “commit” serves as a foundation for IT management and governance. It both represents the state of the computing system as well as providing evidence of the human activity affecting it. The “commit” identifier can be directly referenced by the build activity, which in turn is referenced by the release activity, which typically visible across the IT value chain.
Also, the concept of an atomic “commit” is essential to the concept of a “branch” — the creation of an experimental version, completely separate from the main version, so that various alterations can be tried without compromising the overall system stability. Starting at the point of a “commit”, the branched version also becomes evidence of human activity around a potential future for the system. In some environments, the branch is automatically created with the assignment of a requirement or story. In other environments, the very concept of branching is avoided. The human-understandable, contextual definitions of IT resources is sometimes called metadata.
6.1.2.4.5. Package Management
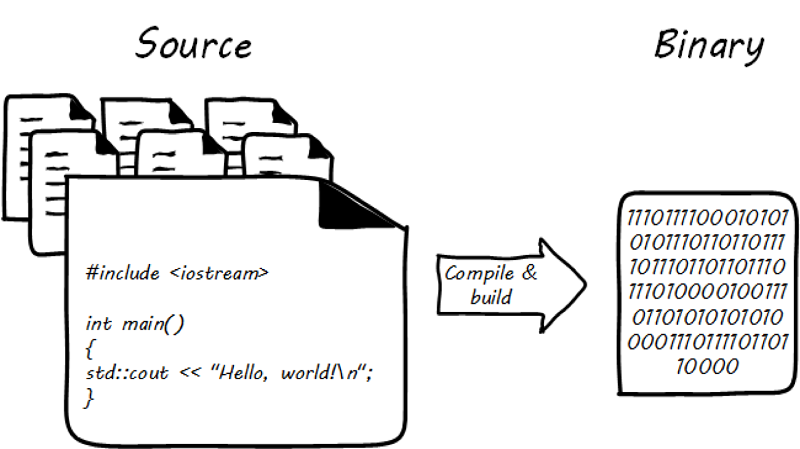
Much if not most software, once created as some kind of text-based artifact suitable for source control, must be compiled and further organized into deployable assets, often called “packages” (see Figure 24, “Building Software”).
In some organizations, it was once common for compiled binaries to be stored in the same repositories as source code (see Figure 25, “Common Version Control”). However, this is no longer considered a best practice. Source and package management are now viewed as two separate things (see Figure 26, “Source versus Package Repos”). Source repositories should be reserved for text-based artifacts whose differences can be made visible in a human-understandable way. Package repositories in contrast are for binary artifacts that can be deployed.
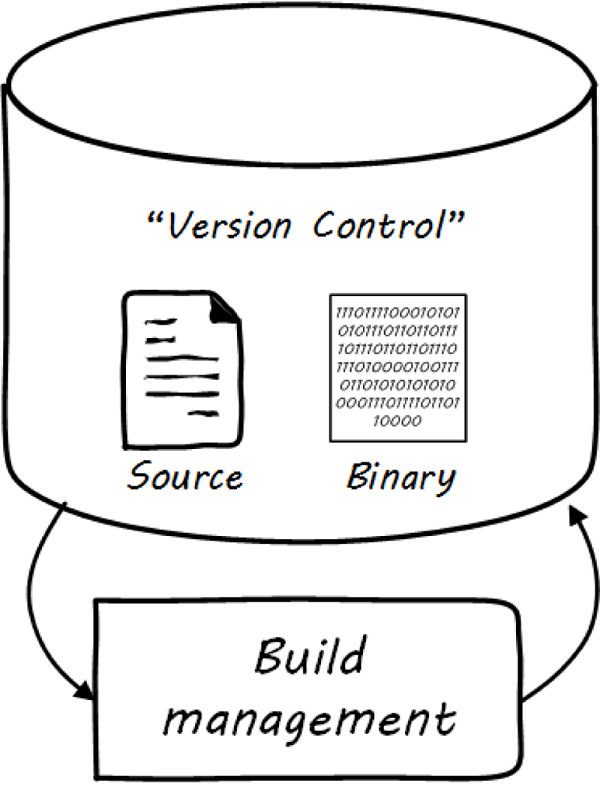
Package repositories also can serve as a proxy to the external world of downloadable software. That is, they are a cache, an intermediate store of the software provided by various external or “upstream” sources. For example, developers may be told to download the approved Ruby on Rails version from the local package repository, rather than going to get the latest version, which may not be suitable for the environment.
Package repositories furthermore are used to enable collaboration between teams working on large systems. Teams can check in their built components into the package repository for other teams to download. This is more efficient than everyone always building all parts of the application from the source repository.
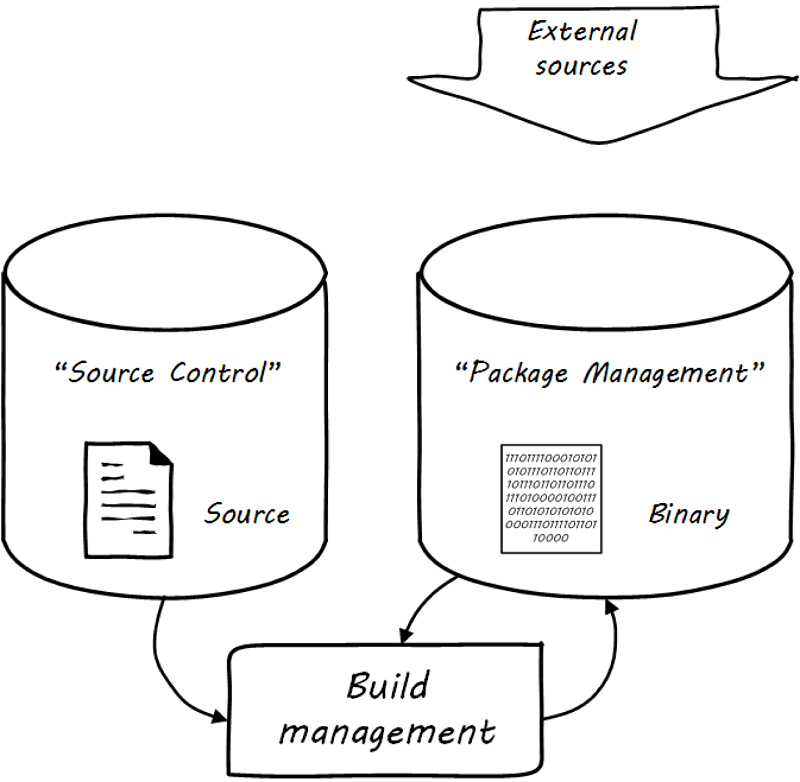
The boundary between source and package is not hard and fast, however. We sometimes sees binary files in source repositories, such as images used in an application. Also, when interpreted languages (such as JavaScript™) are “packaged”, they still appear in the package as text files, perhaps compressed or otherwise incorporated into some larger containing structure.
While in earlier times, systems would be compiled for the target platform (e.g., compiled in a development environment, and then re-compiled for subsequent environments such as quality assurance and production) the trend today is decisively towards immutability. With the standardization brought by container-based architecture, current preference increasingly is to compile once into an immutable artifact that is deployed unchanged to all environments, with any necessary differences managed by environment-specific configuration such as source-managed text artifacts and shared secrets repositories.
6.1.2.4.6. Deployment Management
Version control is an important part of the overall concept of configuration management. But configuration management also covers the matter of how artifacts under version control are combined with other IT resources (such as virtual machines) to deliver services. Figure 27, “Configuration Management and its Components” elaborates on Figure 22, “Types of Version Control” to depict the relationships.
Resources in version control in general are not yet active in any value-adding sense. In order for them to deliver experiences, they must be combined with computing resources: servers (physical or virtual), storage, networking, and the rest, whether owned by the organization or leased as cloud services. The process of doing so is called deployment. Version control manages the state of the artifacts; meanwhile, deployment management (as another configuration management practice) manages the combination of those artifacts with the needed resources for value delivery.
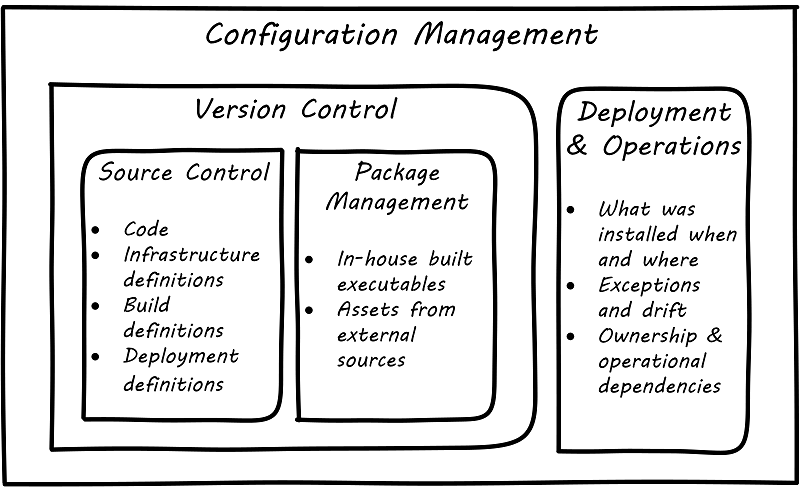
6.1.2.4.7. Imperative and Declarative Approaches
Before we turned to source control, we looked at a simple script that changed the configuration of a computer. It did so in an imperative fashion. Imperative and declarative are two important terms from computer science.
In an imperative approach, one tells the computer specifically how we want to accomplish a task; e.g.:
-
Create a directory
-
Create some files
-
Create another directory
-
Create more files
Many traditional programming languages take an imperative approach. A script such as our iac.sh example is executed line by line; i.e., it is imperative.
In configuring infrastructure, scripting is in general considered “imperative”, but state-of-the-art infrastructure automation frameworks are built using a “declarative”, policy-based approach, in which the object is to define the desired end state of the resource, not the steps needed to get there. With such an approach, instead of defining a set of steps, we simply define the proper configuration as a target, saying (in essence) that “this computer should always have a directory structure thus; do what you need to do to make it so and keep it this way”.
Declarative approaches are used to ensure that the proper versions of software are always present on a system and that configurations such as Internet ports and security settings do not vary from the intended specification.
This is a complex topic, and there are advantages and disadvantages to each approach [47].
Evidence of Notability
Andrew Clay Shafer, credited as one of the originators of DevOps, stated: "In software development, version control is the foundation of every other Agile technical practice. Without version control, there is no build, no test-driven development, no continuous integration" [14 p. 99]. It is one of the four foundational areas of Agile, according to the Agile Alliance [10].
Limitations
Older platforms and approaches relied on direct command line intervention and (in the 1990s and 2000s) on GUI-based configuration tools. Organizations still relying on these approaches may struggle to adopt the principles discussed here.
Competency Category "Configuration Management and Infrastructure as Code" Example Competencies
-
Develop a simple Infrastructure as Code definition for a configured server
-
Demonstrate the ability to install, configure, and use a source control tool
-
Demonstrate the ability to install, configure, and use a package manager
-
Develop a complex Infrastructure as Code definition for a cluster of servers, optionally including load balancing and failover
Related Topics
6.1.2.5. Securing Infrastructure
|
Note
|
Security as an enterprise capability is covered in Section 6.4.1, “Governance, Risk, Security, and Compliance”, as a form of applied risk management involving concepts of controls and assurance. But, securing infrastructure and applications must be a focus from the earliest stages of the digital product. |
This document recognizes the concept of securing infrastructure as critical to the practice of digital delivery:
-
Physical security
-
Networking issues
-
Core OS
-
Cloud issues
Description
Infrastructure security, whether for on-premises computing or for cloud services, is first and foremost a security architecture issue. Many existing security control frameworks are available that describe various categories of controls which can be used to secure infrastructure. These include ISO/IEC 27002:2013, NIST 800-53, Security Services Control Catalog (jointly developed by The Open Group and The SABSA® Institute), and the Center for Internet Security Controls Version 7. These are comprehensive sets of security controls spanning many domains of security. While these control frameworks predate cloud computing, most of the control categories affecting infrastructure security apply in cloud services as well. In addition, security practitioners tasked with securing infrastructure may benefit from reference security architectures such as the Open Enterprise Security Architecture (O-ESA) from The Open Group, which describes basic approaches to securing enterprise networks, including infrastructure.
The diagram below [1] depicts some broad categories of security control types:
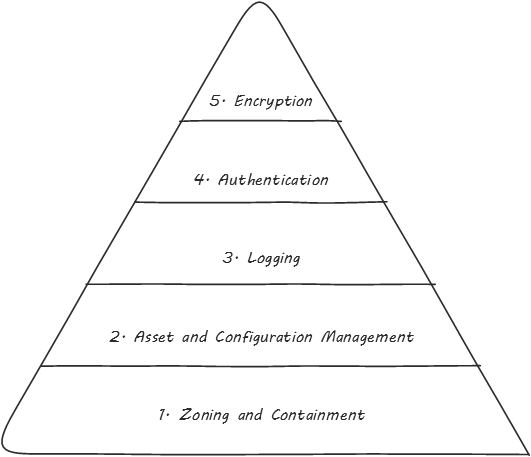
6.1.2.5.1. Common security practices
Since the advent of cloud computing, securing cloud infrastructure has been a key concern. Most of the security issues that exist in non-cloud environments exist in cloud services as well. In other words, access control, user authentication, vulnerability management, patching, securing network access, anti-malware capabilities, data loss prevention, encryption of data, and a host of other security controls that we deploy in on-premises computing require careful consideration in cloud services. The security concerns around cloud computing vary depending on whether the cloud service is SaaS, PaaS, or IaaS.
6.1.2.5.2. On premise versus Cloud security practices
There are also fundamental differences in security controls deployed in on-premises infrastructure (security controls may be physical or virtual), and those deployed in cloud infrastructure (which is purely virtual). These differences follow on from the shift brought by cloud computing. In on-premises computing, security architects and security solution providers had access to the physical computing networks, so physical security devices could be deployed in-line. The most common security design patterns leverage this physical access. In cloud services, there is no ability to insert security components which are physically in-line. This means that in cloud computing, we may have to utilize virtual security appliances, and virtual network segmentation solutions such as VLANs and Software-Defined Networks (SDNs) versus physical security approaches.
Another difference in securing physical versus cloud infrastructure arises in defining and implementing microsegmentation (small zones of access control). In physical networks, multiple hardware firewalls are required to achieve this. In cloud computing, VLANs and SDNs may be used to deliver equivalent capability, with some unique advantages (they are more manageable, at a lower capital expense).
In addition, the responsibility for securing cloud infrastructure varies considerably based upon the service model as well. While early focus on cloud security tended to focus on potential security concerns and gaps in security capabilities, the security community today generally acknowledges that while security concerns relating to cloud computing persist, there is also an opportunity for cloud services to “raise the bar”, improving upon baseline security for many customer organizations. Hybrid cloud computing combining public cloud services with private cloud infrastructure brings further complexity to infrastructure security.
Evidence of Notability
The need to secure computing infrastructure has been obvious and self-evident for decades, and has evolved alongside changes in popular computing paradigms, including the mainframe era, client/server computing, and now cloud computing. The need for specific, unique guidance relating to securing cloud services of various types emerged in 2009, when the Cloud Security Alliance (CSA) was first formed, and when they published Version 1 of their Security Guidance for Critical Areas of Focus in Cloud Computing. The CSA guidance is now on Version 4, and includes 14 different security domains.
Limitations
Organizations accustomed to deploying physical security capabilities on their own infrastructure may find it difficult to adapt to the challenges of securing cloud infrastructure in the various types cloud services. They may also have challenges adapting to the changes in responsibilities that are brought by the use of cloud services, where the Cloud Service Provider (CSP) is responsible for delivering many security capabilities, especially in SaaS services, and as a result the customer organization needs to specify needed security capabilities in Request for Proposals (RFPs). In addition, incident response management routines will require change.
Related Topics
6.1.3. Application Delivery
|
Note
|
Not all Digital Practitioners develop applications. As SaaS options expand, many practitioners will focus on acquiring, configuring, and operating them. However, the premise of this Competency Area is that all Digital Practitioners need to understand at least the basics of modern application delivery in order to effectively manage digital sourcing and operations. Understanding these basics will help the practitioner develop a sense of empathy for their vendors supplying digital services. |
Area Description
Based on the preceding competencies of digital value understanding and infrastructure, the practitioner can now start building.
IT systems that directly create value for non-technical users are usually called “applications”, or sometimes “services” or "service systems". As discussed in the Digital Fundamentals Competency Area, they enable value experiences in areas as diverse as consumer banking, entertainment and hospitality, and personal transportation. In fact, it is difficult to think of any aspect of modern life untouched by applications. (This overall trend is sometimes called Digital Transformation [298].)
Applications are built from software, the development of which is a core concern for any IT-centric product strategy. Software development is a well-established career, and a fast-moving field with new technologies, frameworks, and schools of thought emerging weekly, it seems. This Competency Area will cover applications and the software lifecycle, from requirements through construction, testing, building, and deployment of modern production environments. It also discusses earlier approaches to software development, the rise of the Agile movement, and its current manifestation in the practice of DevOps.
This document uses an engineering definition of “application”. To an electrical engineer, a toaster or a light bulb is an “application” of electricity (hence the term “appliance”). Similarly, a Customer Relationship Management (CRM) system, or a web video on-demand service, are “applications” of the digital infrastructure covered previously.
Without applications, computers would be merely a curiosity. Electronic computers were first “applied” to military needs for codebreaking and artillery calculations. After World War II, ex-military officers like Edmund Berkeley at Prudential realized computers' potential if “applied” to problems like insurance record-keeping [11]. At first, such systems required actual manual configuration or painstaking programming in complex, tedious, and unforgiving low-level programming languages. As the value of computers became obvious, investment was made in making programming easier through more powerful languages.
The history of software is well documented. Low-level languages (binary and assembler) were increasingly replaced by higher-level languages such as FORTRAN, COBOL, and C. Proprietary machine/language combinations were replaced by open standards and compilers that could take one kind of source code and build it for different hardware platforms. Many languages followed, such as Java, Visual Basic, and JavaScript. Sophisticated middleware was developed to enable ease of programming, communication across networks, and standardization of common functions.
Today, much development uses frameworks like Apache Struts, Spring, and Ruby on Rails, along with interpreted languages that take much of the friction out of building and testing code. But even today, the objective remains to create a binary executable file or files that computer hardware can “execute”; that is, turn into a computing-based value experience, mediated through devices such as workstations, laptops, smartphones, and their constituent components.
In the first decades of computing, any significant application of computing power to a new problem typically required its own infrastructure, often designed specifically for the problem. While awareness existed that computers, in theory, could be “general-purpose”, in practice, this was not so easy. Military/aerospace needs differed from corporate information systems, which differed from scientific and technical uses. And major new applications required new compute capacity.
The software and hardware needed to be specified in keeping with requirements, and acquiring it took lengthy negotiations and logistics and installation processes. Such a project from inception to production might take nine months (on the short side) to 18 or more months.
Hardware was dedicated and rarely re-used. Servers compatible with one system might have few other applications if they became surplus. In essence, this sort of effort had a strong component of systems engineering, as designing and optimizing the hardware component was a significant portion of the work.
Today, matters are quite different, and yet echoes of the older model persist. As mentioned, any compute workloads are going to incur economic cost. However, capacity is being used more efficiently and can be provisioned on-demand. Currently, it is a significant application indeed that merits its own systems engineering.
|
Note
|
To “provision” in an IT sense means to make the needed resources or services available for a particular purpose or consumer. |
Instead, a variety of mechanisms (as covered in the previous discussion of cloud systems) enable the sharing of compute capacity, the raw material of application development. The fungibility and agility of these mechanisms increase the velocity of creation and evolution of application software. For small and medium-sized applications, the overwhelming trend is to virtualize and run on commodity hardware and OSs. Even 15 years ago, non-trivial websites with database integration would be hosted by internal PaaS clusters at major enterprises (for example, Microsoft® ASP, COM+, and SQL server clusters could be managed as multi-tenant).
The general-purpose capabilities of virtualized public and private cloud today are robust. Assuming the organization has the financial capability to purchase computing capacity in anticipation of use, it can be instantly available when the need surfaces. Systems engineering at the hardware level is more and more independent of the application lifecycle; the trend is towards providing compute as a service, carefully specified in terms of performance, but not particular hardware.
Hardware physically dedicated to a single application is rarer, and even the largest engineered systems are more standardized so that they may one day benefit from cloud approaches. Application architectures have also become much more powerful. Interfaces (interaction points for applications to exchange information with each other, generally in an automated way) are increasingly standardized. Applications are designed to scale dynamically with the workload and are more stable and reliable than in years past.
6.1.3.1. Application Basics
Description
This section discusses the generally understood phases or stages of application development. With current trends towards Agile development, it is critical to understand that these phases are not intended as a prescriptive plan, nor is there any discussion of how long each should last. It is possible to spend months at a time on each phase, and it is possible to perform each phase in the course of a day. However, there remains a rough ordering of:
-
Understanding intended outcome
-
Analyzing and designing the "solution" that can support the outcome
-
Building the solution
-
Evaluating whether the solution supports the intended outcome (usually termed "testing")
-
Delivering or transitioning the solution into a state where it is delivering the intended outcome
This set of activities is sometimes called the "Software Development Lifecycle" (SDLC). These activities are supported by increasingly automated approaches which are documented in succeeding sections.
6.1.3.1.1. Documenting System Intent
The application or digital product development process starts with a concept of intended outcome.
In order to design and build a digital product, the Digital Practitioner needs to express what theory needs the product to do. The conceptual tool used to do this has historically been termed the Requirement. The literal word “Requirement” has fallen out of favor with the rise of Agile [217], and has a number of synonyms and variations:
-
Use-case
-
User story
-
Non-functional requirement
-
Epic
-
Architectural epic
-
Architectural requirement
While these may differ in terms of focus and scope, the basic concept is the same — the requirement, however named, expresses some outcome, intent, or constraint the system must fulfill. This intent calls for work to be performed.
Requirements management is classically taught using the "shall" format. For example, the system shall provide …, the system shall be capable of …, etc.
More recently, Agile-aligned teams sometimes prefer user story mapping [217]. Here is an example from [68]:
“As a shopper, I can select how I want items shipped based on the actual costs of shipping to my address so that I can make the best decision.”
The basic format is:
As a <type of user>, I want <goal>, so that <some value>.
The story concept is flexible and can be aggregated and decomposed in various ways, as we will discuss in Section 6.2.1, “Product Management”. Our interest here is in the basic stimulus for application development work that it represents.
6.1.3.1.2. Analysis and Design
The analysis and design of software-based systems itself employs a variety of techniques. Starting from the documented system intent, in general, the thought process will seek to answer questions such as:
-
Is it possible to support the intended outcome with a digital system?
-
What are the major data concepts and processing activities the proposed digital system will need to support?
-
What are the general attributes or major classifications of such a potential solution? Will it be a transactional system, an analytic system?
-
How do these major concepts decompose into finer-grained concepts, and how are these finer-grained concepts translated into executable artifacts such as source code and computable data structures?
A variety of tools and approaches may be used in analysis and design. Sometimes, the analysis and design is entirely internal to the person building the system. Sometimes, it may be sketched on paper or a whiteboard. There are a wide variety of more formalized approaches (process models, data models, systems models) used as these systems and organizations scale up; these will be discussed in future Competency Areas.
6.1.3.1.3. Construction
When an apparently feasible approach is determined, construction may commence. How formalized "apparently feasible" is depends greatly on the organization and scale of the system. "You start coding and I’ll go find out what the users want" is an old joke in IT development. It represents a long-standing pair of questions: Are we ready to start building? Are we engaged in excessive analysis - sometimes called "analysis paralysis"? Actually writing source code and executing it, preferably with knowledgeable stakeholders evaluating the results, provides unambiguous confirmation of whether a given approach is feasible.
Actual construction techniques will typically center around the creation of text files in specialized computing languages such as C++, Javascript, Java®, Ruby on Rails, or Python. These languages are the fundamental mechanisms for accessing the core digital infrastructure services of compute, transmission, and storage discussed previously. There is a vast variety of instructional material available on the syntax and appropriate techniques for using such languages.
6.1.3.1.4. Testing
Evaluating whether a developed system fulfills the intended outcome is generally called testing. There is a wide variety of testing types, such as:
-
Functional testing (does the system, or specific component of it, deliver the intended outcomes as specified in requirements?)
-
Integration testing (if the system is modularized, can modules interoperate as needed to fulfill the intended outcomes?)
-
Usability testing (can operators navigate the system intuitively, given training that makes economic sense? are there risks of operator error presented by system design choices?)
-
Performance testing (does the system scale to necessary volumes and speeds?)
-
Security testing (does the system resist unauthorized attempts to access or change it?)
Although testing is logically distinct from construction, in modern practices they are tightly integrated and automated, as will be discussed below.
6.1.3.1.5. Delivery
Finally, the system completes construction and testing activities - it must be made available (delivered or transitioned) into a state where it can fulfill its intended outcomes. This is sometimes called the state of "production", discussed below. Delivery may take two forms:
-
Moving installable "packages" of software to a location where users can install them directly on devices of their choice; this includes delivery media such as DVDs as well as network-accessible locations
-
Installing the software so that its benefits - its intended outcomes - are available "as a service" via networks; outcomes may be delivered via the interface of an application or "app" on a mobile phone or personal computer, a web page, an Application Programming Interface (API), or other behavior of devices responding to the programmed application (e.g., IoT)
Delivery is increasingly automated, as will be covered in the section on DevOps technical practices.
Evidence of Notability
The basic concepts of the "software lifecycle" as expressed here are broadly discussed in software engineering; e.g., [140, 276, 266].
Limitations
Application construction, including programming source code, is not necessary (in general) when consuming SaaS. Many companies prefer to avoid development as much as possible, relying on commercially available services. Such companies still may be pursuing a digital strategy in important regards.
Related Topics
6.1.3.2. Agile Software Development
Description
6.1.3.2.1. Waterfall Development
When a new analyst would join a large systems integrator Andersen Consulting (now Accenture) in 1998, they would be schooled in something called the Business Integration Method (BIM). The BIM was a classic expression of what is called “waterfall development".
What is waterfall development? It is a controversial question. Walker Royce, the original theorist who coined the term named it in order to critique it [241]. Military contracting and management consultancy practices, however, embraced it, as it provided an illusion of certainty. The fact that computer systems until recently included a substantial component of hardware systems engineering may also have contributed.
Waterfall development as a term has become associated with a number of practices. The original illustration was similar to Figure 29, “Waterfall Lifecycle” (similar to [241]):
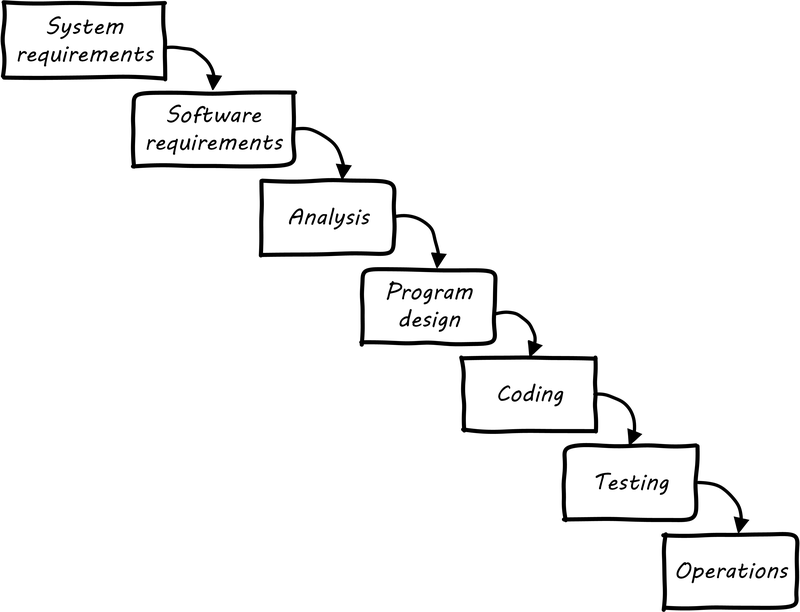
First, requirements need to be extensively captured and analyzed before the work of development can commence. So, the project team would develop enormous spreadsheets of requirements, spending weeks on making sure that they represented what “the customer” wanted. The objective was to get the customer’s signature. Any further alterations could be profitably billed as “change requests”.
The analysis phase was used to develop a more structured understanding of the requirements; e.g., conceptual and logical data models, process models, business rules, and so forth.
In the design phase, the actual technical platforms would be chosen; major subsystems determined with their connection points, initial capacity analysis (volumetrics) translated into system sizing, and so forth. (Perhaps hardware would not be ordered until this point, leading to issues with developers now being “ready”, but hardware not being available for weeks or months yet.)
Only after extensive requirements, analysis, and design would coding take place (implementation). Furthermore, there was a separation of duties between developers and testers. Developers would write code and testers would try to break it, filing bug reports to which the developers would then need to respond.
Another model sometimes encountered at this time was the V-model (see Figure 30, “V-Model”[2]). This was intended to better represent the various levels of abstraction operating in the systems delivery activity. Requirements operate at various levels, from high-level business intent through detailed specifications. It is all too possible that a system is “successfully” implemented at lower levels of specification, but fails to satisfy the original higher-level intent.
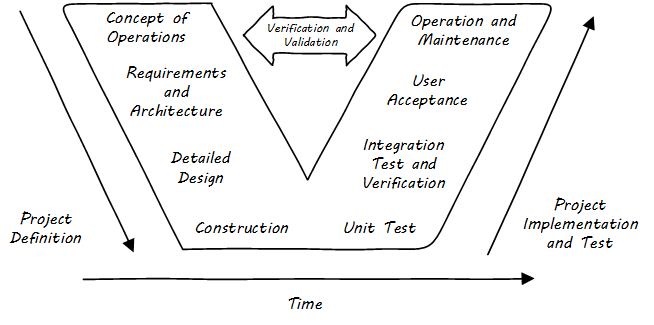
The failures of these approaches at scale are by now well known. Large distributed teams would wrestle with thousands of requirements. The customer would “sign off” on multiple large binders, with widely varying degrees of understanding of what they were agreeing to. Documentation became an end in itself and did not meet its objectives of ensuring continuity if staff turned over. The development team would design and build extensive product implementations without checking the results with customers. They would also defer testing that various component parts would effectively interoperate until the very end of the project, when the time came to assemble the whole system.
Failure after failure of this approach is apparent in the historical record [111]. Recognition of such failures, dating from the 1960s, led to the perception of a “software crisis”.
However, many large systems were effectively constructed and operated during the “waterfall years", and there are reasonable criticisms of the concept of a “software crisis” [39].
Successful development efforts existed back to the earliest days of computing (otherwise, there probably wouldn’t be computers, or at least not so many). Many of these successful efforts used prototypes and other means of building understanding and proving out approaches. But highly publicized failures continued, and a substantial movement against “waterfall” development started to take shape.
6.1.3.2.2. Origins and Practices of Agile Development
By the 1990s, a number of thought leaders in software development had noticed some common themes with what seemed to work and what didn’t. Kent Beck developed a methodology known as “eXtreme Programming” (XP) [24]. XP pioneered the concepts of iterative, fast-cycle development with ongoing stakeholder feedback, coupled with test-driven development, ongoing refactoring, pair programming, and other practices. (More on the specifics of these in the next section.)
Various authors assembled in 2001 and developed the Agile Manifesto [8], which further emphasized an emergent set of values and practices:
The Manifesto authors further stated:
Agile methodologists emphasize that software development is a learning process. In general, learning (and the value derived from it) is not complete until the system is functioning to some degree of capability. As such, methods that postpone the actual, integrated verification of the system increase risk. Alistair Cockburn visualizes risk as the gap between the ongoing expenditure of funds and the lag in demonstrating valuable learning (see Figure 31, “Waterfall Risk”, similar to [66]).
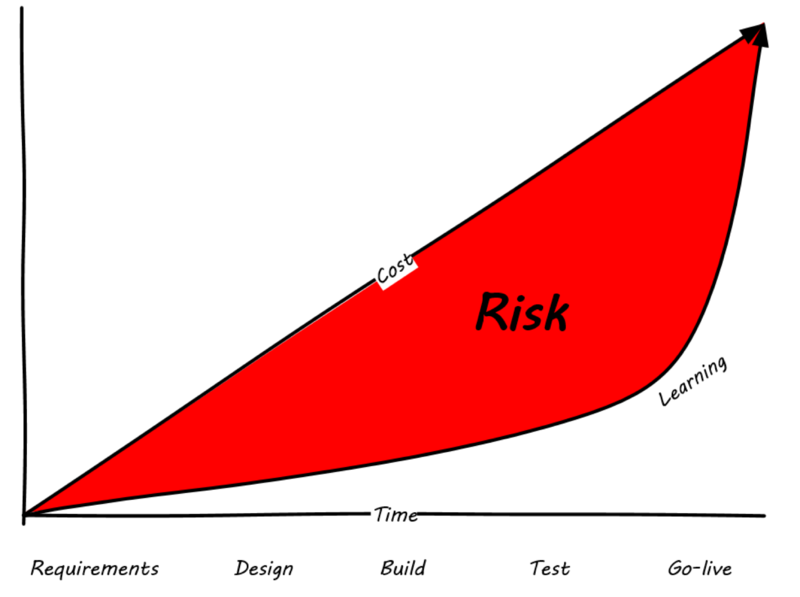
Because Agile approaches emphasize delivering smaller batches of complete functionality, this risk gap is minimized (see Figure 32, “Agile Risk”, similar to [66]).
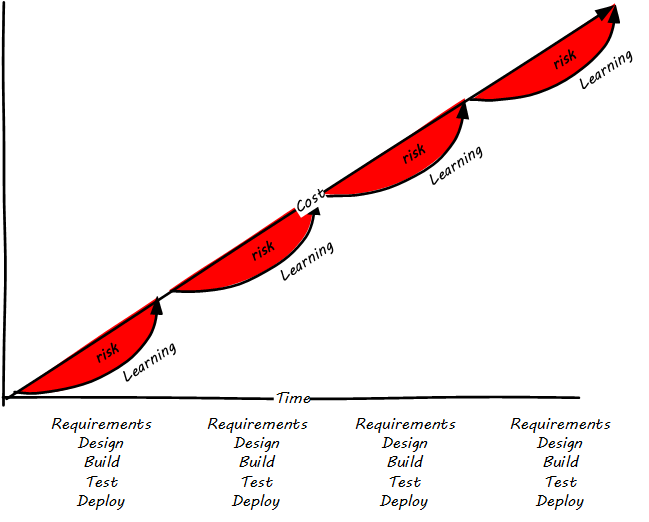
The Agile models for developing software aligned with the rise of cloud and web-scale IT. As new customer-facing sites like Flickr®, Amazon, Netflix, Etsy®, and Facebook scaled to massive proportions, it became increasingly clear that waterfall approaches were incompatible with their needs. Because these systems were directly user-facing, delivering monetized value in fast-moving competitive marketplaces, they required a degree of responsiveness previously not seen in “back-office” IT or military-aerospace domains (the major forms that large-scale system development had taken to date). We will talk more of product-centricity and the overall DevOps movement in the next section.
This new world did not think in terms of large requirements specifications. Capturing a requirement, analyzing and designing to it, implementing it, testing that implementation, and deploying the result to the end user for feedback became something that needed to happen at speed, with high repeatability. Requirements “backlogs” were (and are) never “done”, and increasingly were the subject of ongoing re-prioritization, without high-overhead project “change” barriers.
These user-facing, web-based systems integrate the SDLC tightly with operational concerns. The sheer size and complexity of these systems required much more incremental and iterative approaches to delivery, as the system can never be taken offline for the “next major release” to be installed. New functionality is moved rapidly in small chunks into a user-facing, operational status, as opposed to previous models where vendors would develop software on an annual or longer version cycle, to be packaged onto media for resale to distant customers.
Contract software development never gained favor in the Silicon Valley web-scale community; developers and operators are typically part of the same economic organization. So, it was possible to start breaking down the walls between “development” and “operations”, and that is just what happened.
Large-scale systems are complex and unpredictable. New features are never fully understood until they are deployed at scale to the real end user base. Therefore, large-scale web properties also started to “test in production” (more on this in the Operations Competency Area) in the sense that they would deploy new functionality to only some of their users. Rather than trying to increase testing to understand things before deployment better, these new firms accepted a seemingly higher-level of risk in exposing new functionality sooner. (Part of their belief is that it actually is lower risk because the impacts are never fully understood in any event.)
Evidence of Notability
See [174] for a thorough history of Agile and its antecedents. Agile is recognized as notable in leading industry and academic guidance [276, 140] and has a large, active, and highly visible community (see http://www.agilealliance.org). It is increasingly influential on non-software activities as well [234, 233].
Limitations
Agile development is not as relevant when packaged software is acquired. Such software has a more repeatable pattern of implementation, and more up-front planning may be appropriate.
Related Topics
6.1.3.3. DevOps Technical Practices
Description
Consider this inquiry by Mary and Tom Poppendieck:
The implicit goal is that the organization should be able to change and deploy one line of code, from idea to production in under an hour, and in fact, might want to do so on an ongoing basis. There is deep Lean/Agile theory behind this objective; a theory developed in reaction to the pattern of massive software failures that characterized IT in the first 50 years of its existence. (This document discusses systems theory, including the concept of feedback, in Context II and other aspects of Agile theory, including the ideas of Lean Product Development, in Contexts II and III.)
Achieving this goal is feasible but requires new approaches. Various practitioners have explored this problem, with great success. Key initial milestones included:
-
The establishment of “test-driven development” as a key best practice in creating software [24]
-
Duvall’s book Continuous Integration [92]
-
Allspaw & Hammonds’s seminal “10 Deploys a Day” presentation describing technical practices at Flickr [13]
-
Humble & Farley’s Continuous Delivery [136]
-
The publication of The Phoenix Project [165]
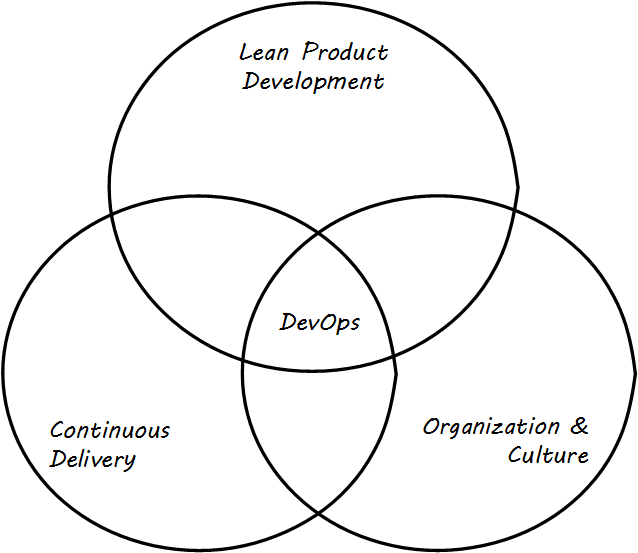
6.1.3.3.1. Defining DevOps
“DevOps” is a broad term, encompassing product management, continuous delivery, organization structure, team behaviors, and culture (see Figure 33, “DevOps Definition”). Some of these topics will not be covered until Contexts II and III in this document. At an execution level, the fundamental goal of moving smaller changes more quickly through the pipeline is a common theme. Other guiding principles include: “If it hurts, do it more frequently”. (This is in part a response to the poor practice, or antipattern, of deferring integration testing and deployment until those tasks are so big as to be unmanageable.) There is a great deal written on the topic of DevOps currently; the Humble/Farley book is recommended as an introduction. Let’s go into a little detail on some essential Agile/DevOps practices:
-
Test-driven development
-
Ongoing refactoring
-
Continuous integration
-
Continuous deployment
6.1.3.3.2. Continuous Delivery Pipeline
The infrastructure Competency Area suggests that the Digital Practitioner may need to select:
-
Development stack (language, framework, and associated enablers such as database and application server)
-
Cloud provider that supports the chosen stack
-
Version control
-
Deployment capability
The assumption is that the Digital Practitioner is going to start immediately with a continuous delivery pipeline.
What is meant by a continuous delivery pipeline? Figure 34, “A Simple Continuous Delivery Toolchain” presents a simplified, starting overview.
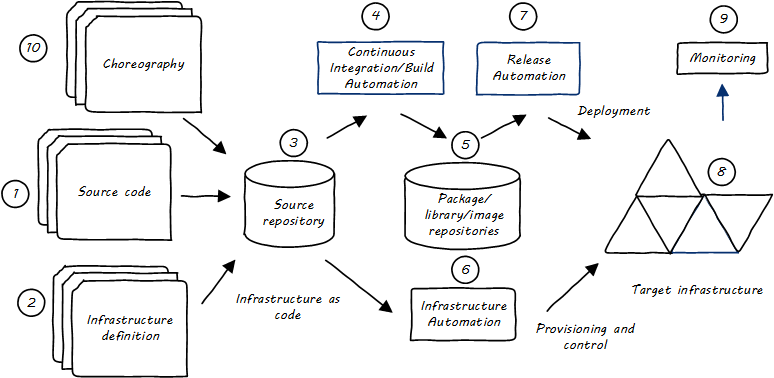
First, some potential for value is identified. It is refined through product management techniques into a feature — some specific set of functionality that when complete will enable the value proposition (i.e., as a moment of truth).
-
The feature is expressed as some set of IT work, today usually in small increments lasting between one and four weeks (this of course varies). Software development commences; e.g., the creation of Java components by developers who first write tests, and then write code that satisfies the test.
-
More or less simultaneously, the infrastructure configuration is also refined, also "as-code".
-
The source repository contains both functional and infrastructure artifacts (text-based).
-
When the repository detects the new “check-in”, it contacts the build choreography manager, which launches a dedicated environment to build and test the new code. The environment is configured using “Infrastructure as Code” techniques; in this way, it can be created automatically and quickly.
-
If the code passes all tests, the compiled and built binary executables may then be “checked in” to a package management repository.
-
Infrastructure choreography may be invoked at various points to provision and manage compute, storage, and networking resources (on-premise or cloud-based).
-
Release automation deploys immutable binary packages to target infrastructure.
-
Examples of such infrastructure may include quality assurance, user acceptance, and production environments.
-
The production system is monitored for availability and performance.
-
An emerging practice is to manage the end-to-end flow of all of the above activities as "choreography", providing comprehensive traceability of configuration and deployment activities across the pipeline.
6.1.3.3.3. Test Automation and Test-Driven Development
Testing software and systems is a critically important part of digital product development. The earliest concepts of waterfall development called for it explicitly, and “software tester” as a role and “software quality assurance” as a practice have long histories. Evolutionary approaches to software have a potential major issue with software testing:
As a consequence of the introduction of new bugs, program maintenance requires far more system testing per statement written than any other programming. Theoretically, after each fix one must run the entire bank of test cases previously run against the system, to ensure that it has not been damaged in an obscure way. In practice, such regression testing must indeed approximate this theoretical ideal, and it is very costly.
Mythical Man-Month
This issue was and is well known to thought leaders in Agile software development. The key response has been the concept of automated testing so that any change in the software can be immediately validated before more development along those lines continues. One pioneering tool was JUnit:
The reason JUnit is important … is that the presence of this tiny tool has been essential to a fundamental shift for many programmers. A shift where testing has moved to a front and central part of programming. People have advocated it before, but JUnit made it happen more than anything else.
http://martinfowler.com/books/meszaros.html
From the reality that regression testing was “very costly” (as stated by Brooks in the above quote), the emergence of tools like JUnit (coupled with increasing computer power and availability) changed the face of software development, allowing the ongoing evolution of software systems in ways not previously possible.
In test-driven development, the idea essence is to write code that tests itself, and in fact to write the test before writing any code. This is done through the creation of test harnesses and the tight association of tests with requirements. The logical culmination of test-driven development was expressed by Kent Beck in eXtreme Programming: write the test first [24]. Thus:
-
Given a “user story” (i.e., system intent), figure out a test that will demonstrate its successful implementation
-
Write this test using the established testing framework
-
Write the code that fulfills the test
6.1.3.3.4. Refactoring and technical debt
Test-driven development enables the next major practice, that of refactoring. Refactoring is how technical debt is addressed. What is technical debt? Technical debt is a term coined by Ward Cunningham and is now defined by Wikipedia as:
… the eventual consequences of poor system design, software architecture, or software development within a codebase. The debt can be thought of as work that needs to be done before a particular job can be considered complete or proper. If the debt is not repaid, then it will keep on accumulating interest, making it hard to implement changes later on … Analogous to monetary debt, technical debt is not necessarily a bad thing, and sometimes technical debt is required to move projects forward. [303]
Test-driven development ensures that the system’s functionality remains consistent, while refactoring provides a means to address technical debt as part of ongoing development activities. Prioritizing the relative investment of repaying technical debt versus developing new functionality will be examined in future sections.
Technical debt is covered further in here.
6.1.3.3.5. Continuous Integration
As systems engineering approaches transform to cloud and Infrastructure as Code, a large and increasing percentage of IT work takes the form of altering text files and tracking their versions. This was covered in the discussion of configuration management with artifacts such as scripts being created to drive the provisioning and configuring of computing resources. Approaches which encourage ongoing development and evolution are increasingly recognized as less risky since systems do not respond well to big “batches” of change. An important concept is that of “continuous integration”, popularized by Paul Duvall in his book of the same name [92].
In order to understand why continuous integration is important, it is necessary to discuss further the concept of source control and how it is employed in real-world settings. Imagine Mary has been working for some time with her partner Aparna in their startup (or on a small team) and they have three code modules (see Figure 35, “File B being Worked on by Two People”). Mary is writing the web front end (file A), Aparna is writing the administrative tools and reporting (file C), and they both partner on the data access layer (file B). The conflict, of course, arises on file B that they both need to work on. A and C are mostly independent of each other, but changes to any part of B can have an impact on both their modules.
If changes are frequently needed to B, and yet they cannot split it into logically separate modules, they have a problem; they cannot both work on the same file at the same time. They are each concerned that the other does not introduce changes into B that “break” the code in their own modules A and C.
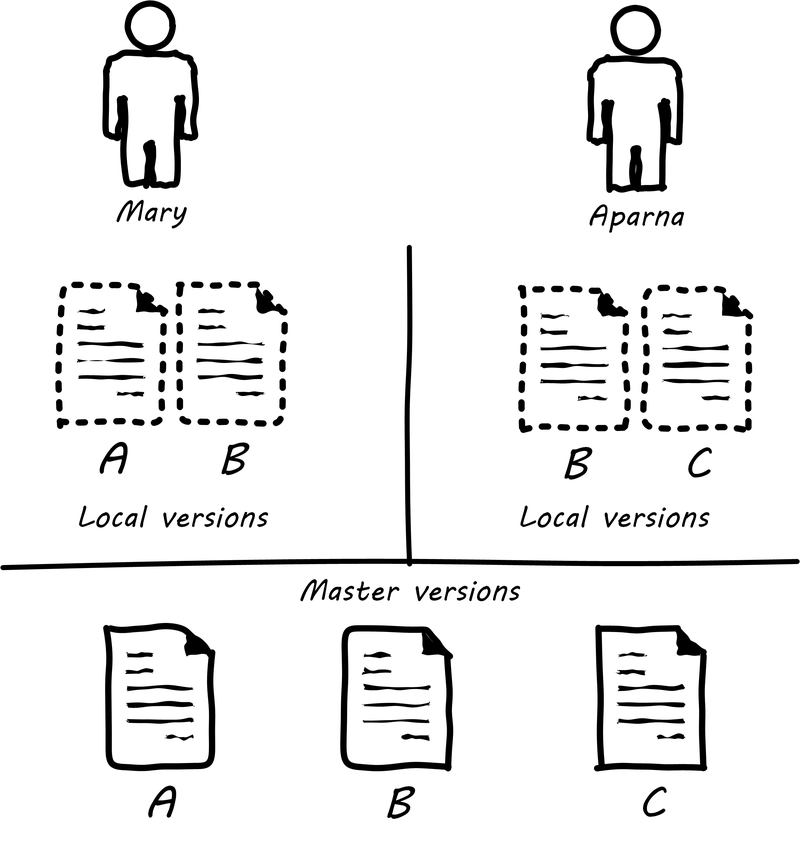
In smaller environments, or under older practices, perhaps there is no conflict, or perhaps they can agree to take turns. But even if they are taking turns, Mary still needs to test her code in A to make sure it has not been broken by changes Aparna made in B. And what if they really both need to work on B (see Figure 35, “File B being Worked on by Two People”) at the same time?
Given that they have version control in place, each of them works on a “local” copy of the file (see illustration “File B being worked on by two people”).
That way, they can move ahead on their local workstations. But when the time comes to combine both of their work, they may find themselves in “merge hell”. They may have chosen very different approaches to solving the same problem, and code may need massive revision to settle on one codebase. For example, in the accompanying illustration, Mary’s changes to B are represented by triangles and Aparna’s are represented by circles. They each had a local version on their workstation for far too long, without talking to each other.
The diagrams represent the changes graphically; of course, with real code, the different graphics represent different development approaches each person took. For example, Mary had certain needs for how errors were handled, while Aparna had different needs.
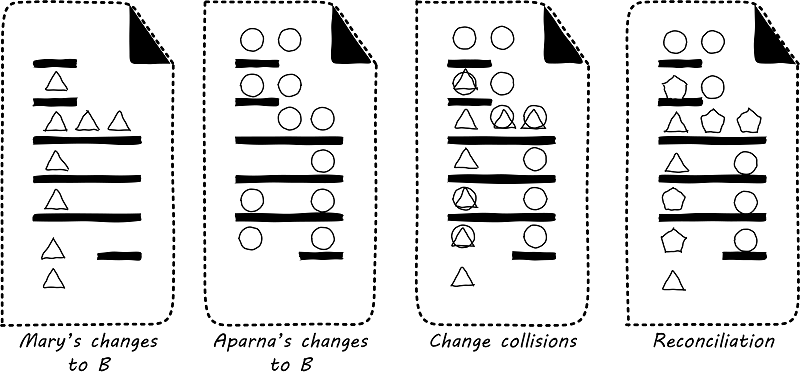
In Figure 36, “Merge Hell”, where triangles and circles overlap, Mary and Aparna painstakingly have to go through and put in a consolidated error handling approach, so that the code supports both of their needs. The problem, of course, is there are now three ways errors are being handled in the code. This is not good, but they did not have time to go back and fix all the cases. This is a classic example of technical debt.
Suppose instead that they had been checking in every day. They can identify the first collision quickly (see Figure 37, “Catching Errors Quickly is Valuable”), and have a conversation about what the best error handling approach is. This saves them both the rework of fixing the collisions, and the technical debt they might have otherwise accepted:
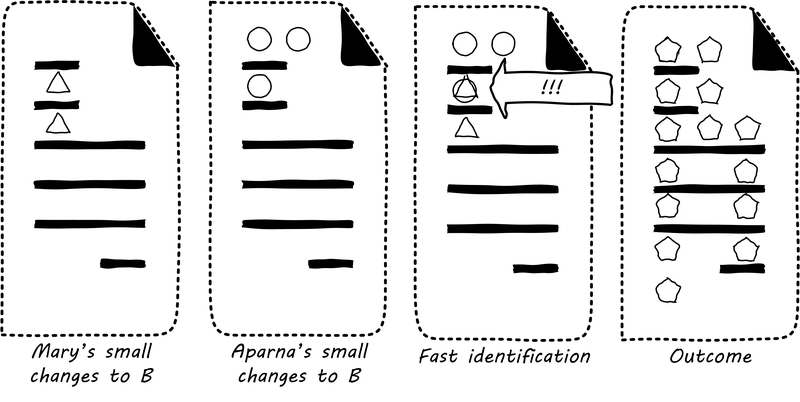
These problems have driven the evolution of software configuration management for decades. In previous methods, to develop a new release, the code would be copied into a very long-lived “branch” (a version of the code to receive independent enhancement). Ongoing “maintenance” fixes of the existing codebase would also continue, and the two codebases would inevitably diverge. Switching over to the “new” codebase might mean that once-fixed bugs (bugs that had been addressed by maintenance activities) would show up again, and, logically, this would not be acceptable. So, when the newer development was complete, it would need to be merged back into the older line of code, and this was rarely if ever easy (again, “merge hell”). In a worst-case scenario, the new development might have to be redone.
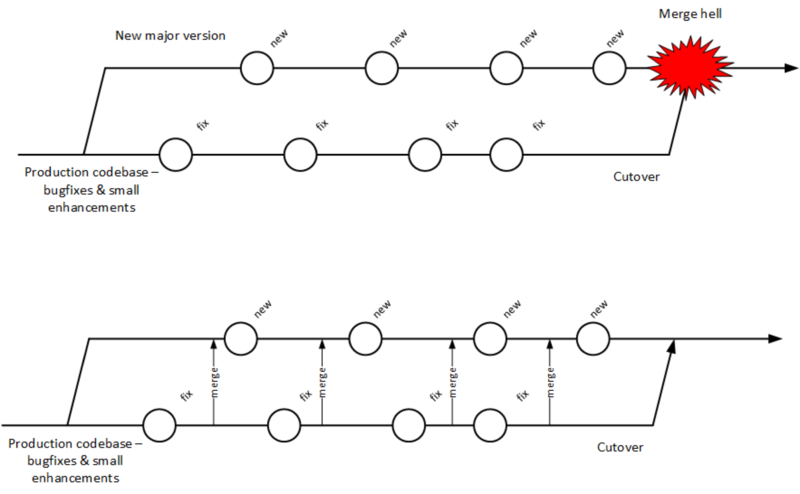
Enter continuous integration (see Figure 38, “Big Bang versus Continuous Integration”). As presented in [92] the key practices (note similarities to the pipeline discussion) include:
-
Developers run private builds including their automated tests before committing to source control
-
Developers check in to source control at least daily
-
Distributed version control systems such as git are especially popular, although older centralized products are starting to adopt some of their functionality
-
Integration builds happen several times a day or more on a separate, dedicated machine
-
-
100% of tests must pass for each build, and fixing failed builds is the highest priority
-
A package or similar executable artifact is produced for functional testing
-
A defined package repository exists as a definitive location for the build output
Rather than locking a file so that only one person can work on it at a time, it has been found that the best approach is to allow developers to actually make multiple copies of such a file or file set and work on them simultaneously.
This is the principle of continuous integration at work. If the developers are continually pulling each other’s work into their own working copies, and continually testing that nothing has broken, then distributed development can take place. So, for a developer, the day’s work might be as follows:
8 AM: check out files from master source repository to a local branch on the workstation. Because files are not committed unless they pass all tests, the code is clean. The developer selects or is assigned a user story (requirement) that they will now develop.
8:30 AM: The developer defines a test and starts developing the code to fulfill it.
10 AM: The developer is close to wrapping up the first requirement. They check the source repository. Their partner has checked in some new code, so they pull it down to their local repository. They run all the automated tests and nothing breaks, so all is good.
10:30 AM: They complete their first update of the day; it passes all tests on the local workstation. They commit it to the master repository. The master repository is continually monitored by the build server, which takes the code created and deploys it, along with all necessary configurations, to a dedicated build server (which might be just a virtual machine or transient container). All tests pass there (the test defined as indicating success for the module, as well as a host of older tests that are routinely run whenever the code is updated).
11:00 AM: Their partner pulls these changes into their working directory. Unfortunately, some changes made conflict with some work the partner is doing. They briefly consult and figure out a mutually-acceptable approach.
Controlling simultaneous changes to a common file is only one benefit of continuous integration. When software is developed by teams, even if each team has its own artifacts, the system often fails to “come together” for higher-order testing to confirm that all the parts are working correctly together. Discrepancies are often found in the interfaces between components; when component A calls component B, it may receive output it did not expect and processing halts. Continuous integration ensures that such issues are caught early.
6.1.3.3.6. Continuous Integration Choreography
DevOps and continuous delivery call for automating everything that can be automated. This goal led to the creation of continuous integration managers such as Hudson, Jenkins, Travis CI, and Bamboo. Build managers may control any or all of the following steps:
-
Detecting changes in version control repositories and building software in response
-
Alternately, building software on a fixed (e.g., nightly) schedule
-
Compiling source code and linking it to libraries
-
Executing automated tests
-
Combining compiled artifacts with other resources into installable packages
-
Registering new and updated packages in the package management repository, for deployment into downstream environments
-
In some cases, driving deployment into downstream environments, including production (this can be done directly by the build manager, or through the build manager sending a message to a deployment management tool)
Build managers play a critical, central role in the modern, automated pipeline and will likely be a center of attention for the new Digital Practitioner in their career.
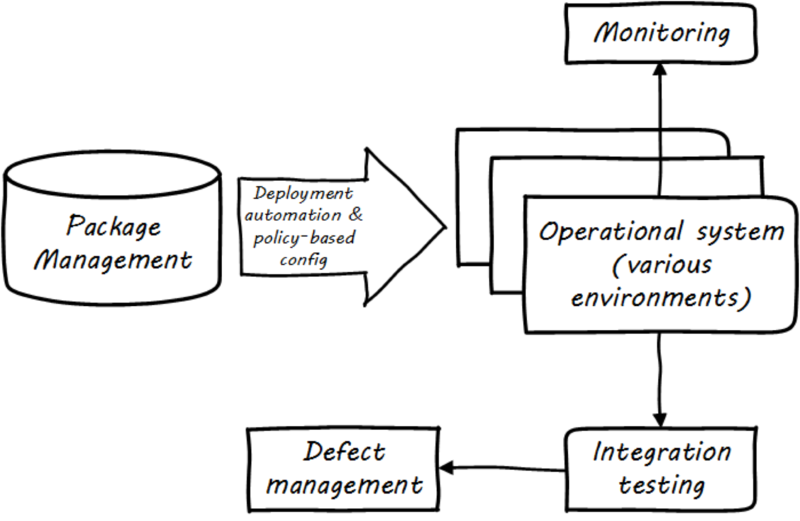
6.1.3.3.7. Continuous Delivery
Once the software is compiled and built, the executable files that can be installed and run operationally should be checked into a package manager. At that point, the last mile steps can be taken, and the now tested and built software can be deployed to pre-production or production environments (see Figure 39, “Deployment”). The software can undergo usability testing, load testing, integration testing, and so forth. Once those tests are passed, it can be deployed to production.
Moving new code into production has always been a risky procedure. Changing a running system always entails some uncertainty. However, the practice of Infrastructure as Code coupled with increased virtualization has reduced the risk. Often, a rolling release strategy is employed so that code is deployed to small sets of servers while other servers continue to service the load. This requires careful design to allow the new and old code to co-exist at least for a brief time.
This is important so that the versions of software used in production are well controlled and consistent. The package manager can then be associated with some kind of deploy tool that keeps track of what versions are associated with which infrastructure.
Timing varies by organization. Some strive for true “continuous deployment”, in which the new code flows seamlessly from developer commit through build, test, package, and deploy. Others put gates in between the developer and check-in to mainline, or source-to-build, or package-to-deploy so that some human governance remains in the toolchain. This document goes into more detail on these topics in the section on digital operations.
6.1.3.3.8. The Concept of “Release”
Release management, and the concept of a “release”, are among the most important and widely seen concepts in all forms of digital management. Regardless of working in a cutting-edge Agile startup with two people or one of the largest banks with a portfolio of thousands of applications, releases for coordination and communication are likely being used.
What is a “release?”. Betz defined it this way in other work: “A significant evolution in an IT service, often based on new systems development, coordinated with affected services and stakeholders”. Release management’s role is to “Coordinate the assembly of IT functionality into a coherent whole and deliver this package into a state in which the customer is getting the intended value” [31 p. 68, 31 p. 119].
Evidence of Notability
DevOps has not yet been fully recognized for its importance in academic guidance or peer-reviewed literature. Nevertheless, its influence is broad and notable. Significant publications include [92, 13, 136, 165, 166, 99]. Large international conferences (notably the DevOps Enterprise Summit, https://itrevolution.com/devops_events/) are dedicated to the event, as well as many smaller local events under the banner of "DevOpsDays" (https://www.devopsdays.org/).
Limitations
Like Agile, DevOps is primarily valuable in the development of new digital functionality. It has less relevance for organizations that choose to purchase digital functionality; e.g., as SaaS offerings. While it includes the fragment "Ops", it does not cover the full range of operational topics covered in the Operations Competency Area, such as help desk and field services.
Related Topics
6.1.3.4. APIs, Microservices, and Cloud-Native
This document has now covered modern infrastructure, including container-based infrastructure available via Cloud providers, and application development from waterfall, through Agile, and on to DevOps. The industry term for the culmination of all of these trends is "cloud-native". The Cloud Native Computing Foundation (CNCF) defines "cloud-native" as follows:
While this document does not cover specific programming languages or techniques, there are leading practices for building modern applications that are notable and should be understood by all Digital Practitioners. In software construction a programming language and execution environment must be chosen, but this choice is only the start. Innumerable design choices are required in structuring software, and the quality of these choices will affect the software’s ultimate success and value.
Early computer programs tended to be "monolithic"; that is, they were often built as one massive set of logic and their internal structure might be very complex and hard to understand. (In fact, considerable research has been performed on the limitations of human comprehension when faced with software systems of high complexity.) Monolithic programs also did not lend themselves to re-use, and therefore the same logic might need to be written over and over again. The use of "functions" and re-usable "libraries" became commonplace, so that developers were not continuously rewriting the same thing.
Two of the most critical concepts in software design are coupling and cohesion. In one of the earliest discussions of coupling, Ed Yourdon states:
"Coupling [is] the probability that in coding, debugging, or modifying one module, a programmer will have to take into account something about another module. If two modules are highly coupled, then there is a high probability that a programmer trying to modify one of them will have to make a change to the other. Clearly, total systems cost will be strongly influenced by the degree of coupling between modules." [312]
This is not merely a technical concern; as Yourdon implies, highly-coupled designs will result in higher system costs.
Cohesion is the opposite idea: that a given module should do one thing and do it well. Software engineers have been taught to develop highly-cohesive, loosely-coupled systems since at least the early 1970s, and these ideas continue to underlie the most modern trends in digital systems delivery. The latest evolution is the concept of cloud-native systems, which achieve these ideals through APIs, microservices, and container-based infrastructure.
6.1.3.4.1. Application Programming Interfaces
Three smaller software modules may be able to do the job of one monolithic program; however, those three modules must then communicate in some form. There are a variety of ways that this can occur; for example, communication may be via a shared data store. The preferred approach, however, is that communication occur over APIs.
An API is the public entry point in and out of a softwre component. It can be understood as a sort of contract; it represents an expectation that if you send a message or signal in a precisely specified format to the API, you will receive a specific, expected response. For example, your online banking service can be seen as having an API. You send it your name, password, and an indication that you want your account balance, and it will return your account balance. In pseudocode, the API might look like:
GetAccountBalance(user_name, password, account_number) returns amount
The modern digital world runs on APIs; they are pervasive throughout digital interactions. They operate at different levels of the digital stack; your bank balance request might be transmitted by HTTP, which is a lower-level set of APIs for all web traffic. At scale, APIs present a challenge of management: how do you cope with thousands of APIs? Mechanisms must be created for standardizing, inventorying, reporting on status, and many other concerns.
6.1.3.4.2. Microservices
APIs can be accessed in various ways. For example, a developer might incorporate a "library" in a program she is writing. The library (for example, one that supports trigonometric functions) has a set of APIs, that are only available if the library is compiled into the developer’s program and is only accessible if the program itself is running. Also, in this case, the API is dependent on the programming language; in general, a C++ library will not work in Java.
Increasingly, however, with the rise of the Internet, programs are continually "up" and running, and available to any other program that can communicate over the Internet, or an organization’s internal network. Programs that are continually run in this fashion, with attention to their availability and performance, are called "services". In some cases, a program or service may only be available as a visual web page. While this is still an API of a sort, many other services are available as direct API access; no web browser is required. Rather, services are accessed through protocols such as REST over HTTP. In this manner, a program written in Java can easily communicate with one written in C++. This idea is not new; many organizations started moving towards Service-Oriented Architecture (SOA) in the late 1990s and early 2000s. More recently, discussions of SOA have largely been replaced by attention to microservices.
Sam Newman, in Building Microservices, provides the following definition: "Microservices are small, autonomous services that work together" [208]. Breaking this down:
-
"Small" is a relative term
Newman endorses an heuristic that it should be possible to rewrite the microservice in two weeks. Matthew Skelton and Manuel Pais in Team Topologies [262] emphasize that optimally-sized teams have an upper bound to their "cognitive capacity"; this is also a pragmatic limit on the size of an effective microservice.
-
"Autonomous" means "loosely coupled" as discussed above, both in terms of the developer’s perspective as well as the operational perspective
Each microservice runs independently, typically on its own virtual machines or containers.
Newman observes that microservices provide the following benefits:
-
Technology flexibility: as noted above, microservices may be written in any language and yet communicate over common protocols and be managed in a common framework
-
Resilience: failure of one microservice should not result in failure of an entire digital product
-
Scalability: monolithic applications typically must be scaled as one unit; with microservices, just those units under higher load can have additional capacity allocated
-
Ease of deployment: because microservices are small and loosely coupled, change is less risky; see The DevOps Consensus as Systems Thinking
-
Organizational alignment: large, monolithic codebases often encounter issues with unclear ownership; microservices are typically each owned by one team, although this is not a hard and fast rule
-
Composability: microservices can be combined and re-combined ("mashed up") in endless variations, both within and across organizational boundaries; an excellent example of this is Google Maps, which is widely used by many other vendors (e.g. Airbnb™, Lyft™) when location information is needed
-
Replaceability: because they are loosely coupled and defined by their APIs, a microservice can be replaced without replacing the rest of a broader system; for example, a microservice written in Java can be replaced by one written in Go, as long as the APIs remain identical
6.1.3.4.3. The Twelve-Factor App
A number of good practices are associated with microservices success. One notable representation of this broader set of concerns is known as the "twelve-factor app" (see https://12factor.net/). To quote [302]:
Excerpts from the Twelve-Factor App Website
-
Codebase
One codebase tracked in revision control, many deploys
A copy of the revision tracking database is known as a code repository, often shortened to code repo or just repo … A codebase is any single repo (in a centralized revision control system like Subversion), or any set of repos who share a root commit (in a decentralized revision control system like Git). Twelve-factor principles imply continuous integration.
-
Dependencies
Explicitly declare and isolate dependencies
A twelve-factor app never relies on implicit existence of system-wide packages. It declares all dependencies, completely and exactly, via a dependency declaration manifest. Furthermore, it uses a dependency isolation tool during execution to ensure that no implicit dependencies “leak in” from the surrounding system. The full and explicit dependency specification is applied uniformly to both production and development.
-
Configuration management
Store config in the environment
An app’s config is everything that is likely to vary between deploys (staging, production, developer environments, etc.). Apps sometimes store config as constants in the code. This is a violation of twelve-factor, which requires strict separation of config from code. Config varies substantially across deploys, code does not. Typical configuration values include server or hostnames, database names and locations, and (critically) authentication and authorization information (e.g., usernames and passwords, or private/public keys).
-
Backing services
Treat backing services as attached resources
A backing service [aka a resource] is any service the app consumes over the network as part of its normal operation. Examples include data stores (such as MySQL or CouchDB®), messaging/queueing systems (such as RabbitMQ® or Beanstalkd), SMTP services for outbound email (such as Postfix), and caching systems (such as Memcached).
In addition to these locally-managed services, the app may also have services provided and managed by third parties. The code for a twelve-factor app makes no distinction between local and third-party services. To the app, both are attached resources, accessed via a URL or other locator/credentials stored in the config. A deploy of the twelve-factor app should be able to swap out a local MySQL database with one managed by a third party - such as Amazon Relational Database Service (Amazon RDS) - without any changes to the app’s code … only the resource handle in the config needs to change.
-
Build, release, run
Strictly separate build and run stages
A codebase is transformed into a (non-development) deploy through three [strictly separated] stages: The build stage is a transform which converts a code repo into an executable bundle known as a build. Using a version of the code at a commit specified by the deployment process, the build stage fetches vendors' dependencies and compiles binaries and assets … The release stage takes the build produced by the build stage and combines it with the deploy’s current config. The resulting release contains both the build and the config and is ready for immediate execution in the execution environment … The run stage (also known as “runtime”) runs the app in the execution environment, by launching some set of the app’s processes against a selected release.
-
Processes
Execute the app as one or more stateless processes
Twelve-factor processes are stateless and share nothing. Any data that needs to persist must be stored in a stateful backing service, typically a database … The memory space or file system of the process can be used as a brief, single-transaction cache. For example, downloading a large file, operating on it, and storing the results of the operation in the database. The twelve-factor app never assumes that anything cached in memory or on disk will be available on a future request or job – with many processes of each type running, chances are high that a future request will be served by a different process.
-
Port binding
Export services via port binding
Web apps are sometimes executed inside a web server container. For example, PHP apps might run as a module inside Apache® HTTPD, or Java apps might run inside Tomcat … The twelve-factor app is completely self-contained and does not rely on runtime injection of a web server into the execution environment to create a web-facing service. The web app exports HTTP as a service by binding to a port, and listening to requests coming in on that port … In a local development environment, the developer visits a service URL like http://localhost:5000/ to access the service exported by their app. In deployment, a routing layer handles routing requests from a public-facing hostname to the port-bound web processes.
-
Concurrency
Scale out via the process model
Any computer program, once run, is represented by one or more processes. Web apps have taken a variety of process-execution forms. For example, PHP processes run as child processes of Apache, started on demand as needed by request volume. Java processes take the opposite approach, with the Java Virtual Machine (JVM) providing one massive [process] that reserves a large block of system resources (CPU and memory) on startup, with concurrency managed internally via threads. In both cases, the running process(es) are only minimally visible to the developers of the app … In the twelve-factor app, processes are a first-class citizen. Processes in the twelve-factor app take strong cues from the UNIX process model for running service daemons. Using this model, the developer can architect their app to handle diverse workloads by assigning each type of work to a process type. For example, HTTP requests may be handled by a web process, and long-running background tasks handled by a worker process.
-
Disposability
Maximize robustness with fast startup and graceful shutdown
The twelve-factor app’s processes are disposable, meaning they can be started or stopped at a moment’s notice. This facilitates fast elastic scaling, rapid deployment of code or config changes, and robustness of production deploys … Processes should strive to minimize startup time. Ideally, a process takes a few seconds from the time the launch command is executed until the process is up and ready to receive requests or jobs … Processes shut down gracefully when they receive a SIGTERM signal from the process manager. For a web process, graceful shutdown is achieved by ceasing to listen on the service port (thereby refusing any new requests), allowing any current requests to finish, and then exiting … For a worker process, graceful shutdown is achieved by returning the current job to the work queue … Processes should also be robust against sudden death … A twelve-factor app is architected to handle unexpected, non-graceful terminations.
-
Dev/prod parity
Keep development, staging, and production as similar as possible
Historically, there have been substantial gaps between development (a developer making live edits to a local deploy of the app) and production (a running deploy of the app accessed by end users). These gaps manifest in three areas … The time gap: A developer may work on code that takes days, weeks, or even months to go into production … The personnel gap: Developers write code, operations engineers deploy it … The tools gap: Developers may be using a stack like NGINX™, SQLite, and OS X, while the production deploy uses Apache, MySQL, and Linux … The twelve-factor app is designed for continuous deployment by keeping [these gaps] between development and production small.
Traditional app Twelve-factor app Time between deploys
Weeks
Hours
Code authors versus code deployers
Different people
Same people
Dev versus production environments
Divergent
As similar as possible
-
Logs
Logs are the stream of aggregated, time-ordered events collected from the output streams of all running processes and backing services. Logs in their raw form are typically a text format with one event per line (though backtraces from exceptions may span multiple lines). Logs have no fixed beginning or end, but flow continuously as long as the app is operating … A twelve-factor app never concerns itself with routing or storage of its output stream … Instead, each running process writes its event stream, unbuffered, to stdout. During local development, the developer will view this stream in the foreground of their terminal to observe the app’s behavior … In staging or production deploys, each process’ stream will be captured by the execution environment, collated together with all other streams from the app, and routed to one or more final destinations for viewing and long-term archival.
-
Admin processes
The process formation is the array of processes that are used to do the app’s regular business (such as handling web requests) as it runs. Separately, developers will often wish to do one-off administrative or maintenance tasks for the app, such as:
-
Running database migrations …
-
Running a console … to run arbitrary code or inspect the app’s models against the live database …
-
Running one-time scripts committed into the app’s repo …
One-off admin processes should be run in an identical environment as the regular long-running processes of the app. They run against a release, using the same codebase and config as any process run against that release. Admin code must ship with application code to avoid synchronization issues.
-
It is strongly recommended that the reader review the unabridged set of guidelines at 12Factor.net.
Evidence of Notability
Cloud-native approaches are at the time of publication receiving enormous industry attention. Kubecon (the leading conference of the CNCF) attracts wide interest, and all major cloud providers and many smaller firms participate in the ecosystem. All major cloud providers and scores of smaller firms participate in the CNCF ecosystem.
Limitations
Trillions of dollars of IT investment have been made in older architectures: bare-metal computing, tightly-coupled systems, stateful applications, and every imaginable permutation of not following guidance such as the twelve-factor methodology. The Digital Practitioner should be prepared to encounter this messy real world.
Related Topics
6.1.3.5. Securing Applications and Digital Products
Description
Application security includes a broad range of specialized areas, including secure software design and development, threat modeling, vulnerability assessment, penetration testing, and the impact of security on DevOps (and vice versa). As with other aspects of security, the move to cloud computing brings some changes to application security. The CSA guidance on cloud security specifically addresses application security considerations in cloud environments in domain 10 of their latest cloud security guidance.
An important element of application security is Secure Software Development Lifecycle (SSDLC), an approach toward developing software in a secure manner. Numerous frameworks and resources are available to follow, including from Microsoft (Security Development Lifecycle), NIST (NIST SP 800-64 Rev. 2), ISO/IEC (ISO/IEC 27034-1:2011), and the Open Web Application Security Project (OWASP Top Ten). In addition, information resources available from MITRE including Common Weaknesses Enumeration (CWE) and Common Vulnerability and Exposures (CVE) are helpful to development teams striving to develop secure code.
A basic approach to secure design and development will include these phases: Training – Define – Design – Develop – Test.[3] A component of an SSDLC is threat modeling. Good resources on threat modeling are available from Microsoft and from The Open Group.
It is worth noting that the move to cloud computing affects all aspects of an SSDLC, because cloud services abstract various computing resources, and there are automation approaches used in cloud services that fundamentally change the ways in which software is developed, tested, and deployed in cloud services versus in on-premises computing. In addition, there are significant differences in the degree of visibility and control that is provided to the customer, including availability of system logs at various points in the computing stack.
Application security will also include secure deployment, encompassing code review, unit, regression, and functional testing, and static and dynamic application security testing.
Other key aspects of application security include vulnerability assessment and penetration testing. Both have differences in cloud versus on-premises, as a customer’s ability to perform vulnerability scans and penetration tests may be restricted by contract by the CSP, and there may be technical issues relating to the type of cloud service, single versus multi-tenancy of the application, and so on.
Evidence of Notability
To be added in a future version.
Limitations
To be added in a future version.
Related Topics
-
Open Enterprise Security Architecture (O-ESA) (The Open Group)
-
Security Considerations in the System Development Life Cycle (NIST)
-
Security Guidance for Critical Areas of Focus in Cloud Computing (CSA)
-
Application Security - Part 1: Overview and Concepts, ISO/IEC27034-1:2011 (ISO/IEC)
-
https://cwe.mitre.org/, Common Weaknesses Enumeration, Common Vulnerability, and Exposures (MITRE)
6.1.4. Context I Conclusion
Preparing for the state transition to team.
6.1.4.1. Architectural View
The DPBoK contexts can be represented as subsets of The Open Group IT4IT Reference Architecture ([278]). The IT4IT Reference Architecture is fully elaborated to support the largest digital delivery organizations, and includes components that are critical from the earliest days of an organization’s evolution. A proposed implementation order for IT4IT functional components is mapped onto the DPBoK Standard at the end of each context.
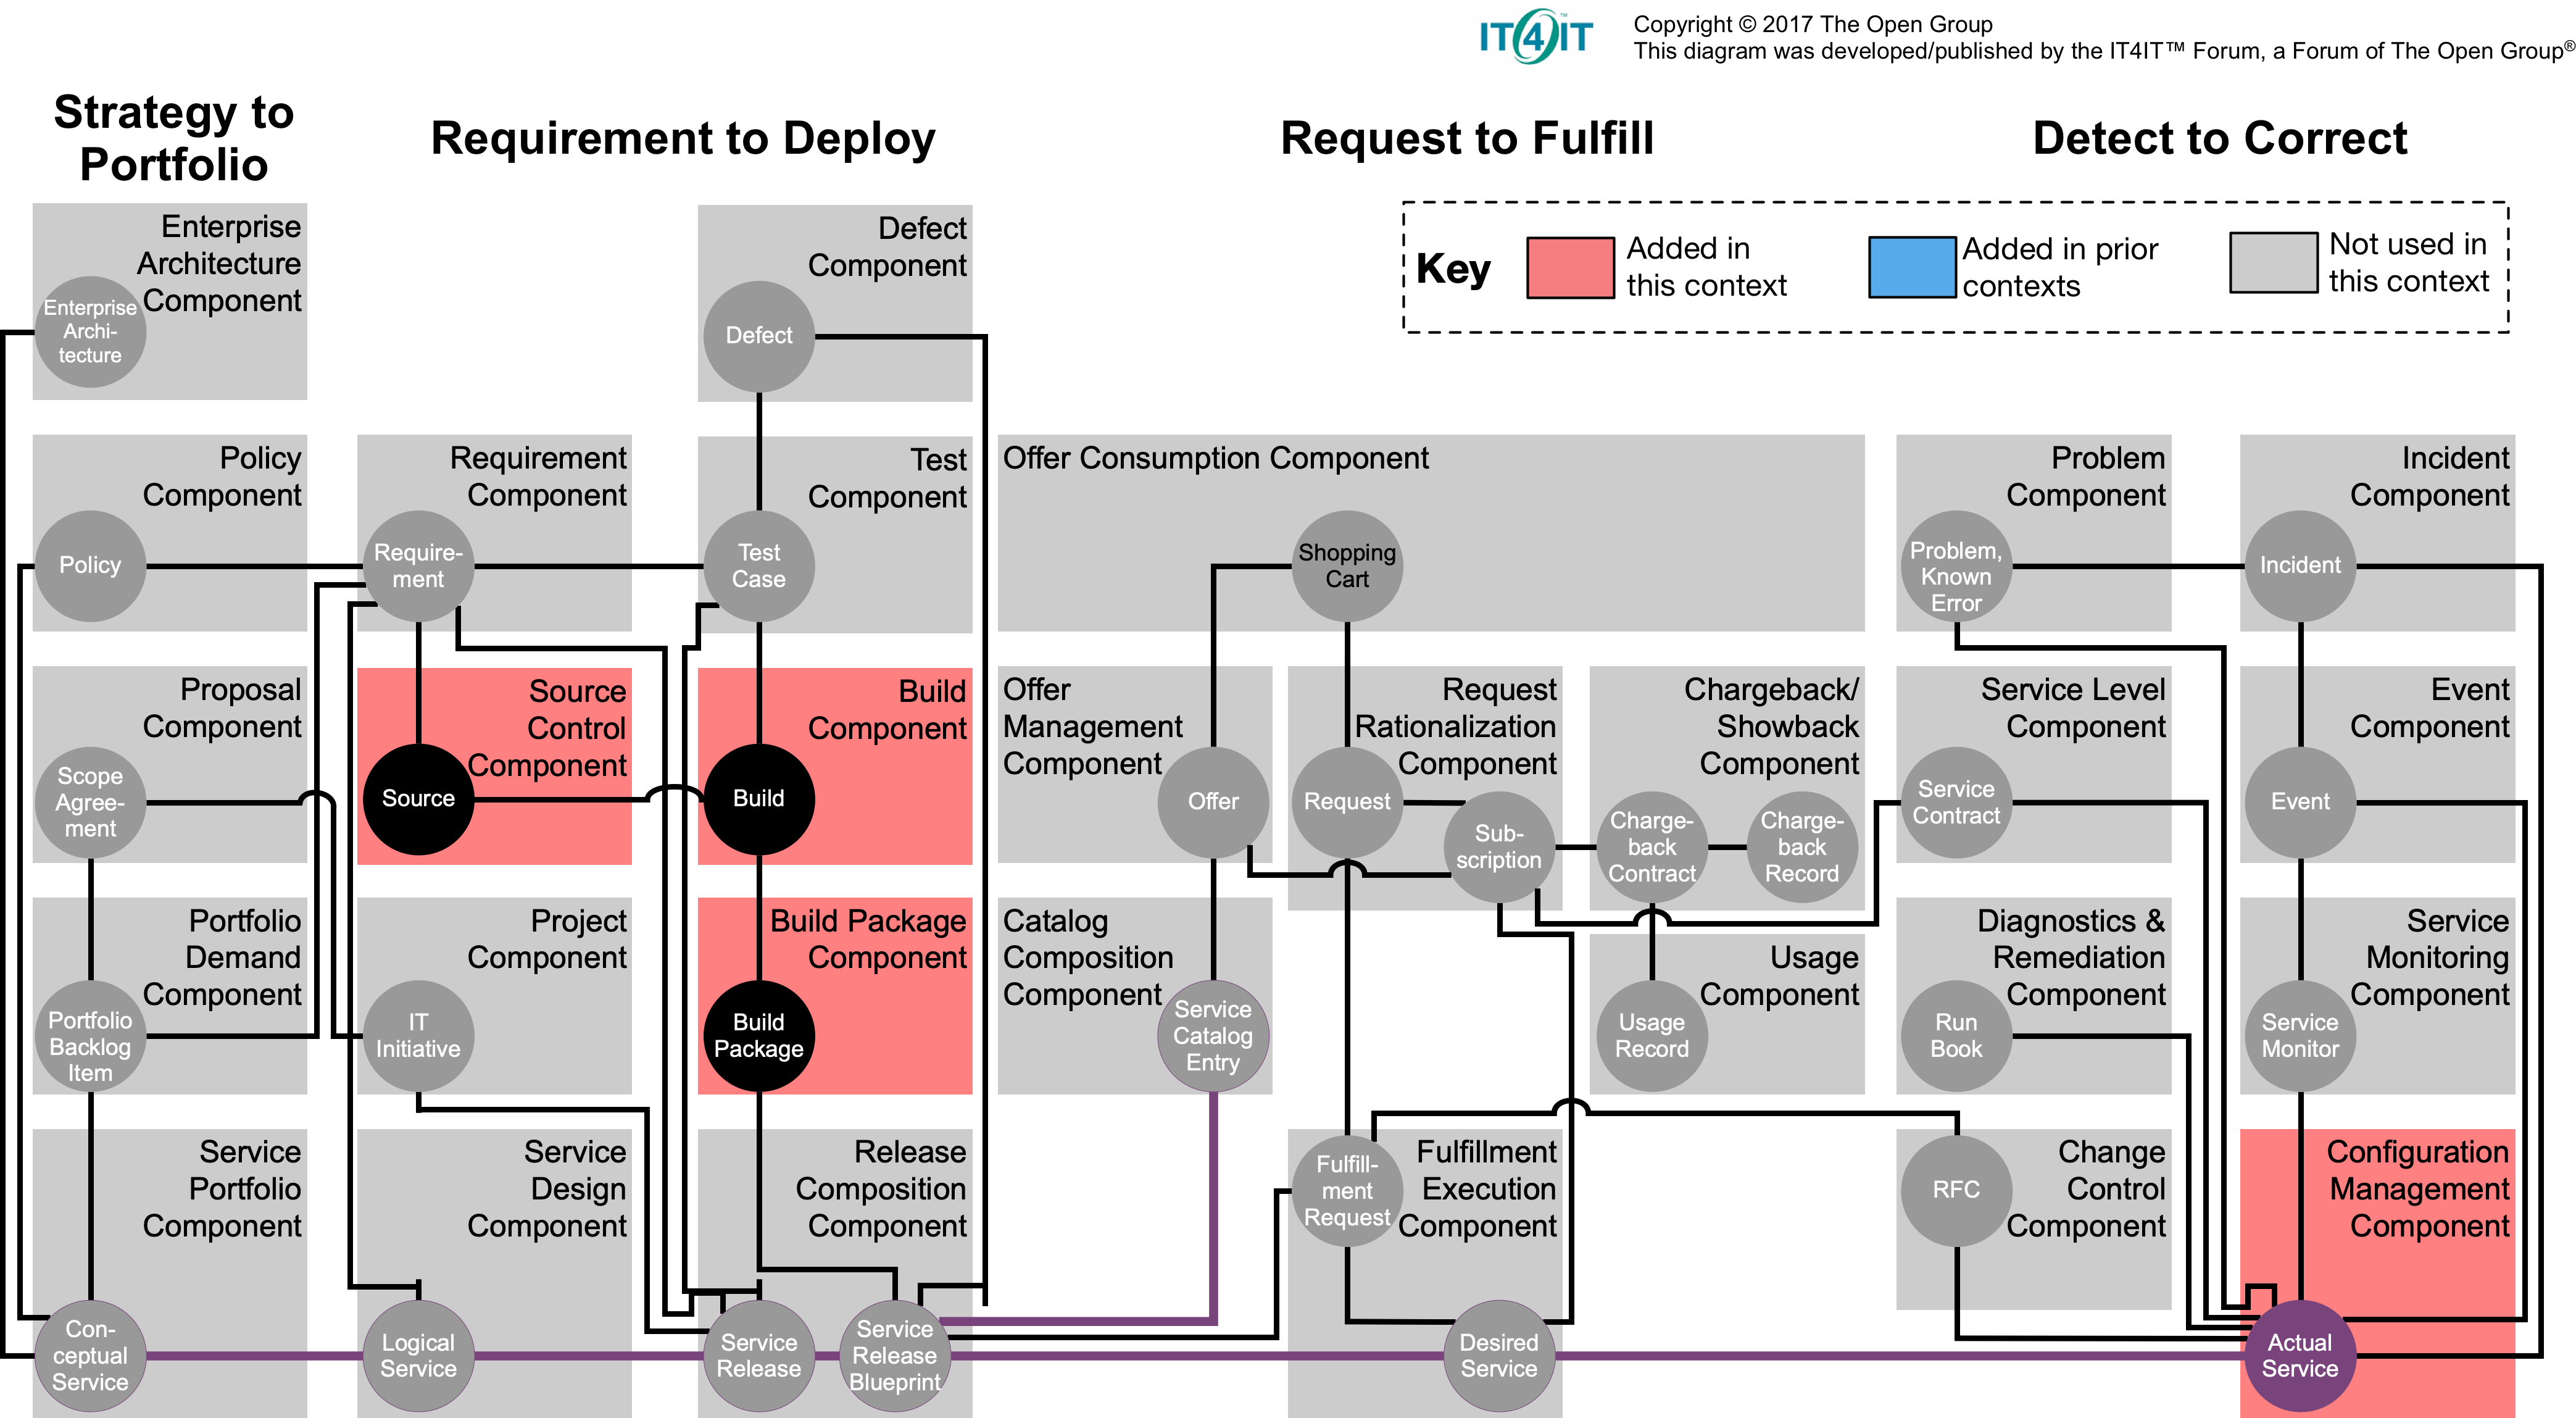
In this first context, the automation requirements are minimal but present. The ability to track the state of the digital service across a rudimentary build/run pipeline is essential from the earliest efforts.
The digital nucleus should implement:
-
Source Control Component
-
Build Component
-
Build Package Component
-
Configuration Management Component
There is some ambiguity in the terminology, in that Source Control and Package Management are both forms of Configuration Management in an abstract sense. However, neither of them covers deployment to operational systems; additional capability is required for that.
Context I "Architectural View" Learning Objectives
-
Identify the IT4IT components suitable for Context I
Related Topics
6.2. Context II: Team
Context Description
The hypothetical startup or product prototype has met with some success, and is now supported by a team. (If the founder was based in an enterprise, they have been promoted to team lead.) The team has a single mission and a cohesive identity, but still does not need a lot of overhead to get the job done.
Even with a few new people comes the need to more clearly establish product direction, so people are building the right thing. The team is all in the same location, and can still communicate informally, but there is enough going on that it needs a more organized approach to getting work done.
Things are getting larger and more complex. The product has a significant user base, and the founder is increasingly out meeting with users, customers, and investors. As a result, she isn’t in the room with the product team as much any more; in fact, she just named someone to be “product owner”. Finally, the product is not valuable if people cannot understand how best to use it, or if it is not running and the right people can’t get to it.
The practices and approaches established at the team level are critical to the higher levels of scale discussed in Contexts III and IV. Context II focuses on small, cross-functional, outcome-oriented teams, covering product management, work management, shared mental models, visualization, and systems monitoring. It covers collaboration and customer intimacy, and the need to limit work-in-process, and blameless cultures where people are safe to fail and learn. All of these are critical foundations for future growth; scaling success starts with building a strong team level.
Competency Area: Product Management
The original product developer is spending more time with investors and customers, and maintaining alignment around the original product vision is becoming more challenging as they are pulled in various directions. They need some means of keeping the momentum here. The concept of “product management” represents a rich set of ideas for managing the team’s efforts at this stage.
Competency Area: Work Management
Even with a small team of five people (let alone eight or nine), it is too easy for balls to get dropped as work moves between key contributors. The team probably doesn’t need a complex software-based process management tool yet, but it does need some way of managing work-in-process. More generally, work takes many forms and exists as a concept at different scales.
One of the most important aspects of DevOps and Agile is "systems thinking", and even a small team building one digital product can be viewed as a system. The term "information system" has a long history, but what is a "system"? What is feedback? There is a rich body of knowledge describing these topics.
Competency Area: Operations Management
Since Section 6.1.3, “Application Delivery”, application developers have been running the product and even answering the occasional phone call from customers. The team is now big enough that it starts to become more specialized. Dedicated support staff answer phone calls, and even if the team rotates operational responsibilities across developers, they are a distinct kind of “interrupt-driven” work that is not compatible with heads-down, focused software development. Complex digital systems are fragile and tend to fail; how you learn (or don’t) from those failures is a critical question. The learnings gained from scaling systems in fact become a new source of demand on your product teams' development time.
6.2.1. Product Management
Area Description
As a company or team grows, how does it ensure that newcomers share the same vision that inspired the organization’s creation? This is the goal of product management as a formalized practice.
Product strategy was largely tacit in Context I. The founder or individual used product management and product discovery practices, and may well be familiar with the ideas here, but the assumption is that they did not explicitly formalize their approach to them. Now the team needs a more prescriptive and consistent approach to discovering, defining, designing, communicating, and executing a product vision.
This Competency Area defines and discusses product management, and distinguishes it from project and process management. It covers how product teams are formed and what practices and attitudes should be established quickly.
Product management has various schools of thought and practices, including Gothelf’s Lean UX, Scrum, and more specific techniques for product “discovery”. The concepts of design and design thinking are important philosophical foundations.
6.2.1.1. Product Management Basics
Description
Before work, before operations, there must be a vision of the product. A preliminary vision may exist, but now as the organization grows, the Digital Practitioner needs to consider further how they will sustain that vision and establish an ongoing capability for realizing it. Like many other topics in this document, product management is a significant field in and of itself.
Historically, product management has not been a major theme in enterprise IT management. IT systems started by serving narrow purposes, often “back-office” functions such as accounting or materials planning. Mostly, such systems were managed as projects assembled on a temporary basis, resulting in the creation of a system to be “thrown over the wall” to operations. Product management, on the other hand, is concerned with the entire lifecycle. The product manager (or owner, in Scrum terms) cares about the vision, its execution, the market reaction to the vision (even if an internal market), the health, care, and feeding of the product, and the product’s eventual sunset or replacement.
In the enterprise IT world, “third-party” vendors (e.g., IBM®) providing the back-office systems had product management approaches, but these were external to the IT operations. Nor were IT-based product companies as numerous 40 years ago as they are today; as noted in the section on Digital Transformation, the digital component of modern products continues to increase to the point where it is often not clear whether a product is “IT” or not.
Reacting to market feedback and adapting product direction is an essential role of the product owner. In the older model, feedback was often unwelcome, as the project manager typically was committed to the open-loop dead reckoning of the project plan and changing scope or direction was seen as a failure, more often than not.
Now, it is accepted that systems evolve, perhaps in unexpected directions. Rapidly testing, failing fast, learning, and pivoting direction are all part of the lexicon, at least for market-facing IT-based products. And even back-office IT systems with better understood scope are being managed more as systems (or products) with lifecycles, as opposed to transient projects. (See the Amazon discussion, below.)
6.2.1.1.1. Defining Product Management
In order to define product management, the product first needs to be defined. Previously, it was established that products are goods, services, or some combination, with some feature that provides value to some consumer. BusinessDictionary.com defines it as follows:
[A Product is] A good, idea, method, information, object, or service created as a result of a process and serves a need or satisfies a want. It has a combination of tangible and intangible attributes (benefits, features, functions, uses) that a seller offers a buyer for purchase. For example, a seller of a toothbrush offers the physical product and also the idea that the consumer will be improving the health of their teeth. A good or service [must] closely meet the requirements of a particular market and yield enough profit to justify its continued existence.
Product management, according to the same source, is:
The organizational structure within a business that manages the development, marketing, and sale of a product or set of products throughout the product lifecycle. It encompasses the broad set of activities required to get the product to market and to support it thereafter.
Product management in the general sense often reports to the Chief Marketing Officer (CMO). It represents the fundamental strategy of the firm, in terms of its value proposition and viability. The product needs to reflect the enterprise’s strategy for creating and maintaining customers.
Product strategy for internally-facing products is usually not defined by the enterprise CMO. If it is a back-office product, then “business within a business” thinking may be appropriate. (Even the payroll system run by IT for human resources is a “product”, in this view.) In such cases, there still is a need for someone to function as an “internal CMO” to the external “customers".
With Digital Transformation, all kinds of products have increasing amounts of “IT” in them. This means that an understanding of IT, and ready access to any needed IT specialty skills, is increasingly important to the general field of product management. Product management includes R&D, which means that there is considerable uncertainty. This is of course also true of IT systems development.
Perhaps the most important aspect of product design is focusing on the user, and what they need. The concept of outcome is key. This is easier said than done. The general problem area is considered marketing, a core business school topic. Entire books have been written about the various tools and techniques for doing this, from focus groups to ethnographic analysis.
However, Marty Cagan recommends distinguishing product management from product marketing. He defines the two as follows:
The product manager is responsible for defining — in detail — the product to be built and validating that product with real customers and users. The product marketing person is responsible for telling the world about that product, including positioning, messaging and pricing, managing the product launch, providing tools for the sales channel to market and sell the product, and for leading key programs such as online marketing and influencer marketing programs [53 pp. 10-11].
Criticisms of overly marketing-driven approaches are discussed below.
6.2.1.1.2. Process, Project, and Product Management
In the remainder of this document, we will continually encounter three major topics:
-
Product Management (this Competency Area)
-
Process Management (covered in Section 6.3.1, “Coordination and Process”)
-
Project Management (covered in Section 6.3.1, “Coordination and Process” and Section 6.3.2, “Investment and Portfolio”)
They have an important commonality: all of them are concepts for driving results across organizations. Here are some of the key differences between process, project, and product management in the context of digital services and systems:
| Process | Project | Product |
|---|---|---|
Task-oriented |
Deliverable-oriented |
Outcome-oriented |
Repeatable with a high degree of certainty |
Executable with a medium degree of certainty |
Significant component of R&D, less certain of outcome — empirical approaches required |
Fixed time duration, relatively brief (weeks/months) |
Limited time duration, often scoped to a year or less |
No specific time duration; lasts as long as there is a need |
Fixed in form, no changes usually tolerated |
Difficult to change scope or direction, unless specifically set up to accommodate |
Must accommodate market feedback and directional change |
Used to deliver service value and operate system (the “Ops” in DevOps) |
Often concerned with system design and construction, but typically not with operation (the “Dev” in DevOps) |
Includes service concept and system design, construction, operations, and retirement (both “Dev” and “Ops”) |
Process owners are concerned with adherence and continuous improvement of the process; otherwise can be narrow in perspective |
Project managers are trained in resource and timeline management, dependencies, and scheduling; they are not typically incented to adopt a long-term perspective |
Product managers need to have project management skills as well as understanding market dynamics, feedback, building long-term organizational capability |
Resource availability and fungibility is assumed |
Resources are specifically planned for, but their commitment is temporary (team is “brought to the work”) |
Resources are assigned long-term to the product (work is “brought to the team”) |
The above distinctions are deliberately exaggerated, and there are of course exceptions (short projects, processes that take years). However, it is in the friction between these perspectives we see some of the major problems in modern IT management. For example, an activity which may be a one-time task or a repeatable process results in some work product - perhaps an artifact (see Figure 41, “Activities Create Work Products”).

The consumer or stakeholder of that work product might be a project manager.
Project management includes concern for both the activities and the resources (people, assets, software) required to produce some deliverable (see Figure 42, “Projects Create Deliverables with Resources and Activities”).
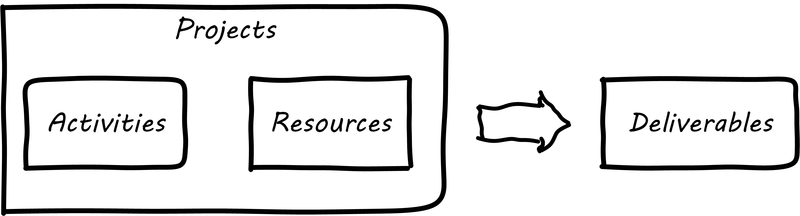
The consumer of that deliverable might be a product manager. Product management includes concern for projects and their deliverables, and their ultimate outcomes, either in the external market or internally (see Figure 43, “Product Management may Use Projects”).
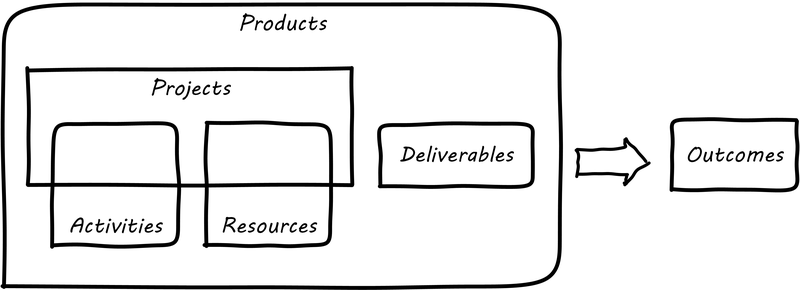
Notice that product management may directly access activities and resources. In fact, earlier-stage companies often do not formalize project management (see Figure 44, “Product Management Sometimes does not Use Projects”).
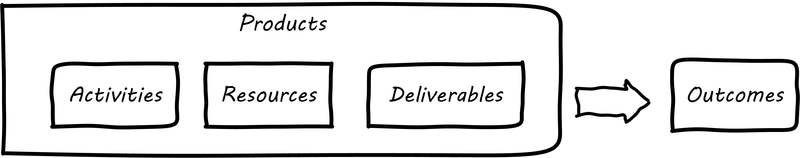
In our scenario, you are now on a tight-knit, collaborative team. You should think in terms of developing and sustaining a product. However, projects still exist, and sometimes you may find yourself on a team that is funded and operated on that basis. You also will encounter the concept of “process” even on a single team; more on that in Section 6.2.2, “Work Management”. We will go further into projects and process management in Context III.
6.2.1.1.3. Productization as a Strategy at Amazon
Amazon (the online retailer) is an important influence in the modern trend towards product-centric IT management. First, all Amazon teams were told to assume that the functionality being built might at some point be offered to external customers [3].
Second, a widely reported practice at Amazon.com is the limitation of product teams to between five and eight people, the number that can be fed by “two pizzas” (depending on how hungry they are) [110]. It has long been recognized in software and IT management that larger teams do not necessarily result in higher productivity. The best known statement of this is "Brooks' Law” from The Mythical Man-Month, that “adding people to a late project will make it later” [42].
The reasons for “Brooks' Law” have been studied and analyzed (see, for example, [183, 59]) but in general, it is due to the increased communication overhead of expanded teams. Product design work (of which software development is one form) is creative and highly dependent on tacit knowledge, interpersonal interactions, organizational culture, and other “soft” factors. Products, especially those with a significant IT component, can be understood as socio-technical systems, often complex. This means that small changes to their components or interactions can have major effects on their overall behavior and value.
This, in turn, means that newcomers to a product development organization can have a profound impact on the product. Getting them “up to speed” with the culture, mental models, and tacit assumptions of the existing team can be challenging and rarely is simple. And the bigger the team, the bigger the problem. The net result of these two practices at Amazon (and now General Electric and many other companies) is the creation of multiple nimble services that are decoupled from each other, constructed and supported by teams appropriately sized for optimal high-value interactions.
Finally, Amazon founder Jeff Bezos mandated that all software development should be service-oriented. That means that some form of standard API was required for all applications to communicate with each other. Amazon’s practices are a clear expression of cloud-native development.
Evidence of Notability
Product management has a dedicated professional association, the Product Development and Management Association (www.pdma.org.) Notable authors include Steve Blank, Marty Cagan, and Jeff Gothelf. The topic as a whole is closely related to the general topic of R&D. There are many meetups, conferences, and other events held under various banners such as Agile development.
Limitations
Product management tends to assume the existence of a market, and customers whose reaction is unpredictable. This is not always the case in digital systems. Sometimes, digital artifacts and capabilities have greater constraints, and must follow established specifications.
Related Topics
6.2.1.2. Product Discovery
Description
Now that we have discussed the overall concept of product management and why it is important, and how product teams are formed, we can turn more specifically to the topics of product discovery and product design (see Section 6.2.1.3, “Product Design”). We have previously discussed the overall digital business context, as a startup founder might think of the problem. But the process of discovery continues as the product idea is refined, new business problems are identified, and solutions (such as specific feature ideas) are designed and tested for outcomes.
|
Note
|
This guidance favors the idea that products are “discovered” as well as "designed”. |
The presence of a section entitled “product discovery” in this document is a departure from other IT management textbooks. “Traditional” models of IT delivery focus on projects and deliverables, concepts we touched on previously but that we will not explore in depth until later in the document. However, the idea of “product discovery” within the large company is receiving more and more attention. Even large companies benefit when products are developed with tight-knit teams using fast feedback.
For our discussion here, the challenge with the ideas of projects and deliverables is that they represent approaches that are more open-loop, or at least delayed in feedback. Design processes do not perform well when feedback is delayed. System intent, captured as a user story or requirement, is only a hypothesis until tested via implementation and user confirmation.
6.2.1.2.1. Formalizing Product Discovery
In Section 6.1.3, “Application Delivery”, we needed to consider the means for describing system intent. Even as a bare-bones startup, some formalization of this starts to emerge, at the very least in the form of test-driven development (see Figure 45, “Product Discovery Tacit”).
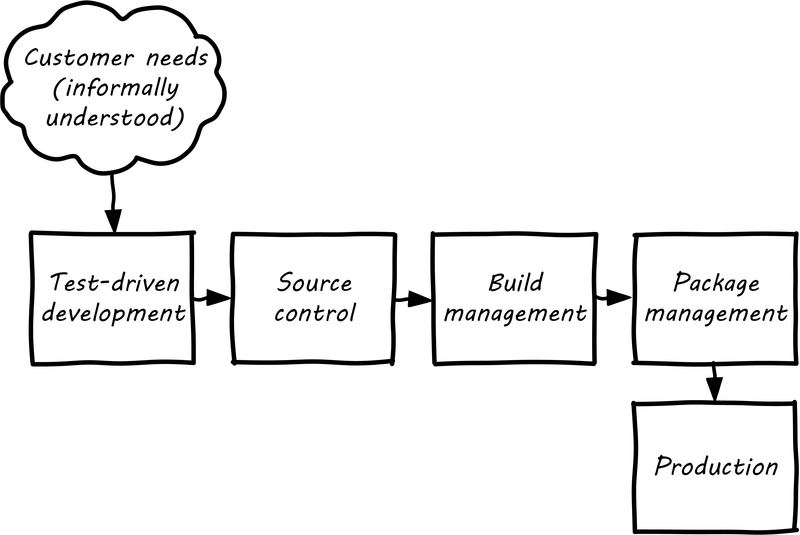
But, the assumption in our emergence model is that more formalized product management emerges with the formation of a team. As a team, we now need to expand “upstream” of the core delivery pipeline, so that we can collaborate and discover more effectively. Notice the grey box in Figure 46, “Product Discovery Explicit”.
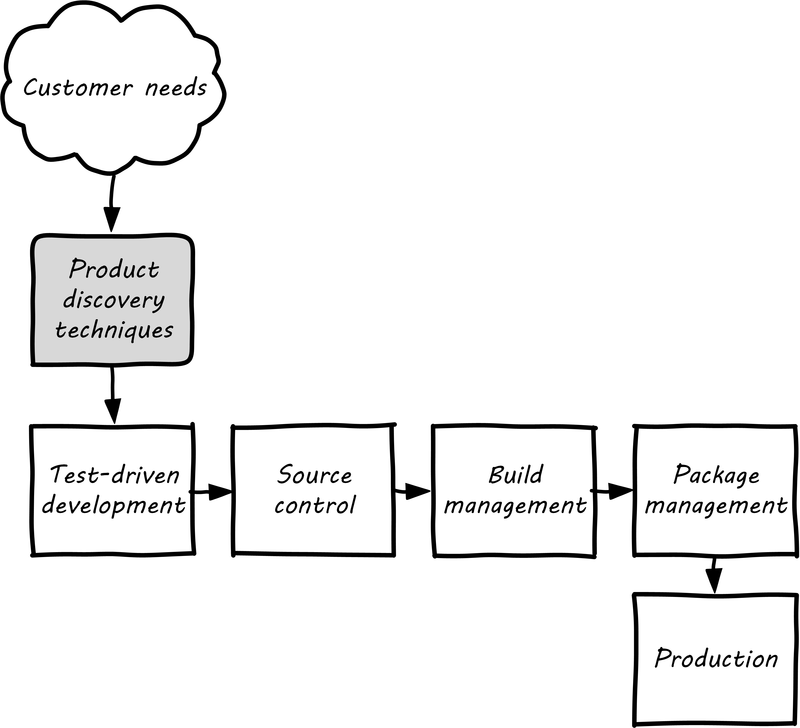
The most important foundation for your newly formalized product discovery capability is that it must be empirical and hypothesis-driven. Too often, product strategy is based on the Highest Paid Person’s Opinion (HiPPO).
The problem with relying on “gut feeling” or personal opinions is that people — regardless of experience or seniority — perform poorly in assessing the likely outcome of their product ideas. A well-known case is the initial rejection of Amazon shopping cart suggestions [179]. Some well-known research on this topic was conducted by Microsoft’s Ronny Kohavi. In this research, Kohavi and team determined that “only about 1/3 of ideas improve the metrics they were designed to improve” [170]. As background, the same report cites that:
-
"Netflix considers 90% of what they try to be wrong”
-
“75% of important business decisions and business improvement ideas either have no impact on performance or actually hurt performance” according to Qualpro (a consultancy specializing in controlled experiments)
It is, therefore, critical to establish a strong practice of data-driven experimentation when forming a product team and avoid any cultural acceptance of “gut feel” or deferring to HiPPOs. This can be a difficult transition for the company founder, who has until now served as the de facto product manager.
A useful framework, similar to Lean Startup is proposed by Spotify™, in the “DIBB” model:
-
Data
-
Insight
-
Belief
-
Bet
Data leads to insight, which leads to a hypothesis that can be tested (i.e., “bet” on — testing hypotheses is not free). We discuss issues of prioritization further in Section 6.2.2, “Work Management”, in the section on cost of delay.
Don Reinertsen (whom we will read more about in Competency Area 5) emphasizes that such experimentation is inherently variable. We can’t develop experiments with any sort of expectation that they will always succeed. We might run 50 experiments, and only have two succeed. But if the cost of each experiment is $10,000, and the two that succeeded earned us $1 million each, we gained:
$ 2,000,000
$ — 500,000
-----------
$ 1,500,000
Not a bad return on investment! (see [230], Section 6.2.1, “Product Management”, for a detailed, mathematical discussion, based on options and information theory). Roman Pichler, in Agile Product Management with Scrum, describes “old-school” versus “new-school” product management as in Table 4, “Old School versus New School Product Management” (summarized from [219], p.xii).
| Old School | New School |
|---|---|
Shared responsibility |
Single product owner |
Detached/distant product management |
Product owner on the Scrum team |
Extensive up-front research |
Minimal up-front work to define rough vision |
Requirements frozen early |
Dynamic backlog |
Late feedback due to lengthy release cycle |
Early and frequent releases drive fast feedback, resulting in customer value |
6.2.1.2.2. Product Discovery Techniques
There are a wide variety of techniques and even “schools” of product discovery and design. This section considers a few representatives. At the team level, such techniques must be further formalized. The techniques are not mutually-exclusive; they may be complementary. User Story Mapping was previously mentioned. In product discovery terms, User Story Mapping is a form of persona analysis. But that is only one of many techniques. Roman Pichler mentions “Vision Box and Trade Journal Review” and the “Kano Model” [219 p. 39]. Here, let’s discuss:
-
“Jobs to be Done” analysis
-
Impact mapping
-
Business analysis and architecture
The “Jobs to be Done” framework was created by noted Harvard professor Clayton Christensen, in part as a reaction against conventional marketing techniques that:
"frame customers by attributes - using age ranges, race, marital status, and other categories that ultimately create products and entire categories too focused on what companies want to sell, rather than on what customers actually need" [61].
“Some products are better defined by the job they do than the customers they serve”, in other words [286]. This is in contrast to many kinds of business and requirements analysis that focus on identifying different user personas (e.g., 45-55 married Black woman with children in the house). Jobs to be Done advocates argue that “The job, not the customer, is the fundamental unit of analysis” and that customers “hire” products to do a certain job [60].
To apply the Jobs to be Done approach, Des Traynor suggests filling in the blanks in the following [286]:
People hire your product to do the job of ------— every --------— when ----------. The other applicants for this job are --------, --------, and --------, but your product will always get the job because of --------.
Understanding the alternatives people have is key. It is possible that the job can be fulfilled in multiple different ways. For example, people may want certain software to be run. This job can be undertaken through owning a computer (e.g., having a data center). It can also be managed by hiring someone else’s computer (e.g., using a cloud provider). Not being attentive and creative in thinking about the diverse ways jobs can be done places you at risk for disruption.
Understanding the relationship of a given feature or component to business objectives is critical. Too often, technologists (e.g., software professionals) are accused of wanting “technology for technology’s sake”.
Showing the “line of sight” from technology to a business objective is, therefore, critical. Ideally, this starts by identifying the business objective. Gojko Adzic’s Impact Mapping: Making a big impact with software products and projects [7] describes a technique for doing so:
An impact map is a visualization of scope and underlying assumptions, created collaboratively by senior technical and business people.
Starting with some general goal or hypothesis (e.g., generated through Lean Startup thinking), build a “map” of how the goal can be achieved, or hypothesis can be measured. A simple graphical approach can be used, as in Figure 47, “Impact Map”.
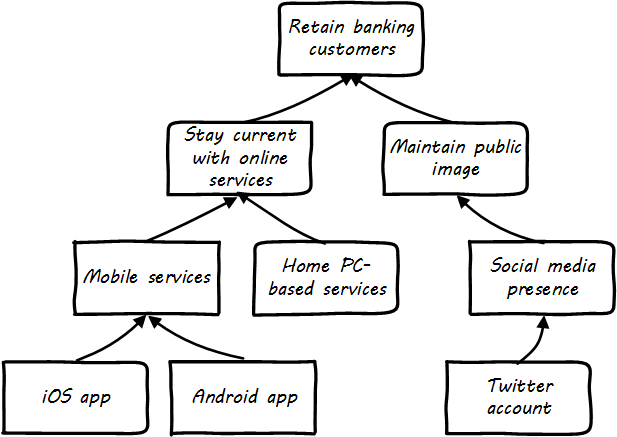
|
Note
|
Impact mapping is similar to mind mapping, and some drawing tools such as Microsoft Visio™ come with “Mind Mapping” templates. |
The most important part of the impact map is to answer the question “why are we doing this?”. The impact map is intended to help keep the team focused on the most important objectives, and avoid less valuable activities and investments.
For example, in the above diagram, we see that a bank may have an overall business goal of customer retention. (It is much more expensive to gain a new customer than to retain an existing one, and retention is a metric carefully measured and tracked at the highest levels of the business.)
Through focus groups and surveys, the bank may determine that staying current with online services is important to retaining customers. Some of these services are accessed by home PCs, but increasingly customers want access via mobile devices.
These business drivers lead to the decision to invest in online banking applications for both the Apple® and Android™ mobile platforms. This decision, in turn, will lead to further discovery, analysis, and design of the mobile applications.
One well-established method for product discovery is that of business analysis, formalized in the Business Analysis Body of Knowledge (BABOK), from the International Institute of Business Analysis [143].
The BABOK defines business analysis as (p.442):
The practice of enabling change in the context of an enterprise by defining needs and recommending solutions that deliver value to stakeholders.
The BABOK is centrally concerned with the concept of requirements, and classifies them as follows:
-
Business requirements
-
Stakeholder requirements
-
Solution requirements
-
Functional requirements
-
Non-functional requirements
-
-
Transition requirements
The BABOK also provides a framework for understanding and managing the work of business analysts; in general, it assumes that a Business Analyst capability will be established and that maturing such a capability is a desirable thing. This may run counter to the Scrum ideal of cross-functional, multi-skilled teams. Also as noted above, the term "requirements” has fallen out of favor with some Agile thought leaders.
6.2.1.3. Product Design
Once we have discovered at least a direction for the product’s value proposition, and have started to understand and prioritize the functions it must perform, we begin the activity of design. Design, like most other topics in this document, is a broad and complex area with varying definitions and schools of thought. The Herbert Simon quote at the beginning of this section is frequently cited.
Design is an ongoing theme throughout the humanities, encountered in architecture (the non-IT variety), art, graphics, fashion, and commerce. It can be narrowly focused, such as the question of what color scheme to use on an app or web page. Or it can be much more expansive, as suggested by the field of design thinking. We will start with the expansive vision and drill down into a few topics.
6.2.1.3.1. Design Thinking
Design thinking is a recent trend with various definitions, but in general, combines a design sensibility with problem solving at significant scale. It usually is understood to include a significant component of systems thinking.
Design thinking is the logical evolution of disciplines such as user interface design when such designs encounter constraints and issues beyond their usual span of concern. Although it has been influential on Lean UX and related works, it is not an explicitly digital discipline.
There are many design failures in digital product delivery. What is often overlooked is that the entire customer experience of the product is a form of design.
Consider for example Apple. Their products are admired worldwide and cited as examples of “good design”. Often, however, this is only understood in terms of the physical product; for example, an iPhone® or a MacBook Air®. But there is more to the experience. Suppose you have technical difficulties with your iPhone, or you just want to get more value out of it. Apple created its popular Genius Bar support service, where you can get support and instruction in using the technology.
Notice that the product you are using is no longer just the phone or computer. It is the combination of the device PLUS your support experience. This is essential to understanding the modern practices of design thinking and Lean UX.
The following table condensed from Lotta Hassi and Miko Laakso [125] provides a useful overview of design thinking:
| PRACTICES | THINKING STYLES | MENTALITY |
|---|---|---|
• HUMAN-CENTERED APPROACH; e.g., people-based, user-centered, empathizing, ethnography, observation • THINKING BY DOING; e.g., early and fast prototyping, fast learning, rapid iterative development cycles • COMBINATION OF DIVERGENT AND CONVERGENT APPROACHES; e.g., ideation, pattern finding, creating multiple alternatives • COLLABORATIVE WORK STYLE; e.g., multi-disciplinary collaboration, involving many stakeholders, interdisciplinary teams |
• ABDUCTIVE REASONING; e.g., the logic of "what could be", finding new opportunities, urge to create something new, challenge the norm • REFLECTIVE REFRAMING; e.g., rephrasing the problem, going beyond what is obvious to see what lies behind the problem, challenge the given problem • HOLISTIC VIEW; e.g., systems thinking, 360 degree view on the issue • INTEGRATIVE THINKING; e.g., harmonious balance, creative resolution of tension, finding balance between validity and reliability |
• EXPERIMENTAL & EXPLORATIVE; e.g., the license to explore possibilities, risking failure, failing fast • AMBIGUITY TOLERANT; e.g., allowing for ambiguity, tolerance for ambiguity, comfortable with ambiguity, liquid and open process • OPTIMISTIC; e.g., viewing constraints as positive, optimism attitude, enjoying problem solving • FUTURE-ORIENTED; e.g., orientation towards the future, vision versus status quo, intuition as a driving force |
6.2.1.3.2. Hypothesis Testing
The concept of hypothesis testing is key to product discovery and design. The power of scalable cloud architectures and fast continuous delivery pipelines has made it possible to test product hypotheses against real-world customers at scale and in real time. Companies like Netflix and Facebook have pioneered techniques like "canary deployments” and "A/B testing”.
In these approaches, two different features are tried out simultaneously, and the business results are measured. For example, are customers more likely to click on a green button or a yellow one? Testing such questions in the era of packaged software would have required lab-based usability engineering approaches, which risked being invalid because of their small sample size. Testing against larger numbers is possible, now that software is increasingly delivered as a service.
6.2.1.3.3. Usability and Interaction
At a lower level than the holistic concerns of design thinking, we have practices such as usability engineering. These take many forms. There are many systematic and well-researched approaches to:
and related topics. All such approaches, however, should be used in the overall Lean Startup/Lean UX framework of hypothesis generation and testing. If we subscribe to design thinking and take a whole-systems view, designing for ease of operations is also part of the design process. We will discuss this further in Section 6.2.3, “Operations Management”. Developing documentation of the product’s characteristics, from the perspective of those who will run it on a day-to-day basis, is also an aspect of product delivery.
6.2.1.3.4. Product Discovery versus Design
Some of the most contentious discussions related to IT management and Agile come at the intersection of software and systems engineering, especially when large investments are at stake. We call this the “discovery versus design” problem.
Frequent criticisms of Lean Startup and its related digital practices are:
-
They are relevant only for non-critical Internet-based products (e.g., Facebook and Netflix)
-
Some IT products must fit much tighter specifications and do not have the freedom to “pivot” (e.g., control software written for aerospace and defense systems)
There are two very different product development worlds. Some product development ("cogs") is constrained by the overall system it takes place within. Other product development ("flowers") has more freedom to grow in different directions — to “discover” the customer.
The cog represents the world of classic systems engineering — a larger objective frames the effort, and the component occupies a certain defined place within it. And yet, it may still be challenging to design and build the component, which can be understood as a product in and of itself. Fast feedback is still required for the design and development process, even when the product is only a small component with a very specific set of requirements.
The flower represents the market-facing digital product that may “pivot”, grow, and adapt according to conditions. It also is constrained, by available space and energy, but within certain boundaries has greater adaptability.
Neither is better than the other, but they do require different approaches. In general, we are coming from a world that viewed digital systems strictly as cogs. Subsequently, we are moving towards a world in which digital systems are more flexible, dynamic, and adaptable.
When digital components have very well-understood requirements, usually we purchase them from specialist providers (increasingly “as a service”). This results in increasing attention to the “flowers” of digital product design since acquiring the “cogs” is relatively straightforward (more on this in the section on sourcing).
Evidence of Notability
Product discovery techniques are widely discussed in the product management community and are frequent topics of presentation at notable industry events such as Agile Alliance conferences.
Limitations
In organizations that are primarily purchasing software and not building it, product discovery techniques may be less applicable. However, internal "products" understood as business capabilities may still benefit from a design/discovery approach, even if they are based on (for example) a SaaS offering.
Related Topics
6.2.1.4. Scrum and Other Product Team Practices
Description
A solid foundation of team-level organization and practice is essential as an organization scales up. Bad habits (like accepting too much work in the system, or tolerating toxic individuals) will be more and more difficult to overcome as the organization grows.
6.2.1.4.1. The Concept of Collaboration
Team collaboration is one of the key values of Agile. The Agile Alliance states that:
A “team” in the Agile sense is a small group of people, assigned to the same project or effort, nearly all of them on a full-time basis.
Teams are multi-skilled, share accountability, and individuals on the team may play multiple roles [9]:
Face-to-face interactions, usually enabled by giving the team its own space, are essential for collaboration. While there are various approaches to Agile, all concur that tight-knit, collaborative teams deliver the highest value outcomes. However, collaboration does not happen just because people are fed pizzas and work in a room together. Google has established that the most significant predictor of team performance is a sense of psychological safety. Research by Anita Woolley and colleagues suggests that three factors driving team performance are [309]:
-
Equal contribution to team discussions (no dominant individuals)
-
Emotional awareness — being able to infer other team members' emotional states
-
Teams with a higher proportion of women tend to perform better (the researchers inferred this was due to women generally having higher emotional awareness)
Other research shows that diverse teams and organizations are more innovative and deliver better results; such teams may tend to focus more on facts (as opposed to groupthink) [235]. Certainly, a sense of psychological safety is critical to the success of diverse teams, who may come from different cultures and backgrounds that don’t inherently trust each other.
|
Important
|
The collective problem-solving talent of a diverse group of individuals who are given space to self-organize and solve problems creatively is immense, and very possibly the highest value resource known to the modern organization. |
Two current schools of thought with much to say about collaboration are Lean UX and Scrum.
6.2.1.4.2. Lean UX
Lean UX is the practice of bringing the true nature of a product to light faster, in a collaborative, cross-functional way that reduces the emphasis on thorough documentation while increasing the focus on building a shared understanding of the actual product experience being designed.
Lean UX
Lean UX is a term coined by author and consultant Jeff Gothelf [114], which draws on three major influences:
-
Design thinking
-
Agile software development
-
Lean Startup
We briefly discussed Lean Startup in Section 6.1.1, “Digital Fundamentals”, and the history and motivations for Agile software development in Section 6.1.3, “Application Delivery”. We will look in more depth at product discovery techniques, and design and design thinking subsequently. However, Lean UX has much to say about forming the product team, suggesting (among others) the following principles for forming and sustaining teams:
-
Dedicated, cross-functional teams
-
Outcome (not deliverable/output) focus
-
Cultivating a sense of shared understanding
-
Avoiding toxic individuals (so-called “rockstars, gurus, and ninjas”)
-
Permission to fail
(Other Lean UX principles such as small batch sizes and visualizing work will be discussed elsewhere; there is significant overlap between Lean UX and other schools of thought covered in this document).
Lean UX is an influential work among digital firms and summarizes modern development practices well, especially for small, team-based organizations with minimal external dependencies. It is a broad and conceptual, principles-based framework open for interpretation in multiple ways. We continue with more “prescriptive” methods and techniques, such as Scrum.
6.2.1.4.3. Scrum
Scrum is a lightweight framework designed to help small, close-knit teams of people develop complex products.
Scrum: A Breathtakingly Brief and Agile Introduction
There Are No Tasks; There Are Only Stories.
Scrum: The Art of Doing Twice the Work in Half the Time
One of the first prescriptive Agile methodologies you are likely to encounter as a practitioner is Scrum. There are many books, classes, and websites where you can learn more about this framework; [260] is a good brief introduction, and [243] is well suited for more in-depth study.
|
Note
|
“Prescriptive” means detailed and precise. A doctor’s prescription is specific as to what medicine to take, how much, and when. A prescriptive method is similarly specific. “Agile software development” is not prescriptive, as currently published by the Agile Alliance; it is a collection of principles and ideas you may or may not choose to use. By comparison, Scrum is prescriptive; it states roles and activities specifically, and trainers and practitioners, in general, seek to follow the method completely and accurately. |
Scrum is appropriate to this Competency Area, as it is product-focused. It calls for the roles of:
-
Product owner
-
Scrum master
-
Team member
and avoids further elaboration of roles.
The Scrum product owner is responsible for holding the product vision and seeing that the team executes the highest value work. As such, the potential features of the product are maintained in a “backlog” that can be re-prioritized as necessary (rather than a large, fixed-scope project). The product owner also defines acceptance criteria for the backlog items. The Scrum master, on the other hand, acts as a team coach, “guiding the team to ever-higher levels of cohesiveness, self-organization, and performance” [260]. To quote Roman Pichler:
The product owner and Scrum master roles complement each other: The product owner is primarily responsible for the “what" - creating the right product. The Scrum master is primarily responsible for the “how" - using Scrum the right way [219 p. 9].
Scrum uses specific practices and artifacts such as sprints, standups, reviews, the above-mentioned concept of backlog, burndown charts, and so forth. We will discuss some of these further in Section 6.2.2, “Work Management” and Section 6.3.1, “Coordination and Process” along with Kanban, another popular approach for executing work.
In Scrum, there are three roles:
-
The product owner sets the overall direction
-
The Scrum master coaches and advocates for the team
-
The development team is defined as those who are committed to the development work
There are seven activities:
-
The “Sprint” is a defined time period, typically two to four weeks, in which the development team executes on an agreed scope
-
Backlog Grooming is when the product backlog is examined and refined into increments that can be moved into the sprint backlog
-
Sprint Planning is where the scope is agreed
-
The Daily Scrum is traditionally held standing up, to maintain focus and ensure brevity
-
Sprint Execution is the development activity within the sprint
-
Sprint Review is the “public end of the sprint” when the stakeholders are invited to view the completed work
-
The Sprint Retrospective is held to identify lessons learned from the sprint and how to apply them in future work
There are a number of artifacts:
-
The product backlog is the overall “to-do” list for the product
-
The sprint backlog is the to-do list for the current sprint
-
Potentially Shippable Increment (PSI) is an important concept used to decouple the team’s development activity from downstream business planning; a PSI is a cohesive unit of functionality that could be delivered to the customer, but doing so is the decision of the product owner
Scrum is well grounded in various theories (process control, human factors), although Scrum team members do not need to understand theory to succeed with it. Like Lean UX, Scrum emphasizes high-bandwidth collaboration, dedicated multi-skilled teams, a product focus, and so forth.
The concept of having an empowered product owner readily available to the team is attractive, especially for Digital Practitioners who may have worked on teams where the direction was unclear. Roman Pichler identifies a number of common mistakes, however, that diminish the value of this approach [219 pp. 17-20]:
-
Product owner lacks authority
-
Product owner is overworked
-
Product ownership is split across individuals
-
Product owner is “distant” — not co-located or readily available to team
Scrum and Shu-ha-ri
In the Japanese martial art of aikido, there is the concept of shu-ha-ri, a form of learning progression.
-
Shu: the student follows the rules of a given method precisely, without addition or alteration
-
Ha: the student learns theory and principle of the technique
-
Ri: the student creates own approaches and adapts technique to circumstance
Scrum at its most prescriptive can be seen as a shu-level practice; it gives detailed guidance that has been shown to work.
See [104] and [65 pp. 17-18]
6.2.1.4.4. More on Product Team Roles
Boundaries are provided by the product owner and often come in the form of constraints, such as: "I need it by June", "We need to reduce the per-unit cost by half", "It needs to run at twice the speed", or "It can use only half the memory of the current version".
Succeeding with Agile Software Development Using Scrum
Marty Cagan suggests that the product team has three primary concerns, requiring three critical roles [53]:
-
Value: Product Owner/Manager
-
Feasibility: Engineering
-
Usability: User Experience Design
Jeff Patton represents these concepts as a Venn diagram (see Figure 48, “The Three Views of the Product Team”, similar to [217]).
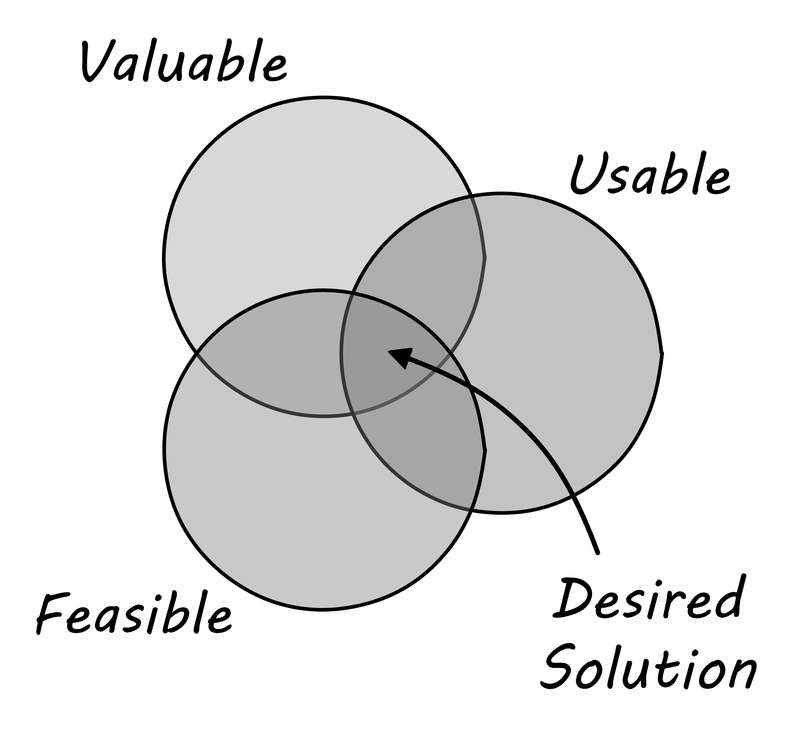
Finally, a word on the product manager. Scrum is prescriptive around the product owner role, but does not identify a role for product manager. This can lead to two people performing product management: a marketing-aligned “manager” responsible for high-level requirements, with the Scrum “product owner” attempting to translate them for the team. Marty Cagan warns against this approach, recommending instead that the product manager and owner be the same person, separate from marketing [53 pp. 7-8].
In a subsequent section, we will consider the challenge of product discovery — at a product level, what practices do we follow to generate the creative insights that will result in customer value?
Evidence of Notability
Product team structure and practices are widely debated and discussed in the industry, particularly in the Agile community. Notable conferences include Agile Alliance and Global Scrum Gathering. Many books are published on Scrum and related product team organization topics; e.g., [243, 114, 273],
Limitations
Product team structure and practices are only relevant when there is a concept of product. Some digital work may be framed as projects, where structures are temporary and objectives are more constrained.
Related Topics
6.2.1.5. Product Planning
Description
6.2.1.5.1. Product Roadmapping and Release Planning
Creating effective plans in complex situations is challenging. Planning a new product is one of the most challenging endeavors, one in which failure is common. The historically failed approach (call it the "planning fallacy”) is to develop overly detailed (sometimes called “rigorous”) plans and then assume that achieving them is simply a matter of “correct execution” (see Figure 49, “Planning Fallacy”).
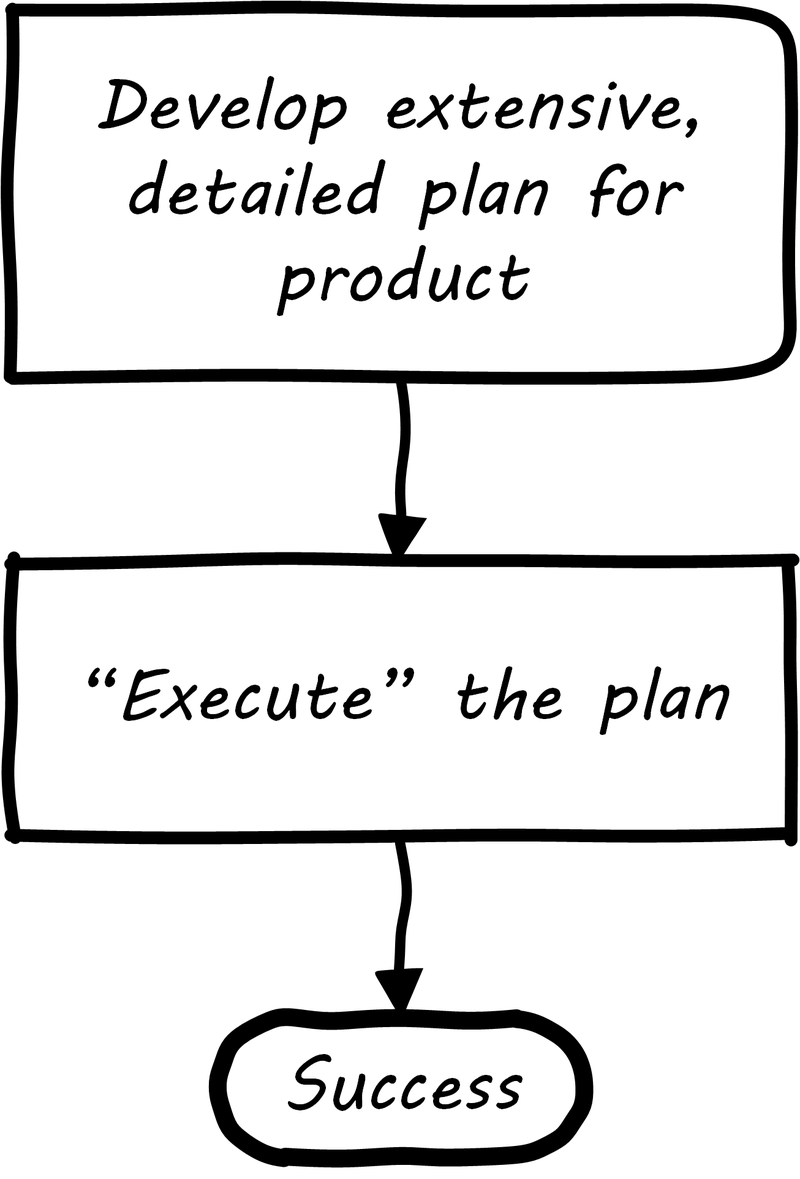
Contrast the planning fallacy with Lean Startup approaches, which emphasize ongoing confirmation of product direction through experimentation. In complex efforts, ongoing validation of assumptions and direction is essential, which is why overly plan-driven approaches are falling out of favor. However, some understanding of timeframes and mapping goals against the calendar is still important. Exactly how much effort to devote to such forecasting remains a controversial topic with DPM professionals, one we will return to throughout this document.
Minimally, a high-level product roadmap is usually called for: without at least this, it may be difficult to secure the needed investment to start product work. Roman Pichler recommends the product roadmap contains:
-
Major versions
-
Their projected launch dates
-
Target customers and needs
-
Top three to five features for each version [219 p. 41]
More detailed understanding is left to the product backlog, which is subject to ongoing “grooming”; that is, re-evaluation in light of feedback.
6.2.1.5.2. Backlog, Estimation, and Prioritization
The product discovery and roadmapping activity ultimately generates a more detailed view or list of the work to be done. As we previously mentioned, in Scrum and other Agile methods this is often termed a backlog. Both Mike Cohn and Roman Pichler use the DEEP acronym to describe backlog qualities [68 p. 243, 219 p. 48]:
-
Detailed appropriately
-
Estimated
-
Emergent (feedback such as new or changed stories are readily accepted)
-
Prioritized
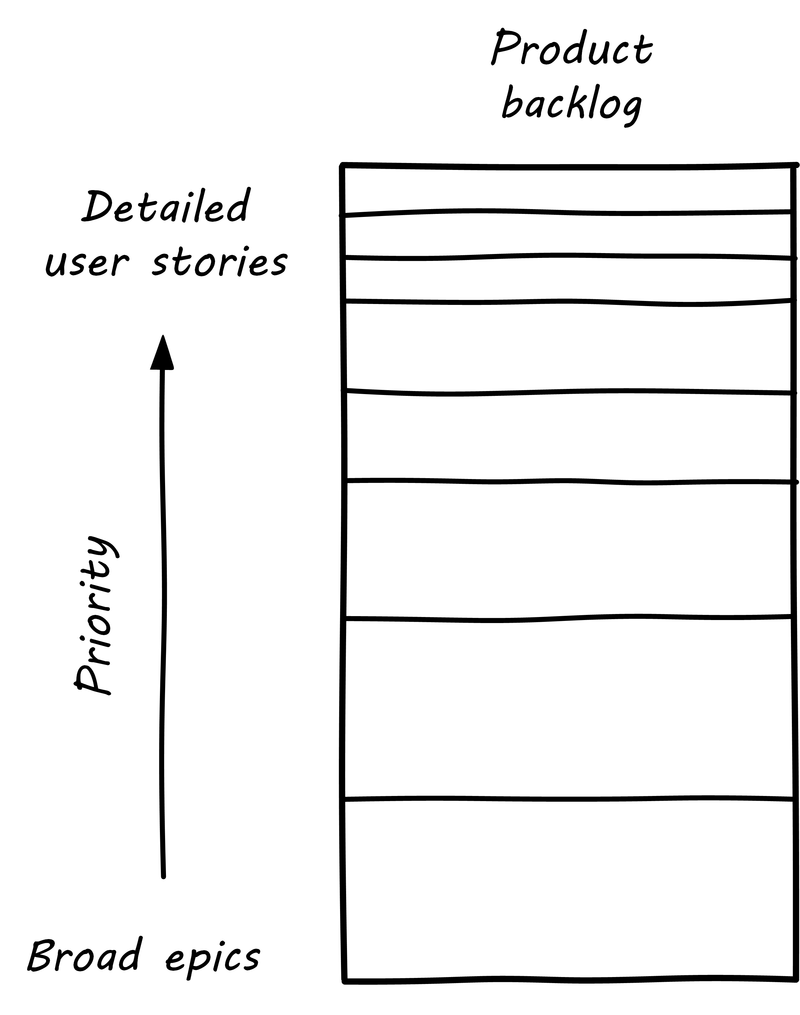
The backlog should receive ongoing “grooming” to support these qualities, which means several things:
-
Addition of new items
-
Re-prioritization of items
-
Elaboration (decomposition, estimation, and refinement)
When “detailed appropriately”, items in the backlog are not all the same scale. Scrum and Agile thinkers generally agree on the core concept of "story”, but stories vary in size (see Figure 50, “Backlog Granularity and Priority”, similar to [219]), with the largest stories often termed “epics”. The backlog is ordered in terms of priority (what will be done next) but, critically, it is also understood that the lower-priority items, in general, can be larger-grained. In other words, if we visualize the backlog as a stack, with the highest priority on the top, the size of the stories increases as we go down. (Don Reinertsen terms this progressive specification; see [229 pp. 176-177] for a detailed discussion.)
Estimating user stories is a standard practice in Scrum and Agile methods more generally. Agile approaches are wary of false precision and accept the fact that estimation is an uncertain practice at best. However, without some overall estimate or roadmap for when a product might be ready for use, it is unlikely that the investment will be made to create it. It is difficult to establish the economic value of developing a product feature at a particular time if you have no idea of the cost and/or effort involved to bring it to market.
At a more detailed level, it is common practice for product teams to estimate detailed stories using “points”. Mike Cohn emphasizes: “Estimate size, derive duration” ([67], p.xxvii). Points are a relative form of estimation, valid within the boundary of one team. Story point estimating strives to avoid false precision, often restricting the team’s estimate of the effort to a modified Fibonacci sequence, or even T-shirt or dog sizes [67 p. 37] as shown in Table 6, “Agile Estimating Scales” (similar to [67 p. 37]).
Mike Cohn emphasizes that estimates are best done by the teams performing the work [67 p. 51]. We will discuss the mechanics of maintaining backlogs in Section 6.2.2, “Work Management”.
| Story point | T-Shirt | Dog |
|---|---|---|
1 |
XXS |
Chihauha |
2 |
XS |
Dachshund |
3 |
S |
Terrier |
5 |
M |
Border Collie |
8 |
L |
Bulldog |
13 |
XL |
Labrador Retriever |
20 |
XXL |
Mastiff |
40 |
XXXL |
Great Dane |
Backlogs require prioritization. In order to prioritize, we must have some kind of common understanding of what we are prioritizing for. Mike Cohn, in Agile Estimating and Planning, proposes that there are four major factors in understanding product value:
-
The financial value of having the features
-
The cost of developing and supporting the features
-
The value of the learning created by developing the features
-
The amount of risk reduced by developing the features [67 p. 80]
In Section 6.2.2, “Work Management” we will discuss additional tools for managing and prioritizing work, and we will return to the topic of estimation in Section 6.3.2, “Investment and Portfolio”.
Evidence of Notability
Product roadmaps are one of the first steps towards investment management and strategic planning. There are robust debates around estimation and planning in the Agile community.
Limitations
Roadmaps are uncertain at best. They are prone to false precision and the planning fallacy.
Related Topics
6.2.2. Work Management
Area Description
When a team or a startup hires its first employees, and increases in size from two people to three or four, it is confronted with the fundamental issue of how work is tracked. The product team is now getting feedback from users calling for prioritization, the allocation of resources, and the tracking of effort and completion. These are the critical day-to-day questions for any business larger than a couple of co-founders:
-
What do we need to do?
-
In what order?
-
Who is doing it?
-
Do they need help?
-
Do they need direction?
-
When will they be done?
-
What do we mean by done?
People have different responsibilities and specialties, yet there is a common vision for delivering an IT-based product of some value. How is the work tracked towards this end? Perhaps the team is still primarily in the same location, but people sometimes are off-site or keeping different hours. Beyond product strategy, the team is getting support calls that result in fixes and new features. The initial signs of too much work-in-progress (slow delivery of final results, multi-tasking, and more) may be starting to appear.
The team has a product owner. They now institute Scrum practices of a managed backlog, daily standups, and sprints. They may also use Kanban-style task boards or card walls (to be described in this Competency Area), which are essential for things like support or other interrupt-driven work. The relationship of these to your Scrum practices is a matter of ongoing debate. In general the team does not yet need full-blown project management (covered in Context III). The concept of "ticketing” will likely arise at this point. How this relates to your Scrum/Kanban approach is a question.
Furthermore, while Agile principles and practices were covered in previous Competency Areas, there was limited discussion of why they work. This Competency Area covers Lean theory of product management that provides a basis for Agile practices; in particular, the work of Don Reinertsen.
The Competency Area title “Work Management” reflects earlier stages of organizational growth. At this point, neither formal project management, nor a fully realized process framework is needed, and the organization may not see a need to distinguish precisely between types of work processes. “It’s all just work” at this stage.
6.2.2.1. Work Management and Lean
Description
Product development drives a wide variety of work activities. As your product matures, you encounter both routine and non-routine work. Some of the work depends on other work getting done. Sometimes you do not realize this immediately. All of this work needs to be tracked.
Work management may start with verbal requests, emails, even postal mail. If you ask your colleague to do one thing, and she doesn’t have anything else to do, it is likely that the two of you will remember. If you ask her to do four things over a few days, you might both still remember. But if you are asking for new things every day, it is likely that some things will get missed. You each might start keeping your own “to do” list, and this mechanism can handle a dozen or two dozen tasks. Consider an example of three people, each with their own to do list (see Figure 51, “Work Flowing Across Three To-Do Lists”).
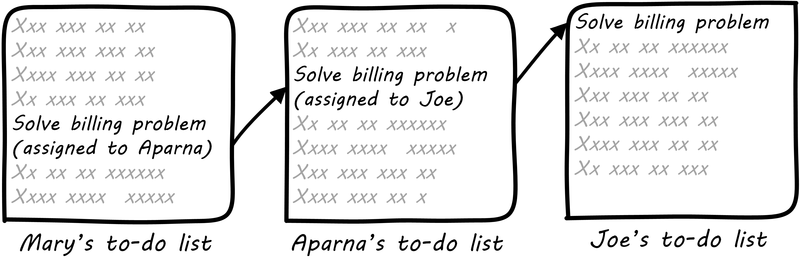
In this situation, each person has their own “mental model” of what needs to be done, and their own tracking mechanism. We don’t know how the work is being transmitted: emails, phone calls, hallway conversations. ("Say, Joe, there is an issue with Customer X’s bill, can you please look into it?”)
But what happens when there are three of you? Mary asks Aparna to do something, and in order to complete it, she needs something from Joe, whom Mary is also asking to complete other tasks. As an organization scales, this can easily lead to confusion and “dropped balls”.
At some point, you need to formalize your model of the work, how it is described, and how it flows. This is such a fundamental problem in human society that many different systems, tools, and processes have been developed over the centuries to address it.
Probably the most important is the shared task reference point. What does this mean? The “task” is made “real” by associating it with a common, agreed artifact.
For example, a “ticket” may be created, or a "work order”. Or a “story”, written down on a sticky note. At our current level of understanding, there is little difference between these concepts. The important thing they have in common is an independent existence. That is, Mary, Aparna, and Joe might all change jobs, but the artifact persists independently of them. Notice also that the artifact — the ticket, the post-it note — is not the actual task, which is an intangible, consensus concept. It is a representation of this intangible “intent to perform”. We will discuss these issues of representation further in Section 6.4.2, “Information Management”.
A complex IT-based system is not needed if you are all in the same room! (Nor for that matter a complex process framework, such as ITIL or COBIT®. There is a risk in using such frameworks at this stage of evolution — they add too much overhead for your level of growth.) It is also still too early for formal project management. The “project team” would be most or all of the organization, so what would be the point? A shared white board in a public location might be all that is needed (see Figure 52, “Common List”). This gives the team a “shared mental model” of who is doing what.
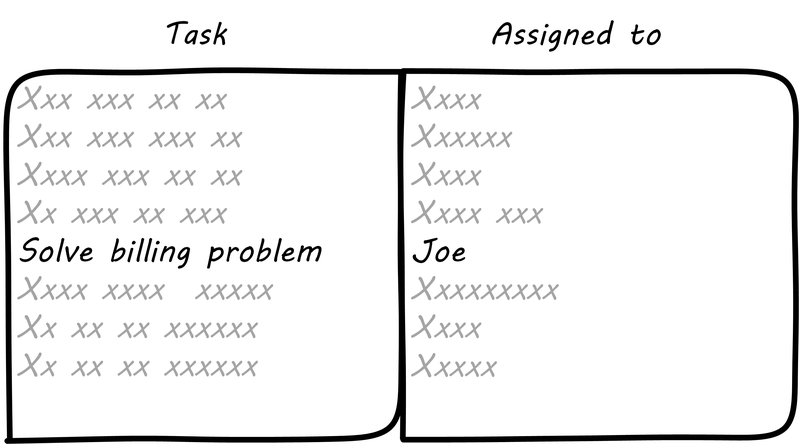
The design of the task board above has some issues, however. After the team gets tired of erasing and rewriting the tasks and their current assignments, they might adopt something more like this:
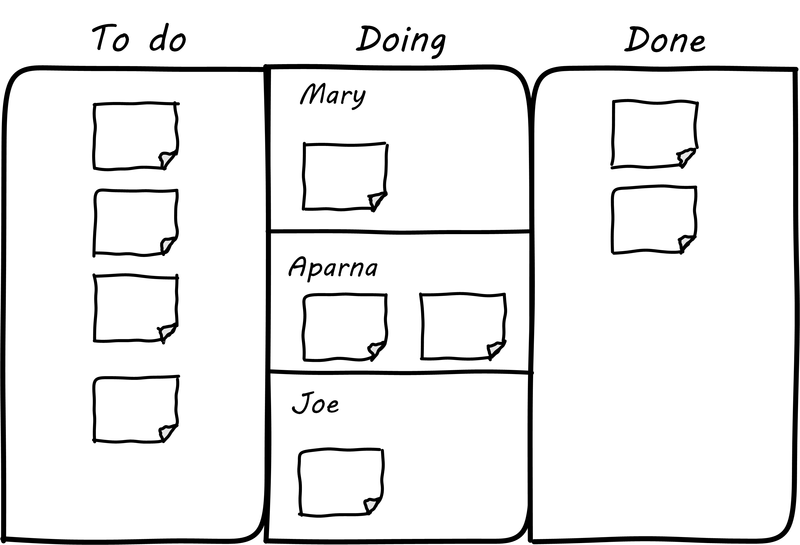
The board itself might be a white board or a cork bulletin board with push pins (see Figure 53, “Simple Task Board”). The notes could be sticky, or index cards. There are automated solutions as well. The tool doesn’t really matter. The important thing is that, at a glance, the entire team can see its flow of work and who is doing what.
This is sometimes called a “Kanban board”, although David Anderson (originator of the Kanban software method [20]) himself terms the basic technique a "card wall”. It also has been called a "Scrum Board”. The board at its most basic is not specific to either methodology. The term “Kanban” itself derives from Lean manufacturing principles; we will cover this in-depth in the next section. The basic board is widely used because it is a powerful artifact. Behind its deceptive simplicity are considerable industrial experience and relevant theory from operations management and human factors. However, it has scalability limitations. What if the team is not all in the same room? We will cover this and related issues in Context III.
The card wall or Kanban board is the first channel we have for demand management. Demand management is a term meaning “understanding and planning for required or anticipated services or work”. Managing day-to-day incoming work is a form of demand management. Capturing and assessing ideas for next year’s project portfolio (if you use projects) is also demand management at a larger scale.
6.2.2.1.1. Lean Background
To understand Kanban we should start with Lean. Lean is a term invented by American researchers who investigated Japanese industrial practices and their success in the 20th century. After the end of World War II, no-one expected the Japanese economy to recover the way it did. The recovery is credited to practices developed and promoted by Taiichi Ohno and Shigeo Shingo at Toyota [212]. These practices included:
-
Respect for people
-
Limiting work-in-process
-
Small batch sizes (driving towards “single piece flow”)
-
Just-in-time production
-
Decreased cycle time
Credit for Lean is also sometimes given to US thinkers such as W. Edwards Deming, Peter Juran, and the theorists behind the Training Within Industry methodology, each of whom played influential roles in shaping the industrial practices of post-war Japan.
Kanban is a term originating from Lean and the Toyota Production System. Originally, it signified a “pull” technique in which materials would only be transferred to a given workstation on a definite signal that the workstation required the materials. This was in contrast to “push” approaches where work was allowed to accumulate on the shop floor, on the (now discredited) idea that it was more “efficient” to operate workstations at maximum capacity.
Factories operating on a “push” model found themselves with massive amounts of inventory (work-in-process) in their facilities. This tied up operating capital and resulted in long delays in shipment. Japanese companies did not have the luxury of large amounts of operating capital, so they started experimenting with "single-piece flow”. This led to a number of related innovations, such as the ability to re-configure manufacturing machinery much more quickly than US factories were capable of.
David J. Anderson was a product manager at Microsoft who was seeking a more effective approach to managing software development. In consultation with Don Reinertsen (introduced below) he applied the original concept of Kanban to his software development activities [20].
Scrum (covered in the previous chapter) is based on a rhythm with its scheduled sprints; for example, every two weeks (this is called cadence). In contrast, Kanban is a continuous process with no specified rhythm. Work is “pulled” from the backlog into active attention as resources are freed from previous work. This is perhaps the most important aspect of Kanban — the idea that work is not accepted until there is capacity to perform it.
You may have a white board covered with sticky notes, but if they are stacked on top of each other with no concern for worker availability, you are not doing Kanban. You are accepting too much work-in-process, and you are likely to encounter a “high-queue state” in which work becomes slower and slower to get done. (More on queues below.)
6.2.2.1.2. The Theory of Constraints
Eliyahu Moshe Goldratt was an Israeli physicist and management consultant, best known for his pioneering work in management theory, including The Goal, which is a best-selling business novel frequently assigned in MBA programs. It and Goldratt’s other novels have had a tremendous effect on industrial theory and, now, digital management. One of the best known stories in The Goal centers around a Boy Scout march. Alex, the protagonist struggling to save his manufacturing plant, takes a troop of Scouts on a ten-mile hike. The troop has hikers of various speeds, yet the goal is to arrive simultaneously. As Alex tries to keep the Scouts together, he discovers that the slowest, most overweight scout (Herbie) also has packed an unusually heavy backpack. The contents of Herbie’s pack are redistributed, speeding up both Herbie and the troop.
This story summarizes the Goldratt approach: finding the “constraint” to production (his work as a whole is called the Theory of Constraints). In Goldratt’s view, a system is only as productive as its constraint. At Alex’s factory, it is found that the “constraint” to the overall productivity issues is the newest computer-controlled machine tool — one that could (in theory) perform the work of several older models but was now jeopardizing the entire plant’s survival. The story in this novelization draws important parallels with actual Lean case studies on the often-negative impact of such capital-intensive approaches to production.
6.2.2.1.3. The Shared Mental Model of the Work to be Done
Joint activity depends on interpredictability of the participants’ attitudes and actions. Such interpredictability is based on common ground — pertinent knowledge, beliefs, and assumptions that are shared among the involved parties. [167]
“Common Ground and Coordination in Joint Activity"
The above quote reflects one of the most critical foundations of team collaboration: a common ground, a base of “knowledge, beliefs, and assumptions” enabling collaboration and coordination. Common ground is an essential quality of successful teamwork, and we will revisit it throughout the book. There are many ways in which common ground is important, and we will discuss some of the deeper aspects in terms of information in Section 6.4.2, “Information Management”. Whether you choose Scrum, Kanban, or choose not to label your work management at all, the important thing is that you are creating a shared mental model of the work: its envisioned form and content, and your progress towards it.
Below, we will discuss:
-
Visualization of work
-
The concept of Andon
-
The definition of done
-
Time and space shifting
Visualization is a good place to introduce the idea of common ground.
6.2.2.1.4. Visualization
As simple as the white board is, it makes work-in-progress continuously visible, it enforces work-in-progress constraints, it creates synchronized daily interaction, and it promotes interactive problem solving. Furthermore, teams evolve methods of using white boards continuously, and they have high ownership in their solution. In theory, all this can be replicated by a computer system. In practice, I have not yet seen an automated system that replicates the simple elegance and flexibility of a manual system.
Principles of Product Development Flow
Why are shared visual representations important? Depending on how you measure, between 40% to as much as 80% of the human cortex is devoted to visual processing. Visual processing dominates mental activity, consuming more neurons than the other four senses combined [252]. Visual representations are powerful communication mechanisms, well suited to our cognitive abilities.
This idea of common ground, a shared visual reference point, informing the mental model of the team, is an essential foundation for coordinating activity. This is why card walls or Kanban boards located in the same room are so prevalent. They communicate and sustain the shared mental model of a human team. A shared card wall, with its two dimensions and tasks on cards or sticky notes, is more informative than a simple to-do list (e.g., in a spreadsheet). The cards occupy two-dimensional space and are moved over time to signify activity, both powerful cues to the human visual processing system.
Similarly, monitoring tools for systems operation make use of various visual clues. Large monitors may be displayed prominently on walls so that everyone can understand operational status. Human visual orientation is also why Enterprise Architecture persists. People will always draw to communicate. (See also visualization and Enterprise Architecture.)
Card walls and publicly displayed monitors are both examples of information radiators. The information radiator concept derives from the Japanese concept of Andon, important in Lean thinking.
6.2.2.1.5. Andon, and the Andon Cord
The Andon cord (not to be confused with Andon in the general sense) is another well-known concept in Lean manufacturing. It originated with Toyota, where line workers were empowered to stop the production line if any defective materials or assemblies were encountered. Instead of attempting to work with the defective input, the entire line would shut down, and all concerned would establish what had happened and how to prevent it. The concept of Andon cord concisely summarizes the Lean philosophy of employee responsibility for quality at all levels [212]. Where Andon is a general term for information radiator, the Andon cord implies a dramatic response to the problems of flow — all progress is stopped, everywhere along the line, and the entire resources of the production line are marshaled to collaboratively solve the issue so that it does not happen again. As Toyota thought leader Taiichi Ohno states:
Stopping the machine when there is trouble forces awareness on everyone. When the problem is clearly understood, improvement is possible. Expanding this thought, we establish a rule that even in a manually operated production line, the workers themselves should push the stop button to halt production if any abnormality appears.
Andon and information radiators provide an important stimulus for product teams, informing priorities and prompting responses. They do not prescribe what is to be done; they simply indicate an operational status that may require attention.
6.2.2.1.6. Definition of Done
As work flows through the system performing it, understanding its status is key to managing it. One of the most important mechanisms for doing this is to define what is meant by “done simply”. The Agile Alliance states:
“The team agrees on, and displays prominently somewhere in the team room, a list of criteria which must be met before a product increment, often a user story, is considered “done” [9]. Failure to meet these criteria at the end of a sprint normally implies that the work should not be counted toward that sprint’s velocity.” There are various patterns for defining “done”; for example, Thoughtworks recommends that the business analyst and developer both must agree that some task is complete (it is not up to just one person). Other companies may require peer code reviews [206]. The important point is that the team must agree on the criteria.
This idea of defining “done” can be extended by the team to other concepts such as “blocked”. The important thing is that this is all part of the team’s shared mental model, and is best defined by the team and its customers. (However, governance and consistency concerns may arise if teams are too diverse in such definitions.)
6.2.2.1.7. Time and Space Shifting
At some point, your team will be faced with the problems of time and/or space shifting. People will be on different schedules, or in different locations, or both. There are two things we know about such working relationships. First, they lead to sub-optimal team communications and performance. Second, they are inevitable.
The need for time and space shifting is one of the major drivers for more formalized IT systems. It is difficult to effectively use a physical Kanban board if people aren’t in the office. The outcome of the daily standup needs to be captured for the benefit of those who could not be there.
However, acceptance of time and space shifting may lead to more of it, even when it is not absolutely required. Constant pressure and questioning are recommended, given the superior bandwidth of face-to-face communication in the context of team collaboration.
But not all work requires the same degree of collaboration. While we are still not ready for full-scale process management, at this point in our evolution, we likely will encounter increasing needs to track customer or user service interactions, which can become quite numerous even for small, single-team organizations. Such work is often more individualized and routine, not requiring the full bandwidth of team collaboration. We will discuss this further with the topic of the help or service desk, later in this Competency Area.
6.2.2.1.8. Queues and Limiting Work-in-Process
Even at this stage of our evolution, with just one co-located collaborative team, it is important to consider work-in-process and how to limit it. One topic we will emphasize throughout the rest of this document is queuing.
A queue, intuitively, is a collection of tasks to be done, being serviced by some worker or resource in some sequence; for example:
-
Feature “stories” being developed by a product team
-
Customer requests coming into a service desk
-
Requests from a development team to an infrastructure team for services (e.g., network or server configuration, consultations, etc.)
Queuing theory is an important branch of mathematics used extensively in computing, operations research, networking, and other fields. It is a topic getting much attention of late in the Agile and related movements, especially as it relates to digital product team productivity.
The amount of time that any given work item spends in the queue is proportional to how busy the servicing resource is. The simple formula, known as Little’s Law, is:
Wait time = (% Busy)/(% Idle)
In other words, if you divide the percentage of busy time for the resource by its idle time, you see the average wait time. So, if a resource is busy 40% of the days, but idle 60% of the days, the average time you wait for the resource is:
0.4/0.6= 0.67 hours (2/3 of a day)
Conversely, if a resource is busy 95% of the time, the average time you will wait is:
0.95/0.05 = 5.67 (19 days!)
If you use a graphing calculator, you see the results in Figure 54, “Time in Queue Increases Exponentially with Load”.
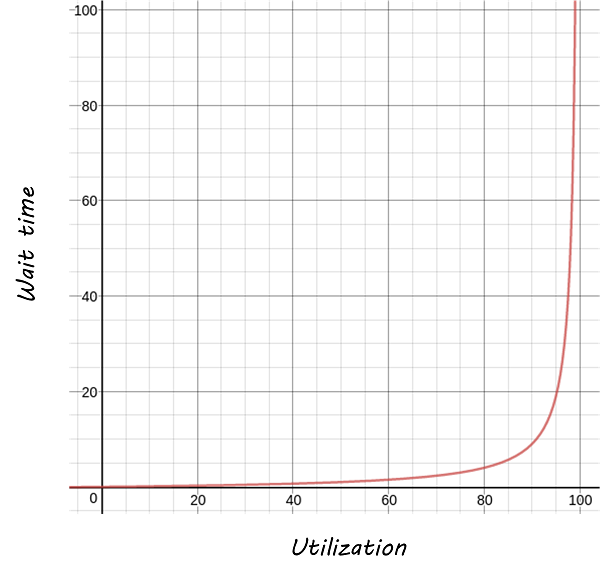
Notice how the wait time approaches infinity as the queue utilization approaches 100%. And yet, full utilization of resources is often sought by managers in the name of “efficiency”. These basic principles are discussed by Gene Kim et al. in The Phoenix Project [165], Chapter 23, and more rigorously by Don Reinertsen in The Principles of Product Development Flow [230], Chapter 3. A further complication is when work must pass through multiple queues; wait times for work easily expand to weeks or months. Such scenarios are not hypothetical, they are often seen in the real world and are a fundamental cause of IT organizations getting a bad name for being slow and unresponsive. Fortunately, Digital Practitioners are gaining insight into these dynamics and matters are improving across the industry.
Understanding queuing behavior is critical to productivity. Reinertsen suggests that poorly managed queues contribute to:
-
Longer cycle time
-
Increased risk
-
More variability
-
More overhead
-
Lower quality
-
Reduced motivation
These issues were understood by the pioneers of Lean manufacturing, an important movement throughout the 20th century. One of its central principles is to limit work-in-process. Work-in-process is obvious on a shop floor because physical raw materials (inventory) are quite visible.
Don Reinertsen developed the insight that product design and development had an invisible inventory of “work-in-process” that he called design-in-process. Just as managing physical work-in-process on the factory floor is key to a factory’s success, so correctly understanding and managing design-in-process is essential to all kinds of R&D organizations — including digital product development; e.g., building software(!). In fact, because digital systems are largely invisible even when finished, understanding their work-in-process is even more challenging.
It is easy and tempting for a product development team to accumulate excessive amounts of work-in-process. And, to some degree, having a rich backlog of ideas is an asset. But, just as some inventory (e.g., groceries) is perishable, so are design ideas. They have a limited time in which they might be relevant to a customer or a market. Therefore, accumulating too many of them at any point in time can be wasteful.
What does this have to do with queuing? Design-in-progress is one form of queue seen in the digital organization. Other forms include unplanned work (incidents and defects), implementation work, and many other concepts we will discuss in this chapter.
Regardless of whether it is a “requirement”, a “user story”, an “epic”, “defect", “issue”, or “service request”, you should remember it is all just work. It needs to be logged, prioritized, assigned, and tracked to completion. Queues are the fundamental concept for doing this, and it is critical that digital management specialists understand this.
6.2.2.1.9. Multi-Tasking
Multi-tasking (in this context) is when a human attempts to work on diverse activities simultaneously; for example, developing code for a new application while also handling support calls. There is broad agreement that multi-tasking destroys productivity, and even mental health [57]. Therefore, minimize multi-tasking. Multi-tasking in part emerges as a natural response when one activity becomes blocked (e.g., due to needing another team’s contribution). Approaches that enable teams to work without depending on outside resources are less likely to promote multi-tasking. Queuing and work-in-process therefore become even more critical topics for management concern as activities scale up.
6.2.2.1.10. Scrum, Kanban, or Both?
So, do you choose Scrum, Kanban, both, or neither? We can see in comparing Scrum and Kanban that their areas of focus are somewhat different:
-
Scrum is widely adopted in industry and has achieved a level of formalization, which is why Scrum training is widespread and generally consistent in content
-
Kanban is more flexible but this comes at the cost of more management overhead; it requires more interpretation to translate to a given organization’s culture and practices
-
As Scrum author Ken Rubin notes: “Scrum is not well suited to highly interrupt-driven work” [243]; Scrum on the service desk doesn’t work (but if your company is too small, it may be difficult to separate out interrupt-driven work; we will discuss the issues around interrupt-driven work further in Section 6.2.3, “Operations Management”)
-
Finally, hybrids exist (Ladas' “Scrumban” [172])
Ultimately, instead of talking too much about “Scrum” or “Kanban”, the student is encouraged to look more deeply into their fundamental differences. We will return to this topic in the section on Lean Product Development.
6.2.2.1.11. Lean Guidelines
-
Finish what you start, if you can, before starting anything else - when you work on three things at once, the multi-tasking wastes time, and it takes you three times longer to get any one of the things done (more on multi-tasking in this chapter)
-
Infinitely long to-do lists (backlog) sap motivation - consider limiting backlog as well as work-in-process
-
Visibility into work-in-process is important for the collective mental model of the team
There are deeper philosophical and cultural qualities to Kanban beyond workflow and queuing. Anderson and his colleagues continue to evolve Kanban into a more ambitious framework. Mike Burrows [48] identifies the following key principles:
-
Start with what you do now
-
Agree to pursue evolutionary change
-
Initially, respect current processes, roles, responsibilities, and job titles
-
Encourage acts of leadership at every level in your organization — from individual contributor to senior management
-
Visualize
-
Limit work-in-progress
-
Manage flow
-
Make policies explicit
-
Implement feedback loops
-
Improve collaboratively, evolve experimentally (using models and the scientific method)
Evidence of Notability
Work and task management is a fundamental problem in human organizations. It is the foundation of workflow and BPM. Lean generally is one of the most significant currents of thought in modern management [212, 307, 308, 239, 238]. Kanban is widely discussed at Agile and DevOps conferences. Using a lightweight, generalized task tracking tool, often physical, is seen in digital organizations worldwide.
Limitations
Kanban’s generalized workflow does not scale to complex processes with many steps and decision points. This will be covered further in the section on workflow management. Not all activities reduce well to a list of tasks. Some are more intangible and outcome-focused. As Bjarne Stroustrup, the inventor of C+, stated: "The idea of software development as an assembly line manned by semi-skilled interchangeable workers is fundamentally flawed and wasteful" +[271]. It is critical to distinguish Lean as applied to digital systems development (as a form of applied R&D) versus Lean in its manufacturing aspects. Reinertsen’s contributions ([229, 230]) are unique and notable in this regard and are discussed in the next section.
Related Topics
6.2.2.2. Lean Product Development
Description
One of the challenges with applying Lean to IT (as noted previously) is that many IT professionals (especially software developers) believe that manufacturing is a “deterministic” field, whose lessons don’t apply to developing technical products. “Creating software is like creating art, not being on an assembly line”, is one line of argument.
The root cause of this debate is the distinction between product development and production. It is true that an industrial production line - for example, producing forklifts by the thousands - may be repetitive. But how did the production line come to be? How was the forklift invented, or developed? It was created as part of a process of product development. It took mechanical engineering, electrical engineering, chemistry, materials science, and more. Combining fundamental engineering principles and techniques into a new, marketable product is not a repetitive process; it is a highly variable, creative process, and always has been.
One dead end that organizations keep pursuing is the desire to make R&D more “predictable"; that is, to reduce variation and predictably create innovation. This never works well; game-changing innovations are usually complex responses to complex market systems dynamics, including customer psychology, current trends, and many other factors. The process of innovating cannot, by its very nature, be made repeatable.
Developing innovative products and services drives the enterprise’s growth. The future enterprise’s performance is largely determined by the quality of product development. Products and services that fit market needs generate more profitable growth. Designing efficient product delivery processes determines up to 70% of your run or production costs.
Lean Product and Process Development (or LPPD) is not just applying Lean tools from the manufacturing floor to the LPPD environment. It is a unique set of principles, methods, and tools that build on the experience of enterprises such as Toyota, Ford, or Harley-Davidson.
The key characteristics of LPPD are:
-
Clear definition of value from a customer perspective to inform product development from start to finish
-
Chief Engineer system that integrates cross-functional expertise to architect a product that delivers value to customers and contributes to the economic success of the enterprise
-
Front-loading the development process to explore thoroughly alternative solutions while there is maximum design space
-
Set-Based Concurrent Engineering (SBCE) to facilitate the smooth integration of products' components
-
High degree of teamwork facilitated by the Obeya process
-
Knowledge and responsibility-based approach with planned learning cycles
-
Levelled workload through Cadence, Pull, and Flow
6.2.2.2.1. Define Value from a Customer Perspective
One of the Lean Product Development practices is "Go & See". Instead of relying on secondary information such as market studies or marketing reports (as also discussed in Product Discovery), product team members are encouraged to experience first hand customers' needs, problems, and emotions. For example, one of the Toyota Chief Engineers rented a car in Canada and drove for several months in the winter time to understand the unique needs of the Canadian driver. Design thinking possibly combined with anthropological approaches help understand value from a customer’s perspective.
6.2.2.2.2. The Chief Engineer System
Toyota’s Chief Engineers are not program managers who focus on controlling and reporting development activities. They are leaders who create and communicate a compelling and feasible vision. They define a clear and logical architecture for the product and value stream. Their T-shaped profile gives them enough understanding of the various disciplines at play so they can help solve cross-disciplinary problems. Chief Engineers are accountable for the economic success of their products. Last but not the least, their leadership skills help them inspire excellent engineers. The Chief Engineer does not have formal authority on the teams that develop the product. Team members report to functional department heads. New Agile at scale organizational models such as the Spotify model are similar with teams members reporting to chapters or guilds and not squad leaders. The Product Owner plays a role comparable to the Chief Engineer’s one at a smaller scale.
6.2.2.2.3. Front Load the Development Process
Poor decisions made early in the development process have negative consequences that increase exponentially over time because reversing them later in the lifecycle becomes more and more difficult. Amazon CEO Jeff Bezos classifies decisions into type 1 and type 2 categories [35]. Type 1 decisions are not reversible, and you have to be very careful making them. Type 2 decisions are like walking through a door — if you don’t like the decision, you can always go back. Because type 1 decisions are difficult to reverse, alternatives should be thoroughly explored before the final decision is made. This tendency to front load the development process could slow the development process.
6.2.2.2.4. Set-Based Concurrent Engineering
Set-Based Concurrent Engineering or SBCE makes front loading compatible with short product development lead times. Instead of focusing on the rapid completion of individual component designs in isolation, SBCE looks at how individual designs will interact within a system before the design is complete. The focus is on system integration before individual design completion. The concurrent nature of the design process contributes to shortening product development lead time while front loading combined with the integration focus helps minimize bad design decisions which would at the end slow the development process and increase "non-quality". A good metaphor for SBCE is doodle.com which offers a much better way of scheduling a meeting compared to the old iterative "point-based" way of finding a time that works for all.
6.2.2.2.5. The Obeya Process
We introduced the concept of Andon previously. Lean Product Development has a similar practice, Obeya. The Obeya process begins with the entire team posting in a physical room visual artifacts representing the product’s components. Product component owners are responsible for posting status information such as timing, issues, key design questions, etc. Because the information is shared in a transparent manner, useful conversations are elicited. When problems are identified they are analyzed using problem solving approaches such as PDCA and A3. Collocation greatly intensifies communication and helps solve problems earlier. One of the advantages of the Obeya process is that it does not force the enterprise to change its departmental organization or to co-locate hundreds of engineers. When an Obeya room cannot be set up at the same place, virtual ones can be created using specialized collaborative software. The Obeya process proved to be a critical element of the Toyota product development system helping radically reduce lead time.
6.2.2.2.6. Knowledge and Responsibility-Based
Traditional task-based project management is based on tasks completed and not on technical results. Because project managers do not understand the reality that hides behind the Gantt chart, problems can remain hidden for a long time. In contrast, the Chief Engineer defines integrating events at fixed dates. Required results are communicated to responsible engineers who are free to plan and organize as needed to meet these dates and deliver expected results. Top-down detailed planning and control is replaced by top-down objectives, the detailed planning and execution being delegated to autonomous teams. The responsibility style helps develop a learning development organization. Bureaucracy is eliminated and the creation of useful knowledge encouraged.
6.2.2.2.7. Levelled Workload through Cadence, Pull, and Flow
Unevenness (Mura) and overburden (Muri) are root causes of waste (Muda) in both production and development value streams. In the context of LPPD work should be released in the organization on a regular cadence in order to level the workload. Integrating events gives freedom to developers to plan their work to meet those events. In this way development work is pulled (as covered in the Kanban discussion) rather than scheduled. Similarly information is pulled by developers based on what they need to know rather than being pushed according to some centrally planned schedule. Don Reinertsen, the author of The Principles of Product Development Flow, proposes a method to maximize the economic benefit of a portfolio of projects. The key idea is that the sequencing of projects should consider both the cost of delay of each project and the amount of time that the project will block scarce development resources. This approach is known as a Weighted Shortest Job First (WSJF) queueing discipline. It has influenced the Agile community; SAFe specifies WSJF to prioritize backlogs.
6.2.2.2.8. Reinertsen’s Product Flow Model
In IT, simply developing software for a new problem (or even new software for an old problem) is an R&D problem, not a production line problem. It is iterative, uncertain, and risky, just like other forms of product development. That does not mean it is completely unmanageable, or that its creation is a mysterious, artistic process. It is just a more variable process with a higher chance of failure, and with a need to incorporate feedback quickly to reduce the risk of open-loop control failure. These ideas are well known to the Agile community and its authors. However, there is one thought leader who stands out in this field: an ex-Naval officer and nuclear engineer named Donald Reinertsen who was introduced in our previous discussions on beneficial variability in product discovery and queuing.
Reinertsen’s work dates back to 1991, and (originally as a co-author with Preston G. Smith) presaged important principles of the Agile movement [263], from the general perspective of product development. Reinertsen’s influence is well documented and notable. He was partnering with David Anderson when Anderson created the “software Kanban” approach. He wrote the introduction to Leffingwell’s Agile Software Requirements, the initial statement of SAFe. His influence is pervasive in the Agile community. His work is deep and based on fundamental mathematical principles such as queueing theory. His work can be understood as a series of interdependent principles:
-
The flow or throughput of product innovation is the primary driver of financial success (notice that innovation must be accepted by the market — simply producing a new product is not enough)
-
Product development is essentially the creation of information
-
The creation of information requires fast feedback
-
Feedback requires limiting work-in-process
-
Limiting work-in-process in product design contexts requires rigorous prioritization capabilities
-
Effective, economical prioritization requires understanding the cost of delay for individual product features
-
Understanding cost of delay requires smaller batch sizes, consisting of cohesive features, not large projects (this supporting point to Reinertsen’s work was introduced by Josh Arnold [22])
These can be summarized as in Figure 55, “Lean Product Development Hierarchy of Concerns”.
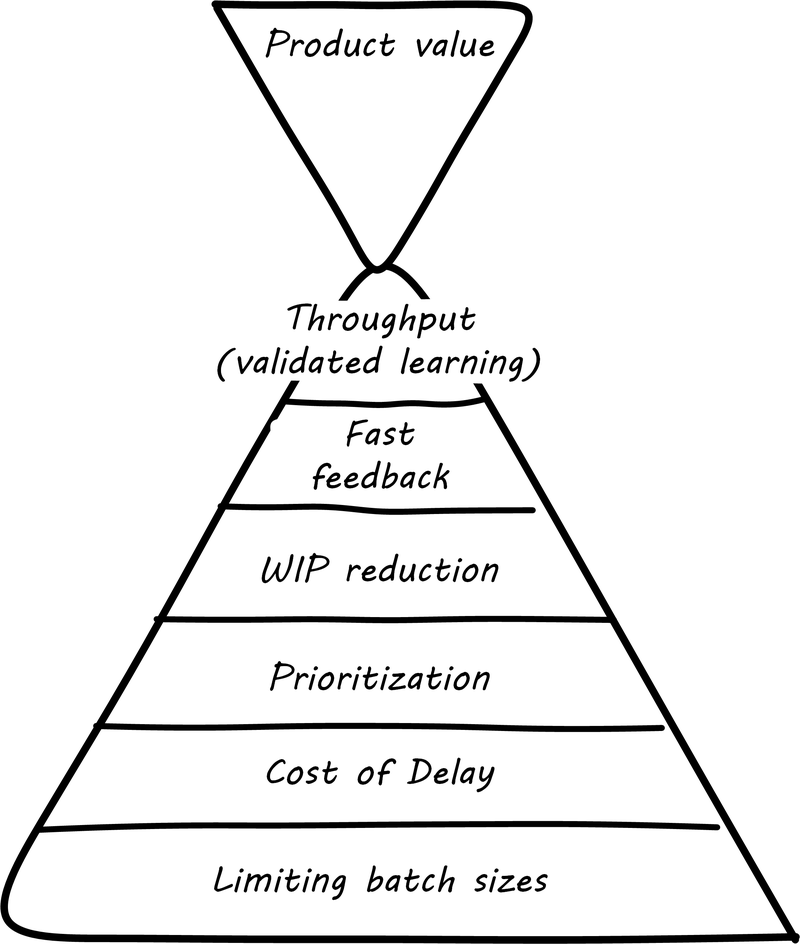
If a company wishes to innovate faster than competitors, it requires fast feedback on its experiments (whether traditionally understood, laboratory-based experiments, or market-facing validation as in Lean Startup. In order to achieve fast feedback, work-in-process must be reduced in the system, otherwise high-queue states will slow feedback down.
But how do we reduce work-in-process? We have to prioritize. Do we rely on the HiPPO, or do we try something more rational? This brings us to the critical concept of cost of delay.
6.2.2.2.9. Cost of Delay
Don Reinertsen is well known for advocating the concept of “cost of delay” in understanding product economics. The term is intuitive; it represents the loss experienced by delaying the delivery of some value. For example, if a delayed product misses a key trade show, and therefore its opportunity for a competitive release, the cost of delay might be the entire addressable market. Understanding cost of delay is part of a broader economic emphasis that Reinertsen brings to the general question of product development. He suggests that product developers, in general, do not understand the fundamental economics of their decisions regarding resources and work-in-process.
In order to understand the cost of delay, it is first necessary to think in terms of a market-facing product (such as a smartphone application). Any market-facing product can be represented in terms of its lifecycle revenues and profits (see Table 7, “Product Lifecycle Economics by Year”, Figure 56, “Product Lifecycle Economics, Charted”).
| Year | Annual Cost | Annual Revenue | Annual Profit | Cumulative Profit |
|---|---|---|---|---|
Year 1 |
100 |
0 |
–100 |
–100 |
Year 2 |
40 |
80 |
40 |
–60 |
Year 3 |
30 |
120 |
90 |
30 |
Year 4 |
25 |
150 |
125 |
155 |
Year 5 |
25 |
90 |
65 |
220 |
Year 6 |
20 |
60 |
40 |
260 |
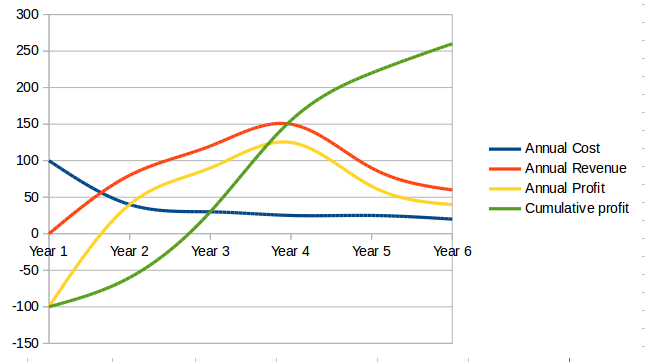
The numbers above represent a product lifecycle, from R&D through production to retirement. The first year is all cost, as the product is being developed, and net profits are negative. In year 2, a small net profit is shown, but cumulative profit is still negative, as it remains in year 3. Only into year 3 does the product break even, ultimately achieving lifecycle net earnings of 175. But what if the product’s introduction into the market is delayed? The consequences can be severe.
Simply delaying delivery by a year, all things being equal in our example, will reduce lifecycle profits by 30% (see Table 8, “Product Lifecycle, Simple Delay”, Figure 57, “Product Lifecycle, Simple Delay, Charted”).
| Year | Annual Cost | Annual Revenue | Annual Profit | Cumulative Profit |
|---|---|---|---|---|
Year 1 |
100 |
0 |
–100 |
–100 |
Year 2 |
40 |
0 |
–40 |
–140 |
Year 3 |
30 |
80 |
50 |
–90 |
Year 4 |
25 |
120 |
95 |
5 |
Year 5 |
25 |
150 |
125 |
130 |
Year 6 |
20 |
90 |
70 |
200 |
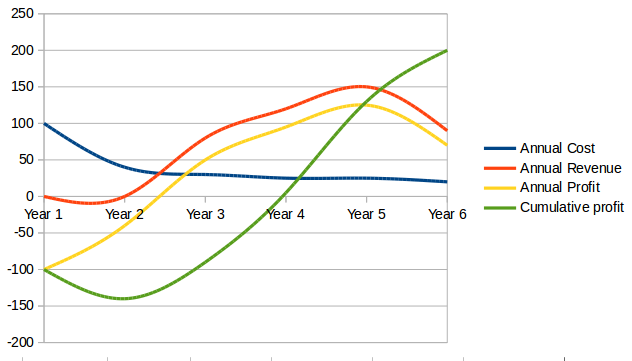
But all things are not equal. What if, in delaying the product for a year, we allow a competitor to gain a superior market position? That could depress our sales and increase our per-unit costs — both bad (see Table 9, “Product Lifecycle, Aggravated Delay”, Figure 58, “Product Lifecycle, Aggravated Delay, Charted”).
| Year | Annual Cost | Annual Revenue | Annual Profit | Cumulative Profit |
|---|---|---|---|---|
Year 1 |
100 |
0 |
–100 |
–100 |
Year 2 |
40 |
0 |
–40 |
–140 |
Year 3 |
35 |
70 |
35 |
–105 |
Year 4 |
30 |
100 |
70 |
–35 |
Year 5 |
30 |
120 |
90 |
55 |
Year 6 |
25 |
80 |
55 |
110 |
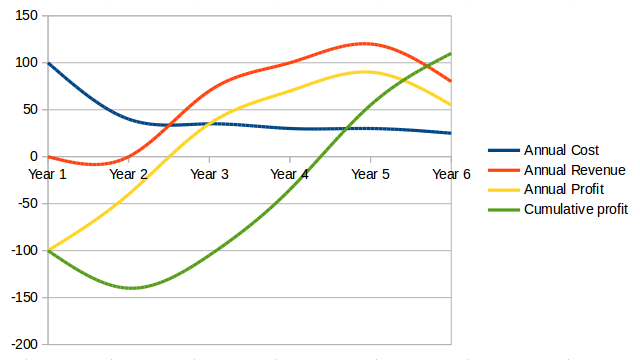
The advanced cost of delayed analysis argues that different product lifecycles have different characteristics. Josh Arnold of Black Swan Farming has visualized these as a set of profiles [22]. See Figure 59, “Simple Cost of Delay” (similar to [22]) for the simple delay profile.
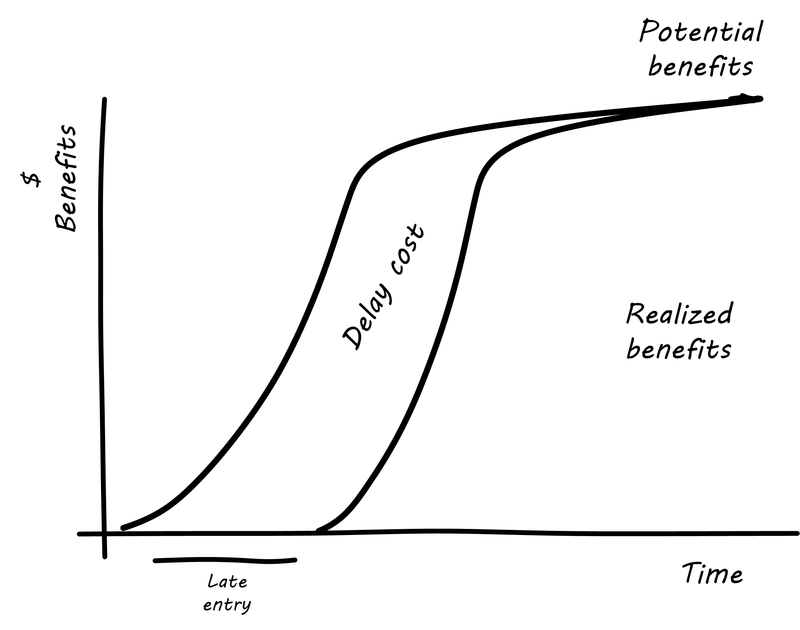
In this delay curve, while profits and revenues are lost due to late entry, it is assumed that the product will still enjoy its expected market share. We can think of this as the “iPhone versus Android” profile, as Android was later but still achieved market parity. The aggravated cost of delay profile, however, looks like Figure 60, “Aggravated Cost of Delay” (similar to [22]).
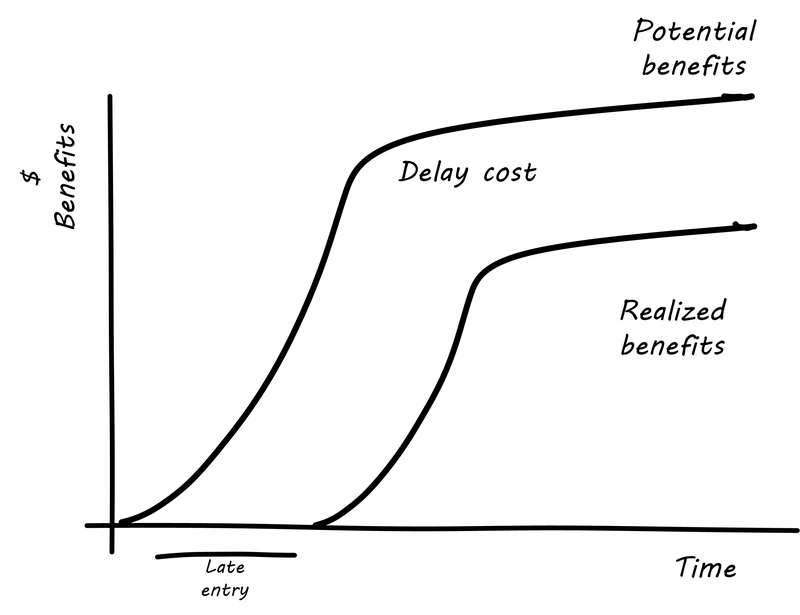
In this version, the failure to enter the market in a timely way results in long-term loss of market share. We can think of this as the “Amazon Kindle™ versus Barnes & Noble Nook” profile, as the Nook has not achieved parity, and does not appear likely to. There are other delay curves imaginable, such as delay curves for tightly time-limited products (e.g., such as found in the fashion industry) or cost of delay that is only incurred after a specific date (such as in complying with a regulation).
Reinertsen observes that product managers may think that they intuitively understand cost of delay, but when he asks them to estimate the aggregate cost of (for example) delaying their product’s delivery by a given period of time, the estimates provided by product team participants in a position to delay delivery may vary by up to 50:1. This is powerful evidence that a more quantitative approach is essential, as opposed to relying on “gut feel” or the HiPPO.
Finally, Josh Arnold notes that cost of delay is much easier to assess on small batches of work. Large projects tend to attract many ideas for features, some of which have stronger economic justifications than others. When all these features are lumped together, it makes understanding the cost of delay a challenging process, because it then becomes an average across the various features. But since features, ideally, can be worked on individually, understanding the cost of delay at that level helps with the prioritization of the work.
The combination of product roadmapping, a high-quality DEEP backlog, and cost of delay is a solid foundation for digital product development. It is essential to have an economic basis for making the prioritization decision. Clarifying the economic basis is a critical function of the product roadmap. Through estimation of story points, we can understand the team’s velocity. Estimating velocity is key to planning, which we will discuss further in Section 6.3.2, “Investment and Portfolio”. Through understanding the economics of product availability to the market or internal users, the cost of delay can drive backlog prioritization.
Evidence of Notability
Lean influences on software development and the management of digital systems are the subject of conference talks, books, and articles, and much other evidence demonstrating an engaged community of interest. Notable works include [165, 20, 221, 27, 230].
Limitations
Lean has broad applicability but the nature of the digital work must be understood carefully. Classic Lean applies well to less-variable operational work in digital systems. Developing new digital systems requires Lean Product Development principles, and some aspects of classic Lean (e.g., always reducing variability) are less applicable or may even be harmful. See, for example, [230] for further discussion (Chapter 4, "The Economics of Product Development Variability").
Related Topics
6.2.2.3. Work Management Capabilities and Approaches
Description
As a digital product starts to gain a user base, and as a company matures and grows, there emerges a need for human-to-human support. This is typically handled by a help desk or service desk, serving as the human face of IT when the IT systems are not meeting people’s expectations. We were first briefly introduced to the concept in our Service Lifecycle (see Figure 11, “The Essential States of the Digital Product”).
The service desk is an interrupt-driven, task-oriented capability. It serves as the first point of contact for IT services that require some human support or intervention. As such, its role can become broad from provisioning access to assisting users in navigation and usage, to serving as an alert channel for outage reporting. The service desk ideally answers each user’s request immediately, requiring no follow-up. If follow-up is required, a “ticket” is “issued”.
As a “help desk”, it may be focused on end-user assistance and reporting incidents. As a “service desk”, it may expand its purview to accepting provisioning or other requests of various types (and referring and tracking those requests). Note that in some approaches, service request and incident are considered to be distinct processes.
The term "ticket” dates to paper-based industrial processes, where the “help desk” might actually be a physical desk, where a user seeking services might be issued a paper ticket. Such “tickets” were also used in field services.
In IT-centric domains, tickets are virtual; they are records in databases, not paper. The user is given a ticket “ID” or “number” for tracking (e.g., so they can inquire about the request’s status). The ticket may be “routed” to someone to handle, but again in a virtual world what really happens is that the person it is routed to is directed to look at the record in the database. (In paper-based processes, the ticket might well be moved physically to various parties to perform the needed work.)
A service desk capability needs:
-
Channels for accepting contacts (e.g., telephone, email, chat)
-
Staffing appropriate to the volume and nature of those requests
-
Robust workflow capabilities to track their progress
-
Routing and escalation mechanisms, since clarifying the true nature of contacts and getting them serviced by the most appropriate means are non-trivial challenges
Work management in practice has divided between development and operations practices and tools. However, DevOps and Kanban are forcing a reconsideration and consolidation. Historically, here are some of the major tools and channels through which tasks and work are managed on both sides:
| Development | Operations |
|---|---|
User story tracking system |
Service or help desk ticketing system |
Issue/risk/action item log |
Incident management system |
Defect tracker |
Change management system |
All of these systems have common characteristics. All can (or should) be able to:
-
Register a new task
-
Describe the work to be done (development or break/fix/remediate)
-
Represent the current status of the work
-
Track who is currently accountable for it (individual and/or team)
-
Indicate the priority of the work, at least in terms of a simple categorization such as high/medium/low
More advanced systems may also be able to:
-
Link one unit of work to another (either as parent/child or peer-to-peer)
-
Track the effort spent on the work
-
Prioritize and order work
-
Track the referral or escalation trail of the work, if it is routed to various parties
-
Link to communication channels such as conference bridges and paging systems
The first automated system (computer-based) you may find yourself acquiring along these lines is a help desk system. You may be a small company, but when you start to build a large customer base, keeping them all happy requires more than a manual, paper-based card wall or Kanban board.
6.2.2.4. Towards Process Management
The Kanban board has started to get complicated (see Figure 61, “Medium-Complex Kanban Board”, loosely based on Image from [171]). We are witnessing an increasing amount of work that needs to follow a sequence, or checklist, for the sake of consistency.
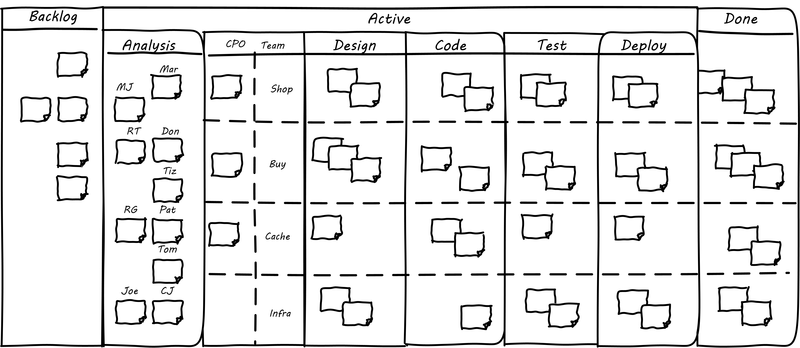
Process management is when we need to start managing:
-
Multiple
-
Repeatable
-
Measurable sequences of activity
-
Considering their interdependencies
-
Perhaps using common methods to define them
-
And even common tooling to support multiple processes
6.2.2.4.1. Process Basics
We have discussed some of the factors leading to the need for process management, but we have not yet come to grips with what it is. To start, think of a repeatable series of activities, such as when a new employee joins (see Figure 62, “Simple Process Flow”).
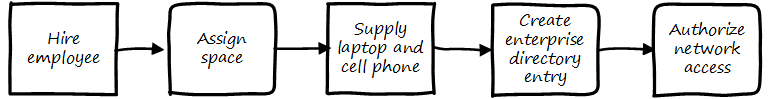
Process management can represent conditional logic (see Figure 63, “Conditionality”).
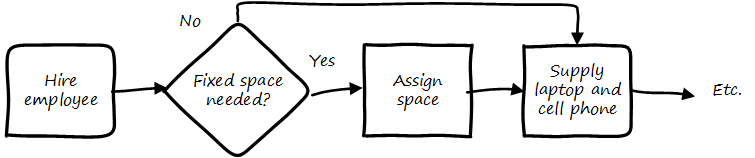
Process models can become extremely intricate, and can describe both human and automated activity. Sometimes, the process simply becomes too complicated for humans to follow. Notice how different the process models are from the card wall or Kanban board. In Kanban, everything is a work item, and the overall flow is some simple version of “to do, doing, done”. This can become complex when the flow gets more elaborate (e.g., various forms of testing, deployment checks, etc.). In a process model, the activity is explicitly specified on the assumption it will be repeated. The boxes representing steps are essentially equivalent to the columns on a Kanban board, but since sticky notes are not being used, process models can become very complex — like a Kanban board with dozens or hundreds of columns! Process management as a practice is discussed extensively in Context III. However, before we move on, two simple variations on process management are:
-
Checklists
-
Case Management
6.2.2.4.2. The Checklist Manifesto
The Checklist Manifesto is the name of a notable book by author/surgeon Atul Gawande [109]. The title can be misleading; the book in no way suggests that all work can be reduced to repeatable checklists. Instead, it is an in-depth examination of the relationship between standardization and complexity. Like Case Management, it addresses the problem of complex activities requiring professional judgment.
Unlike Case Management (discussed below), it explores more time-limited and often urgent activities such as flight operations, large-scale construction, and surgery. These activities, as a whole, cannot be reduced to one master process; there is too much variation and complexity. However, within the overall bounds of flight operations, or construction, or surgery, there are critical sequences of events that must be executed, often in a specific order. Gawande discusses the airline industry as a key exemplar of this. Instead of one “master checklist” there are specific, clear, brief checklists for a wide variety of scenarios, such as a cargo hold door becoming unlatched.
There are similarities and differences between core BPM approaches and checklists. Often, BPM is employed to describe processes that are automated and whose progress is tracked in a database. Checklists, on the other hand, may be more manual, intended for use in a closely collaborative environment (such as an aircraft cockpit or operating room), and may represent a briefer period of time.
Full process management specifies tasks and their flow in precise detail. We have not yet got to that point with our Kanban board, but when we start adding checklists, we are beginning to differentiate the various processes at a detailed level. We will revisit Gawande’s work in Context III with the coordination technique of the submittal schedule.
6.2.2.4.3. Case Management
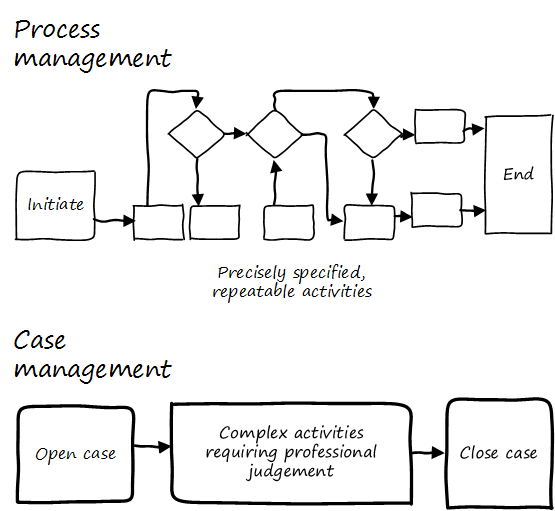
|
Note
|
Do not confuse “Case” here with Computer Assisted Software Engineering. |
Case Management is a concept used in medicine, law, and social services. Case Management can be thought of as a high-level process supporting the skilled knowledge worker applying their professional expertise. Cases are another way of thinking about the relationship between the Kanban board and process management (see Figure 64, “Process Management versus Case Management”).
IT consultant and author Rob England contrasts “Case Management” with “Standard Process” in his book Plus! The Standard+Case Approach: See Service Response in a New Light [94]. Some processes are repeatable and can be precisely standardized, but it is critical for anyone working in complex environments to understand the limits of a standardized process. Sometimes, a large “case” concept is sufficient to track the work. The downside may be that there is less visibility into the progress of the case — the person in charge of it needs to provide a status that can’t be represented as a simple report. We will see process management again in Section 6.2.3, “Operations Management” in our discussion of operational process emergence.
Evidence of Notability Workflow management in the basic emergent sense is a key precursor to full BPM. See, for example, [255].
Limitations Not all work can or should be reduced to a procedural paradigm. Higher-touch, more variable services and R&D work require different approaches, such as Case Management.
Related Topics
6.2.2.5. Systems Thinking and Feedback
Description
So, what is a system? A system is a set of things - people, cells, molecules, or whatever - interconnected in such a way that they produce their own pattern of behavior over time. The system may be buffeted, constricted, triggered, or driven by outside forces. But the system’s response to these forces is characteristic of itself, and that response is seldom simple in the real world.
Thinking in Systems
Systems thinking, and systems theory, are broad topics extending far beyond IT and the digital profession. Meadows defines a system as: “an interconnected set of elements that is coherently organized in a way that achieves something” [1]. Systems are more than the sum of their parts; each part contributes something to the greater whole, and often the behavior of the greater whole is not obvious from examining the parts of the system.
Systems thinking is an important influence on digital management. Digital systems are complex, and when the computers and software are considered as a combination of the people using them, we have a sociotechnical system. Digital systems management seeks to create, improve, and sustain these systems.
A digital management capability is itself a complex system. While the term “Information Systems (IS)” was widely replaced by “Information Technology (IT)” in the 1990s, do not be fooled. Enterprise IT is a complex sociotechnical system, that delivers the digital services to support a myriad of other complex sociotechnical systems.
The Merriam-Webster dictionary defines a system as: “a regularly interacting or interdependent group of items forming a unified whole". These interactions and relationships quickly take center stage as the focus moves from individual work to team efforts. Consider that while a two-member team only has one relationship to worry about, a ten-member team has 45, and a 100-person team has 4,950!
6.2.2.5.1. A Brief Introduction to Feedback
The harder you push, the harder the system pushes back.
The Fifth Discipline
As the Senge quote implies, brute force does not scale well within the context of a system. One of the reasons for systems stability is feedback. Within the bounds of the system, actions lead to outcomes, which in turn affect future actions. This is a positive thing, as it is required to keep a complex operation on course.
Feedback is a problematic term. We hear terms like positive feedback and negative feedback and associate such usage with performance coaching and management discipline. That is not the sense of feedback in this document. The definition of feedback as used in this document is based on engineering and control theory.
Figure 65, “Reinforcing Feedback Loop” illustrates the classic illustration of a reinforcing feedback loop.
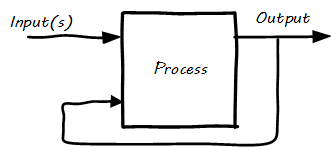
For example (as in Figure 66, “Reinforcing (Positive?) Feedback, with Rabbits”), “rabbit reproduction” can be considered as a process with a reinforcing feedback loop.
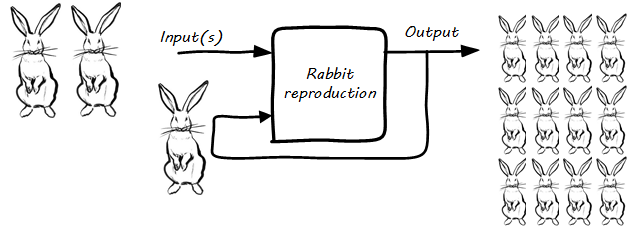
The more rabbits, the faster they reproduce, and the more rabbits. This is sometimes called a “positive” feedback loop, although the local gardener may not agree. This is why feedback experts (e.g., [268]) prefer to call this “reinforcing” feedback because there is not necessarily anything “positive” about it.
We can also consider feedback as the relationship between two processes (see Figure 67, “Feedback Between Two Processes”).
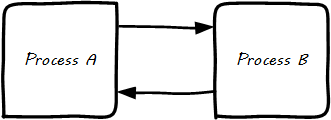
In the example, what if Process B is fox reproduction; that is, the birth rate of foxes (who eat rabbits) (see Figure 68, “Balancing (Negative?) Feedback, with Rabbits and Foxes”)?

More rabbits equal more foxes (notice the “+” symbol on the line) because there are more rabbits to eat! But what does this do to the rabbits? It means fewer rabbits (the “--” on the line). Which, ultimately, means fewer foxes, and at some point, the populations balance. This is classic negative feedback. However, the local gardeners and foxes don’t see it as negative. That is why feedback experts prefer to call this “balancing” feedback. Balancing feedback can be an important part of a system’s overall stability.
6.2.2.5.2. What does Systems Thinking Have to do with IT?
In an engineering sense, positive feedback is often dangerous and a topic of concern. A recent example of bad positive feedback in engineering is the London Millennium Bridge. On opening, the Millennium Bridge started to sway alarmingly, due to resonance and feedback which caused pedestrians to walk in cadence, increasing the resonance issues. The bridge had to be shut down immediately and retro-fitted with $9 million worth of tuned dampers [75].
As with bridges, at a technical level, reinforcing feedback can be a very bad thing in IT systems. In general, any process that is self-amplified without any balancing feedback will eventually consume all available resources, just like rabbits will eat all the food available to them. So, if you create a process (e.g., write and run a computer program) that recursively spawns itself, it will sooner or later crash the computer as it devours memory and CPU. See runaway processes.
Balancing feedback, on the other hand, is critical to making sure you are “staying on track”. Engineers use concepts of control theory; for example, damping, to keep bridges from falling down.
Section 6.1.1, “Digital Fundamentals” covered the user’s value experience, and also how services evolve over time in a lifecycle. In terms of the dual-axis value chain, there are two primary digital value experiences:
-
The value the user derives from the service (e.g., account lookups, or a flawless navigational experience)
-
The value the investor derives from monetizing the product, or comparable incentives (e.g., non-profit missions)
Additionally, the product team derives career value. This becomes more of a factor later in the game. We will discuss this further in Section 6.3.1, “Coordination and Process” — on organization — and Context IV, on architecture lifecycles and technical debt.
The product team receives feedback from both value experiences. The day-to-day interactions with the service (e.g., help desk and operations) are understood, and (typically on a more intermittent basis) the portfolio investor also feeds back the information to the product team (the boss’s boss comes for a visit).
Balancing feedback in a business and IT context takes a wide variety of forms:
-
The results of a product test in the marketplace; for example, users' preference for a drop down box versus checkboxes on a form
-
The product owner clarifying for developers their user experience vision for the product, based on a demonstration of developer work-in-process
-
The end users calling to tell you the “system is slow” (or down)
-
The product owner or portfolio sponsor calling to tell you they are not satisfied with the system’s value
In short, we see these two basic kinds of feedback:
-
Positive/reinforcing, “do more of that”
-
Negative/balancing, “stop doing that”, “fix that”
The following should be considered:
-
How you are accepting and executing on feedback signals?
-
How is the feedback relationship with investors evolving, in terms of your product direction?
-
How is the feedback relationship with users evolving, in terms of both operational criteria and product direction?
One of the most important concepts related to feedback, one we will keep returning to, is that product value is based on feedback. We have discussed Lean Startup, which represents a feedback loop intended to discover product value. Don Reinertsen has written extensively on the importance of fast feedback to the product discovery process.
6.2.2.5.3. Reinforcing Feedback: The Special Case Investors Want
At a business level, there is a special kind of reinforcing feedback that defines the successful business (see Figure 69, “The Reinforcing Feedback Businesses Want”).

This is reinforcing feedback and positive for most people involved: investors, customers, employees. At some point, if the cycle continues, it will run into balancing feedback:
-
Competition
-
Market saturation
-
Negative externalities (regulation, pollution, etc.)
6.2.2.5.4. Open versus Closed-Loop Systems
Finally, we should talk briefly about open-loop versus closed-loop systems.
-
Open-loop systems have no regulation, no balancing feedback
-
Closed-loop systems have some form of balancing feedback
In navigation terminology, the open-loop attempt to stick to a course without external information (e.g., navigating in the fog, without radar or communications) is known as "dead reckoning", in part because it can easily get you dead!
A good example of an open-loop system is the children’s game “pin the tail on the donkey” (see Figure 70, “Pin the Tail on the Donkey”[4]). In “pin the tail on the donkey”, a person has to execute a process (pinning a paper or cloth “tail” onto a poster of a donkey — no live donkeys are involved!) while blindfolded, based on their memory of their location (and perhaps after being deliberately disoriented by spinning in circles). Since they are blindfolded, they have to move across the room and pin the tail without the ongoing corrective feedback of their eyes. (Perhaps they are getting feedback from their friends, but perhaps their friends are not reliable.)

Without the blindfold, it would be a closed-loop system. The person would rise from their chair and, through the ongoing feedback of their eyes to their central nervous system, would move towards the donkey and pin the tail in the correct location. In the context of a children’s game, the challenges of open-loop may seem obvious, but an important aspect of IT management over the past decades has been the struggle to overcome open-loop practices. Reliance on open-loop practices is arguably an indication of a dysfunctional culture. An IT team that is designing and delivering without sufficient corrective feedback from its stakeholders is an ineffective, open-loop system. Mark Kennaley [164] applies these principles to software development in much greater depth, and is recommended.
Engineers of complex systems use feedback techniques extensively. Complex systems do not work without them.
6.2.2.5.5. OODA
After the Korean War, the US Air Force wished to clarify why its pilots had performed in a superior manner to the opposing pilots who were flying aircraft viewed as more capable. A colonel named John Boyd was tasked with researching the problem. His conclusions are based on the concept of feedback cycles, and how fast humans can execute them. Boyd determined that humans go through a defined process in building their mental model of complex and dynamic situations. This has been formalized in the concept of the OODA loop (see Figure 71, “OODA Loop”[5]).
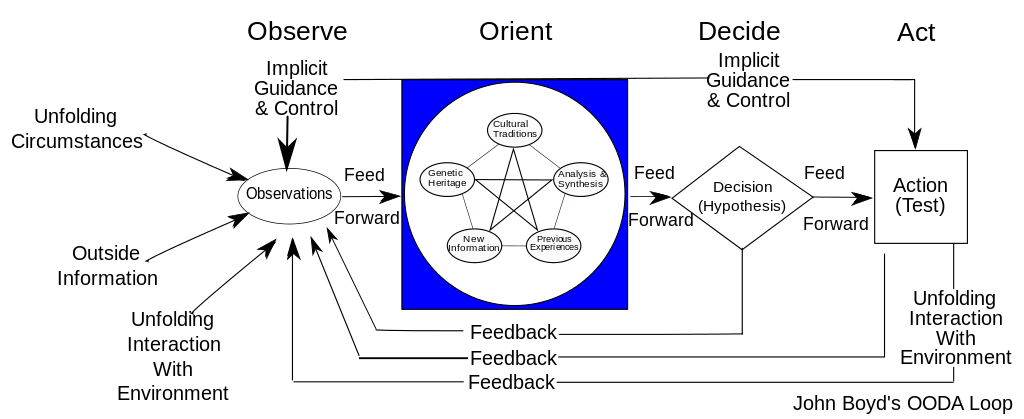
OODA stands for:
-
Observe
-
Orient
-
Decide
-
Act
Because the US fighters were lighter, more maneuverable, and had better visibility, their pilots were able to execute the OODA loop more quickly than their opponents, leading to victory. Boyd and others have extended this concept into various other domains including business strategy. The concept of the OODA feedback loop is frequently mentioned in presentations on Agile methods. Tightening the OODA loop accelerates the discovery of product value and is highly desirable.
6.2.2.5.6. The DevOps Consensus as Systems Thinking
We covered continuous delivery and introduced DevOps in Competency Area 3. Systems theory provides us with powerful tools to understand these topics more deeply.
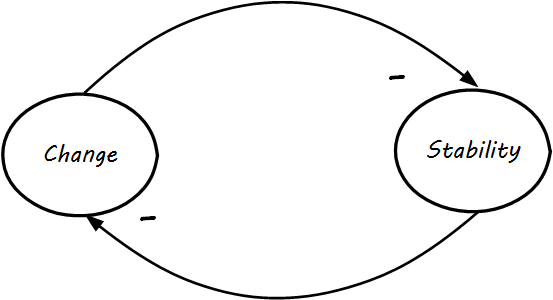
One of the assumptions we encounter throughout digital management is the idea that change and stability are opposing forces. In systems terms, we might use a diagram like Figure 72, “Change versus Stability” (see [33] for original exploration]). As a Causal Loop Diagram (CLD), it is saying that change and stability are opposed — the more we have of one, the less we have of the other. This is true, as far as it goes — most systems issues occur as a consequence of change; systems that are not changed in general do not crash as much.
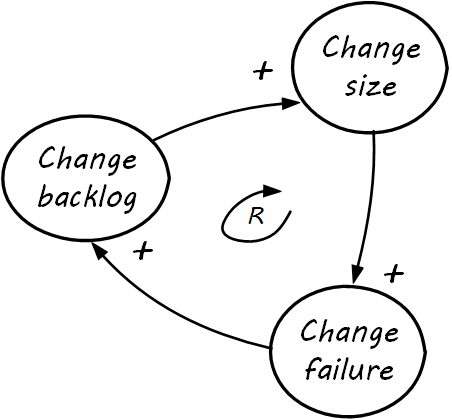
The trouble with viewing change and stability as diametrically opposed is that change is inevitable. If simple delaying tactics are put in, these can have a negative impact on stability, as in Figure 73, “Change Vicious Cycle”. What is this diagram telling us? If the owner of the system tries to prevent change, a larger and larger backlog will accumulate. This usually results in larger and larger-scale attempts to clear the backlog (e.g., large releases or major version updates). These are riskier activities which increase the likelihood of change failure. When changes fail, the backlog is not cleared and continues to increase, leading to further temptation for even larger changes.
How do we solve this? Decades of thought and experimentation have resulted in continuous delivery and DevOps, which can be shown in terms of system thinking in Figure 74, “The DevOps Consensus”.
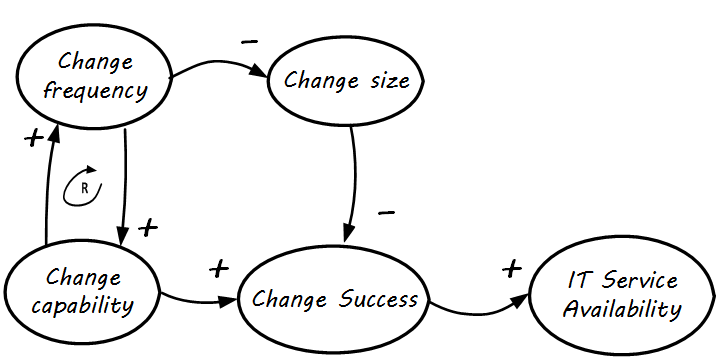
To summarize a complex set of relationships:
-
As change occurs more frequently, it enables smaller change sizes
-
Smaller change sizes are more likely to succeed (as change size goes up, change success likelihood goes down; hence, it is a balancing relationship)
-
As change occurs more frequently, organizational learning happens (change capability); this enables more frequent change to occur, as the organization learns
-
This has been summarized as: “if it hurts, do it more” (Martin Fowler in [92]).
-
-
The improved change capability, coupled with the smaller perturbations of smaller changes, together result in improved change success rates
-
Improved change success, in turn, results in improved system stability and availability, even with frequent changes; evidence supporting this de facto theory is emerging across the industry and can be seen in cases presented at the DevOps Enterprise Summit and discussed in The DevOps Handbook [166]
Notice the reinforcing feedback loop (the “R” in the looped arrow) between change frequency and change capability. Like all diagrams, this one is incomplete. Just making changes more frequently will not necessarily improve the change capability; a commitment to improving practices such as monitoring, automation, and so on is required, as the organization seeking to release more quickly will discover.
Evidence of Notability
Discussions of systems thinking, feedback, and OODA occur repeatedly throughout IT and digital management literature; e.g., ITIL’s Service Strategy volume [282] and The DevOps Handbook [166].
Limitations
Systems thinking is an advanced and somewhat theoretical topic, and discussions of it should carefully consider the audience.
Related Topics
6.2.3. Operations Management
|
Note
|
Although this Competency Area is titled “operations management” it also brings in infrastructure engineering at a higher level, assuming that the product is continuing to scale up. This is consistent with industry usage. |
Area Description
As the digital product gains more use, running it becomes a distinct concern from building it. For all their logic, computers are still surprisingly unreliable. Servers running well-tested software may remain “up” for weeks, and then all of a sudden hang and have to be rebooted. Sometimes it is clear why (for example, a log file filled up that no-one expected) and in other cases, there just is no explanation.
Engineering and operating complex IT-based distributed systems is a significant challenge. Even with Infrastructure as Code and automated continuous delivery pipelines, operations as a class of work is distinct from software development per se. The work is relatively more interrupt-driven, as compared to the “heads-down” focus on developing new features. Questions about scalability, performance, caching, load balancing, and so forth usually become apparent first through feedback from the operations perspective — whether or not there is a formal operations “team”.
The assumption here is still just one team with one product, but with this last Competency Area of Context II, the assumption is that there is considerable use of the product. With today’s technology, correctly deployed and operated, even a small team can support large workloads. This does not come easily, however. Systems must be designed for scale and ease of operations. They need to be monitored and managed for performance and capacity. The topic of configuration management will be covered further at a more advanced level.
The evolution of infrastructure was covered in Digital Infrastructure and applications development in Section 6.1.3, “Application Delivery”, and the DPBoK Standard will continue to build on those foundations. The practices of change, incident, and problem management have been employed in the industry for decades and are important foundations for thinking about operations. Finally, the concept of SRE is an important new discipline emerging from the practices of companies such as Google and Facebook.
6.2.3.1. Defining Operations Management
6.2.3.1.1. Defining Operations
Description
Operations management is a broad topic in management theory, with whole programs dedicated to it in both business and engineering schools. Companies frequently hire Chief Operations Officers to run the organization. We started to cover operations management in Section 6.2.2, “Work Management”, as we examined the topic of “work management” — in traditional operations management, the question of work and who is doing it is critical. For the Digital Practitioner, “operations” tends to have a more technical meaning than the classic business definition, being focused on the immediate questions of systems integrity, availability and performance, and feedback from the user community (i.e., the service or help desk). We see such a definition from Limoncelli et al.:
… operations is the work done to keep a system running in a way that meets or exceeds operating parameters specified by a Service-Level Agreement (SLA). Operations includes all aspects of a service’s lifecycle: from initial launch to the final decommissioning and everything in between [178 p. 147].
Operations often can mean “everything but development” in a digital context. In the classic model, developers built systems and “threw them over the wall” to operations. Each side had specialized processes and technology supporting their particular concerns. However, recall our discussion of design thinking — the entire experience is part of the product. This applies to both those consuming it as well as running it. Companies undergoing Digital Transformation are experimenting with many different models; as we will see in Context III, up to and including the complete merging of Development and Operations-oriented skills under common product management.
|
Important
|
In a digitally transformed enterprise, operations is part of the product. |
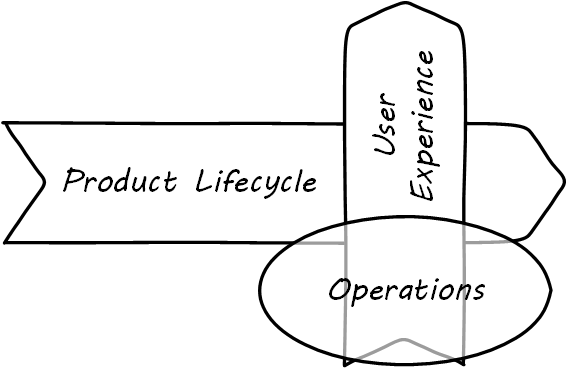
Since this document has a somewhat broader point of view covering all of digital management, it uses the following definition of operations:
Operations is the direct facilitation and support of the digital value experience. It tends to be less variable, more repeatable, yet more interrupt-driven than product development work. It is more about restoring a system to a known state, and less about creating new functionality.
What do we mean by this? In terms of our dual-axis value chain, operations supports the day-to-day delivery of the digital “moment of truth” (see Figure 75, “Operations Supports the Digital Moment of Truth”).
The following are examples of “operations” in an IT context. Some are relevant to a “two pizza product team” scenario; some might be more applicable to larger environments:
-
Systems operators are sitting in 24x7 operations centers, monitoring system status and responding to alerts
-
Help desk representatives answering phone calls from users requiring support
-
They may be calling because a system or service they need is malfunctioning. They may also be calling because they do not understand how to use the system for the value experience they have been led to expect from it. Again, this is part of their product experience.
-
-
Developers and engineers serving “on call” on a rotating basis to respond to systems outages referred to them by the operations center
-
Data center staff performing routine work, such as installing hardware, granting access, or running or testing backups; such routine work may be scheduled, or it may be on request (e.g., ticketed)
-
Field technicians physically dispatched to a campus or remote site to evaluate and if necessary update or fix IT hardware and/or software - install a new PC, fix a printer, service a cell tower antenna
-
Security personnel ensuring security protocols are followed; e.g., access controls
As above, the primary thing that operations does not do is develop new systems functionality. Operations is process-driven and systematic and tends to be interrupt-driven, whereas R&D fails the “systematic” part of the definition (review the definitions in process, product, and project management). However, new functionality usually has operational impacts. In manufacturing and other traditional industries, product development was a minority of work, while operations was where the bulk of work happened. Yet when an operational task involving information becomes well defined and repetitive, it can be automated with a computer.
This continuous cycle of innovation and commoditization has driven closer and closer ties between “development” and “operations”. This cycle has also driven confusion around exactly what is meant by “operations”. In many organizations there is an “Infrastructure and Operations” (I&O) function. Pay close attention to the naming. A matrix may help because we have two dimensions to consider here (see Table 11, “Application, Infrastructure, Development, Operations”).
| Development Phase | Operations Phase | |
|---|---|---|
Application Layer |
Application developers. Handle demand, proactive and reactive, from product and operations. Never under I&O. |
Help desk. Application support and maintenance (provisioning, fixes not requiring software development). Often under I&O. |
Infrastructure Layer |
Engineering team. Infrastructure platform engineering and development (design and build typically of externally sourced products). Often under I&O. |
Operations center. Operational support, including monitoring system status. May monitor both infrastructure and application layers. Often under I&O. |
Notice that we distinguish carefully between the application and infrastructure layers. This document using the following pragmatic definitions:
-
Applications are consumed by people who are not primarily concerned with IT
-
Infrastructure is consumed by people who are primarily concerned with IT
Infrastructure services and/or products, as discussed in Digital Infrastructure, need to be designed and developed before they are operated, just like applications. This may all seem obvious, but there is an industry tendency to lump three of the four cells in the table into the I&O function when, in fact, each represents a distinct set of concerns.
6.2.3.1.2. The Concept of “Service Level”
Either a digital system is available and providing a service, or it isn’t. The concept of "service level” was mentioned above by Limoncelli. A level of service is typically defined in terms of criteria such as:
-
What percentage of the time will the service be available?
-
If the service suffers an outage, how long until it will be restored?
-
How fast will the service respond to requests?
A Service-Level Agreement, or SLA, is a form of contract between the service consumer and service provider, stating the above criteria in terms of a business agreement. When a service’s performance does not meet the agreement, this is sometimes called a “breach” and the service provider may have to pay a penalty (e.g., the customer gets a 5% discount on that month’s services). If the service provider exceeds the SLA, perhaps a credit will be issued.
SLAs drive much operational behavior. They help prioritize incidents and problems, and the risk of proposed changes are understood in terms of the SLAs.
6.2.3.1.3. State and Configuration
In all of IT (whether “infrastructure” or “applications”) there is a particular concern with managing state. IT systems are remarkably fragile. One incorrect bit of information — a “0” instead of a “1” — can completely alter a system’s behavior, to the detriment of business operations depending on it.
Therefore, any development of IT — starting with the initial definition of the computing platform — depends on the robust management state.
The following are examples of state:
-
The name of a particular server
-
The network address of that server
-
The software installed on that server, in terms of the exact version and bits that comprise it
State also has more transient connotations:
-
The current processes listed in the process table
-
The memory allocated to each process
-
The current users logged into the system
Finally, we saw in the previous section some server/application/business mappings. These are also a form of state.
It is therefore not possible to make blanket statements like “we need to manage state”. Computing devices go through myriads of state changes with every cycle of their internal clock. (Analog and quantum computing are out of scope for this document.)
The primary question in managing state is “what matters”? What aspects of the system need to persist, in a reliable and reproducible manner? Policy-aware tools are used extensively to ensure that the system maintains its configuration, and that new functionality is constructed (to the greatest degree possible) using consistent configurations throughout the digital pipeline.
6.2.3.1.4. Environments
“Production” is a term that new IT recruits rapidly learn has forbidding connotations. To be “in production” means that the broader enterprise value stream is directly dependent on that asset. How do things get to be “in production”? What do we mean by that?
Consider the fundamental principle that there is an IT system delivering some “moment of truth” to someone. This system can be of any scale, but as above we are able to conceive of it having a “state”. When we want to change the behavior of this system, we are cautious. We reproduce the system at varying levels of fidelity (building “lower” environments with Infrastructure as Code techniques) and experiment with potential state changes. This is called development. When we start to gain confidence in our experiments, we increase the fidelity and also start to communicate more widely that we are contemplating a change to the state of the system. We may increase the fidelity along a set of traditional names (see Figure 76, “Example Environment Pipeline”):
-
Development
-
Build & Test
-
Quality Assurance (QA)
-
Performance (or load) testing
-
Integration
-
Patch
-
Production
The final state, where value is realized, is “production”. Moving functionality in smaller and smaller batches, with increasing degrees of automation, is called continuous delivery.
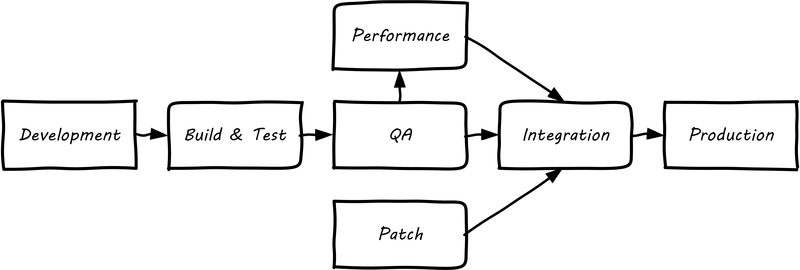
The fundamental idea that new system functionality sequentially moves (“promotes”) through a series of states to gain confidence before finally changing the state of the production system is historically well established. You will see many variations, especially at scale, on the environments listed above. However, the production state is notoriously difficult to reproduce fully, especially in highly distributed environments. While Infrastructure as Code has simplified the problem, lower environments simply can’t match production completely in all its complexity, especially interfaced interactions with other systems or when large, expensive pools of capacity are involved. Therefore there is always risk in changing the state of the production system. Mitigating strategies include:
-
Extensive automated test harnesses that can quickly determine if system behavior has been unfavorably altered
-
Ensuring that changes to the production system can be easily and automatically reversed; for example, code may be deployed but not enabled until a "feature toggle” is set - this allows quick shutdown of that code if issues are seen
-
Increasing the fidelity of lower environments with strategies such as service virtualization to make them behave more like production
-
Hardening services against their own failure in production, or the failure of services on which they depend
-
Reducing the size (and therefore complexity and risk) of changes to production (a key DevOps/continuous delivery strategy); variations here include:
-
Small functional changes (“one line of code”)
-
Small operational changes (deploying a change to just one node out of 100, and watching it, before deploying to the other 99 nodes)
-
-
Using policy-aware infrastructure management tools
Another important development in environmental approaches is A/B testing or canary deployments. In this approach, the “production” environment is segregated into two or more discrete states, with different features or behaviors exposed to users in order to assess their reactions. Netflix uses this as a key tool for product discovery, testing the user reaction to different user interface techniques, for example. Canary deployments are when a change is deployed to a small fraction of the user base, as a pilot.
6.2.3.1.5. Environments as Virtual Concepts
The concept of “environment” can reinforce functional silos and waterfall thinking, and potentially the waste of fixed assets. Performance environments (that can emulate production at scale) are particularly in question.
Instead, in a digital infrastructure environment (private or public), the kind of test you want to perform is defined and that capacity is provisioned on-demand.
6.2.3.1.6. “Development is Production”
It used to be that the concept of “testing in production” was frowned upon. Now, with these mitigating strategies, and the recognition that complex systems cannot ever be fully reproduced, there is more tolerance for the idea. But with older systems that may lack automated testing, incremental deployment, or easy rollback, it is strongly recommended to retain existing promotion strategies, as these are battle-tested and known to reduce risk. Often, their cycle time can be decreased.
On the other hand, development systems must never be treated casually.
-
The development pipeline itself represents a significant operational commitment
-
The failure of a source code repository, if not backed up, could wipe out a company (see [188])
-
The failure of a build server or package repository could be almost as bad
-
In the digital economy, dozens or hundreds of developers out of work represents a severe operational and financial setback, even if the “production” systems continue to function
It is, therefore, important to treat “development” platforms with the same care as production systems. This requires nuanced approaches: with Infrastructure as Code, particular virtual machines or containers may represent experiments, expected to fail often and be quickly rebuilt. No need for burdensome change processes when virtual machine base images and containers are being set up and torn down hundreds of times each day! However, the platforms supporting the instantiation and teardown of those virtual machines are production platforms, supporting the business of new systems development.
Evidence of Notability
Operations management is a broad topic in management and industrial theory, with dedicated courses of study and postgraduate degrees. The intersection of operations management and digital systems has been a topic of concern since the first computers were developed and put into use for military, scientific, and business applications.
Limitations
Operations is repeatable, interrupt-driven, and concerned with maintaining a given state of performance. It is usually rigorously distinguished from R&D.
Related Topics
6.2.3.2. Monitoring and Telemetry
Description
Computers run in large data centers, where physical access to them is tightly controlled. Therefore, we need telemetry to manage them. The practice of collecting and initiating responses to telemetry is called monitoring.
6.2.3.2.1. Monitoring Techniques
Limoncelli et al. define monitoring as follows:
Monitoring is the primary way we gain visibility into the systems we run. It is the process of observing information about the state of things for use in both short-term and long-term decision-making. [178].
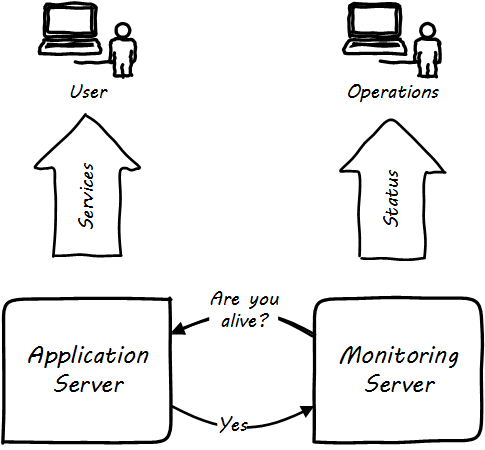
But how do we “observe” computing infrastructure? Monitoring tools are the software that watches the software (and systems more broadly).
A variety of techniques are used to monitor computing infrastructure. Typically these involve communication over a network with the device being managed. Often, the network traffic is on the same network carrying the primary traffic of the computers. Sometimes, however, there is a distinct “out-of-band” network for management traffic. A simple monitoring tool will interact on a regular basis with a computing node, perhaps by “pinging” it periodically, and will raise an alert if the node does not respond within an expected timeframe (see Figure 77, “Simple Monitoring”).
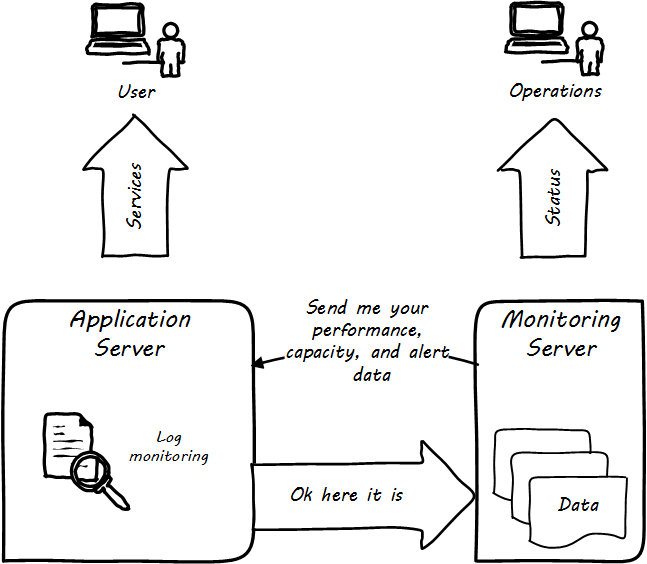
More broadly, these tools provide a variety of mechanisms for monitoring and controlling operational IT systems; they may monitor:
-
Computing processes and their return codes
-
Performance metrics (e.g., memory and CPU utilization)
-
Events raised through various channels
-
Network availability
-
Log file contents (searching the files for messages indicating problems)
-
A given component’s interactions with other elements in the IT infrastructure; this is the domain of application performance monitoring tools, which may use highly sophisticated techniques to trace transactions across components of distributed infrastructure - see also the OpenTracing standard
-
And more (see Figure 78, “Extended Monitoring”)
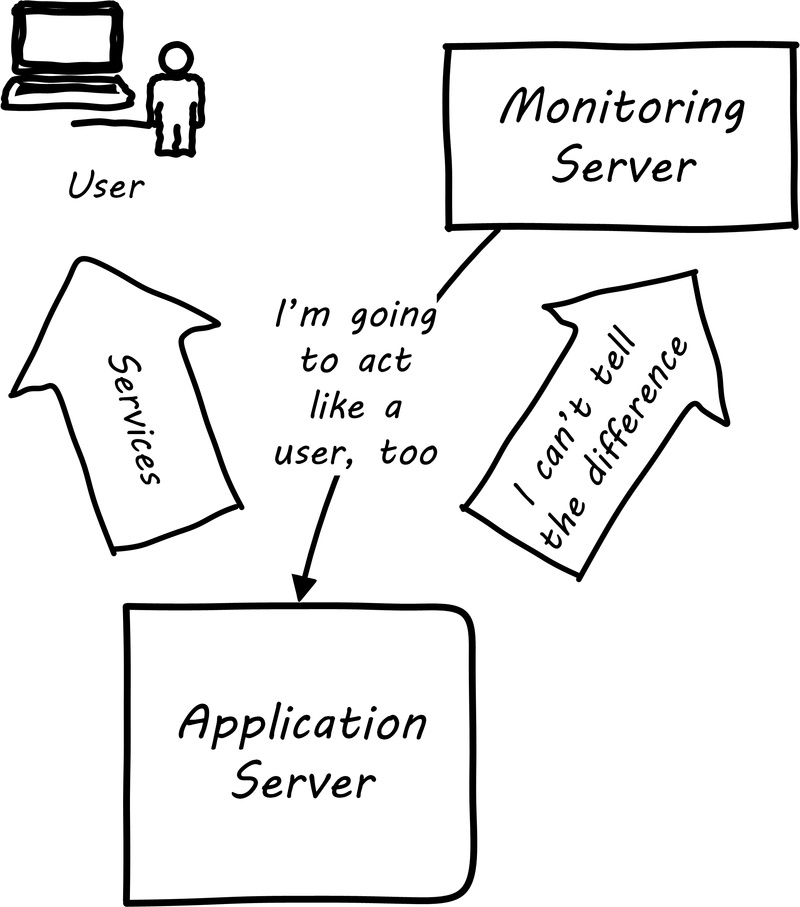
Some monitoring covers low-level system indicators not usually of direct interest to the end user. Other simulates end-user experience; SLAs are often defined in terms of the response time as experienced by the end user (see Figure 79, “User Experience Monitoring”). See [178], Chapters 16-17.
All of this data may then be forwarded to a central console and be integrated, with the objective of supporting the organization’s SLAs in priority order. Enterprise monitoring tools are notorious for requiring agents (small, continuously running programs) on servers; while some things can be detected without such agents, having software running on a given computer still provides the richest data. Since licensing is often agent-based, this gets expensive.
|
Note
|
Monitoring systems are similar to source control systems in that they are a critical point at which metadata diverges from the actual system under management. |
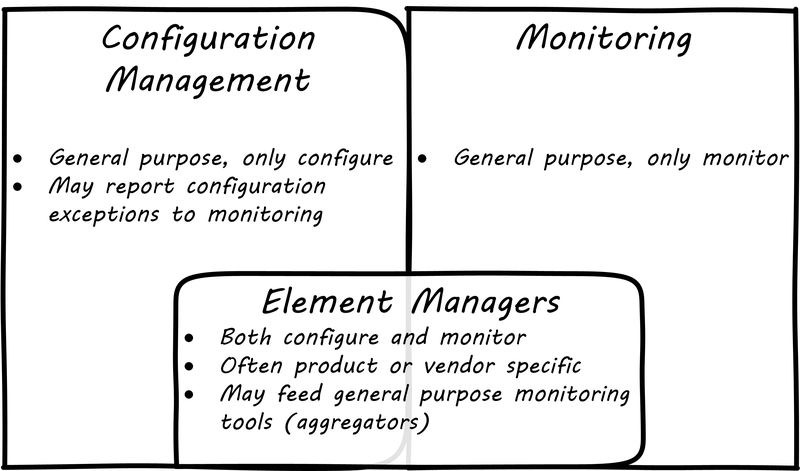
Related to monitoring tools is the concept of an element manager (see Figure 80, “Configuration, Monitoring, and Element Managers”). Element managers are low-level tools for managing various classes of digital or IT infrastructure. For example, Cisco provides software for managing network infrastructure, and EMC provides software for managing its storage arrays. Microsoft provides a variety of tools for managing various Windows components. Notice that such tools often play a dual role, in that they can both change the infrastructure configuration as well as report on its status. Many, however, are reliant on graphical user interfaces, which are falling out of favor as a basis for configuring infrastructure.
6.2.3.2.2. Specialized Monitoring
Monitoring tools, out of the box, can provide ongoing visibility to well-understood aspects of the digital product: the performance of infrastructure, the capacity utilized, and well-understood, common failure modes (such as a network link being down). However, the digital product or application also needs to provide its own specific telemetry in various ways (see Figure 81, “Custom Software Requires Custom Monitoring”). This can be done through logging to output files, or in some cases through raising alerts via the network.
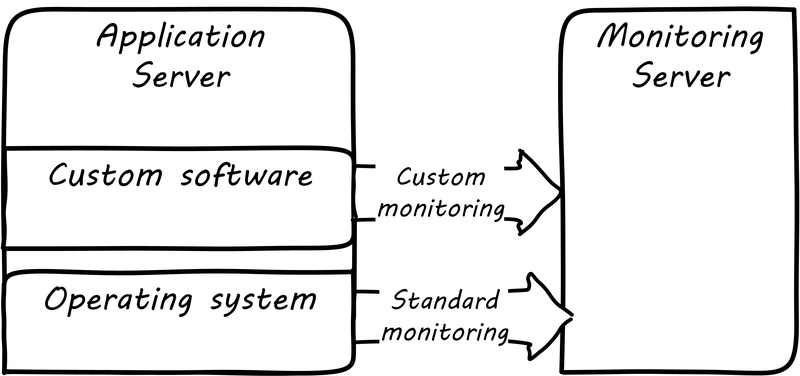
A typical way to enable custom monitoring is to first use a standard logging library as part of the software development process. The logging library provides a consistent interface for the developer to create informational and error messages. Often, multiple “levels” of logging are seen, some more verbose than others. If an application is being troublesome, a more verbose level of monitoring may be turned on. The monitoring tool is configured to scan the logs for certain information. For example, if the application writes:
APP-ERR-SEV1-946: Unresolvable database consistency issues detected, terminating application.
Into the log, the monitoring tool can be configured to recognize the severity of the message and immediately raise an alert.
Finally, as the quote at the beginning of this section suggests, it is critical that the monitoring discipline is based on continuous improvement. (More to come on continuous improvement in Section 6.3.1, “Coordination and Process”.) Keeping monitoring techniques current with your operational challenges is a never-ending task. Approaches that worked well yesterday, today generate too many false positives, and your operations team is now overloaded with all the noise. Ongoing questioning and improvement of your approaches are essential to keeping your monitoring system optimized for managing business impact as efficiently and effectively as possible.
6.2.3.2.3. Aggregation and Operations Centers
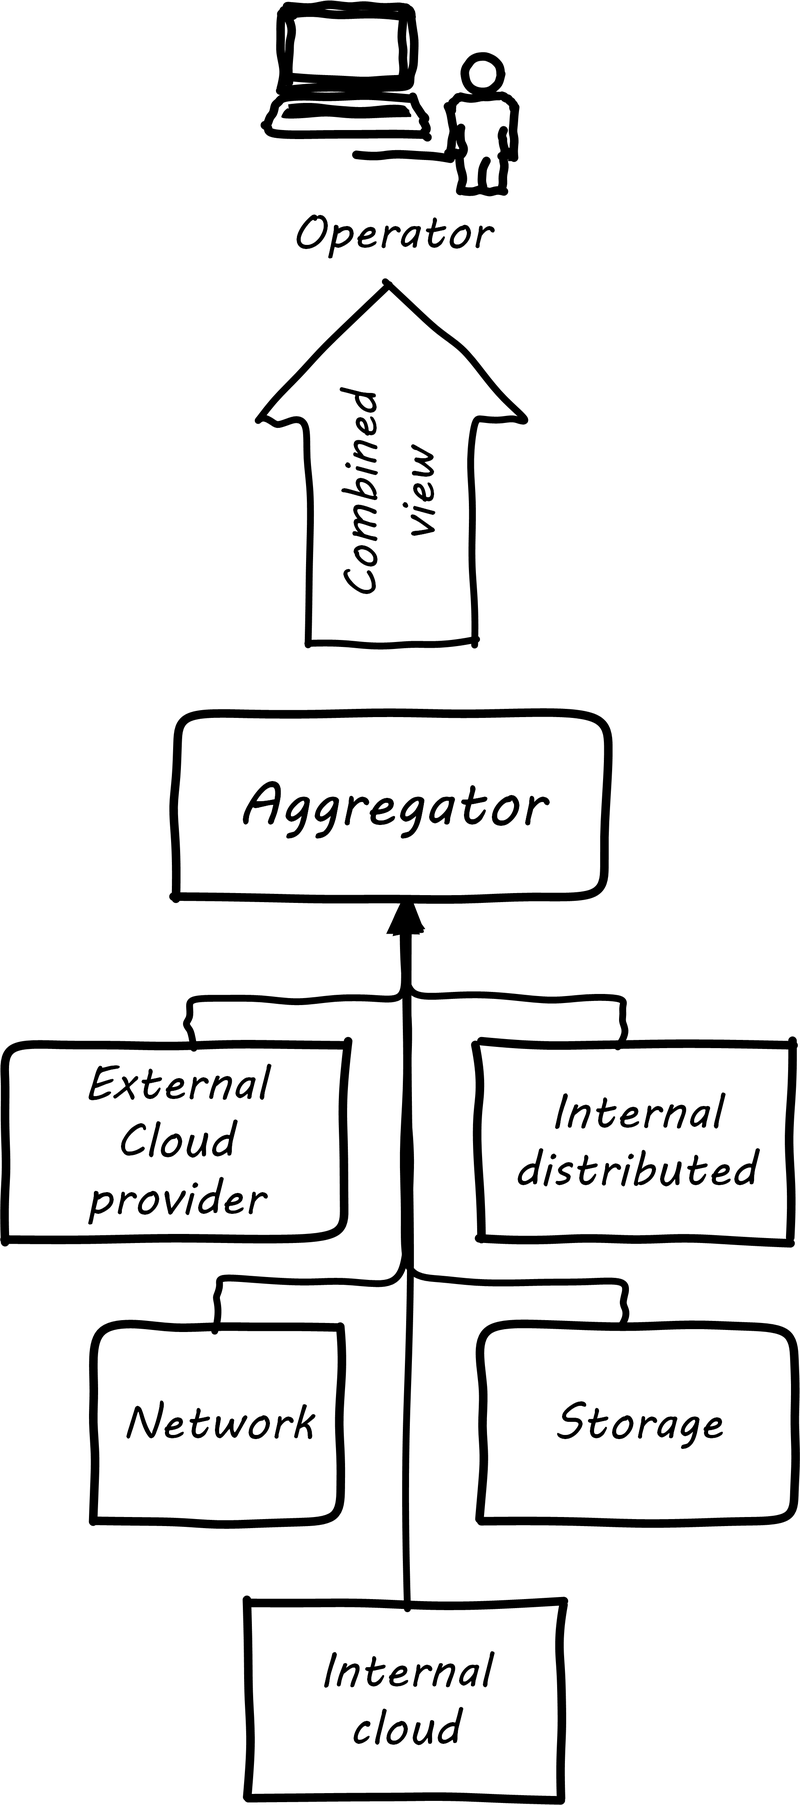
It is not possible for a 24x7 operations team to access and understand the myriads of element managers and specialized monitoring tools present in the large IT environment. Instead, these teams rely on aggregators of various kinds to provide an integrated view of the complexity (see Figure 82, “Aggregated Monitoring”). These aggregators may focus on status events, or specifically on performance aspects related either to the elements or to logical transactions flowing across them. They may incorporate dependencies from configuration management to provide a true “business view” into the event streams. This is directly analogous to the concept of Andon board from Lean practices or the idea of “information radiator” from Agile principles.
|
Note
|
24x7 operations means operations conducted 24 hours a day, 7 days a week. |
A monitoring console may present a rich and detailed set of information to an operator. Too detailed, in fact, as systems become large. Raw event streams must be filtered for specific events or patterns of concern. Event de-duplication starts to become an essential capability, which leads to distinguishing the monitoring system from the event management system. Also, for this reason, monitoring tools are often linked directly to ticketing systems; on certain conditions, a ticket (e.g., an incident) is created and assigned to a team or individual.
Enabling a monitoring console to auto-create tickets, however, needs to be carefully considered and designed. A notorious scenario is the “ticket storm”, where a monitoring system creates multiple (perhaps thousands) of tickets, all essentially in response to the same condition.
6.2.3.2.4. Understanding Business Impact
At the intersection of event aggregation and operations centers is the need to understand business impact. It is not, for example, always obvious what a server is being used for. This may be surprising to new students, and perhaps those with experience in smaller organizations. However, in many large “traditional” IT environments, where the operations team is distant from the development organization, it is not necessarily easy to determine what a given hardware or software resource is doing or why it is there. Clearly, this is unacceptable in terms of security, value management, and any number of other concerns. However, from the start of distributed computing, the question “what is on that server?” has been all too frequent in large IT shops.
In mature organizations, this may be documented in a Configuration Management Database or System (CMDB/CMS). Such a system might start by simply listing the servers and their applications:
| Application | Server |
|---|---|
Quadrex |
SRV0001 |
PL-Q |
SRV0002 |
Quadrex |
DBSRV001 |
TimeTrak |
SRV0003 |
HR-Portal |
SRV0003 |
etc. |
etc. |
(Imagine the above list, 25,000 rows long.)
This is a start, but still doesn’t tell us enough. A more elaborate mapping might include business unit and contact:
| BU | Contact | Application | Server |
|---|---|---|---|
Logistics |
Mary Smith |
Quadrex |
SRV0001 |
Finance |
Aparna Chaudry |
PL-Q |
SRV0002 |
Logistics |
Mary Smith |
Quadrex |
DBSRV001 |
Human Resources |
William Jones |
TimeTrak |
SRV0003 |
Human Resources |
William Jones |
HR-Portal |
SRV0003 |
etc. |
etc. |
etc. |
etc. |
The above lists are very simple examples of what can be extensive record-keeping. But the key user story is implied: if we can’t ping SRV0001, we know that the Quadrex application supporting Logistics is at risk, and we should contact Mary Smith ASAP if she hasn’t already contacted us. (Sometimes, the user community calls right away; in other cases, they may not, and proactively contacting them is a positive and important step.)
The above approach is relevant to older models still reliant on servers (whether physical or virtual) as primary units of processing. The trend to more dynamic forms of computing such as containers and serverless computing is challenging these traditional practices, and what will replace them is currently unclear.
6.2.3.2.5. Capacity and Performance Management
Capacity and performance management are closely related, but not identical terms encountered as IT systems scale up and encounter significant load.
A capacity management system may include large quantities of data harvested from monitoring and event management systems, stored for long periods of time so that history of the system utilization is understood and some degree of prediction can be ventured for upcoming utilization.
The classic example of significant capacity utilization is the Black Friday/Cyber Monday experience of retailers. Both physical store and online e-commerce systems are placed under great strain annually around this time, with the year’s profits potentially on the line.
Performance management focuses on the responsiveness (e.g., speed) of the systems being used. Responsiveness may be related to capacity utilization, but some capacity issues don’t immediately affect responsiveness. For example, a disk drive may be approaching full. When it fills, the system will immediately crash, and performance is severely affected. But until then, the system performs fine. The disk needs to be replaced on the basis of capacity reporting, not performance trending. On the other hand, some performance issues are not related to capacity. A misconfigured router might badly affect a website’s performance, but the configuration simply needs to be fixed — there is no need to handle as a capacity-related issue.
At a simpler level, capacity and performance management may consist of monitoring CPU, memory, and storage utilization across a given set of nodes, and raising alerts if certain thresholds are approached. For example, if a critical server is frequently approaching 50% CPU utilization (leaving 50% “headroom”), engineers might identify that another server should be added. Abbot and Fisher suggest: “As a general rule … we like to start at 50% as the ideal usage percentage and work up from there as the arguments dictate” [4 p. 204].
So, what do we do when a capacity alert is raised, either through an automated system or through the manual efforts of a capacity analyst? There are a number of responses that may follow:
-
Acquire more capacity
-
Seek to use existing capacity more efficiently
-
Throttle demand somehow
Capacity analytics at its most advanced (i.e., across hundreds or thousands of servers and services) is a true Big Data problem domain and starts to overlap with IT asset management, capital planning, and budgeting in significant ways. As your organization scales up and you find yourself responding more frequently to the kinds of operational issues described in this section, you might start asking yourself whether you can be more proactive. What steps can you take when developing or enhancing your systems, so that operational issues are minimized? You want systems that are stable, easily upgraded, and that can scale quickly on-demand.
Evidence of Notability
Monitoring production systems is the subject of extensive discussion and literature in digital and IT management. See, for example, [14, 178, 34].
Limitations
Monitoring provides immediate insight via automated management of telemetry. It cannot tell responders what to do, in general.
Related Topics
6.2.3.3. Operational Response
Description
Monitoring communicates the state of the digital systems to the professionals in charge of them. Acting on that telemetry involves additional tools and practices, some of which we will review in this section.
6.2.3.3.1. Communication Channels
When signals emerge from the lower levels of the digital infrastructure, they pass through a variety of layers and cause assorted, related behavior among the responsible Digital Practitioners. The accompanying illustration shows a typical hierarchy, brought into action as an event becomes apparently more significant (see Figure 83, “Layered Communications Channels”).
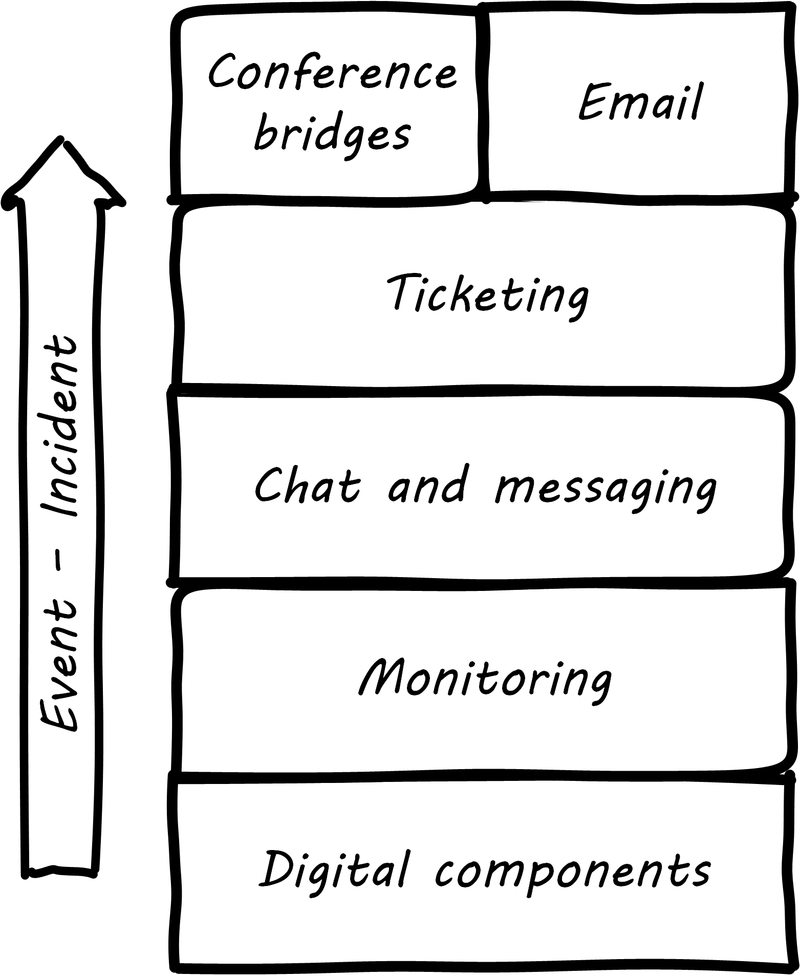
The digital components send events to the monitoring layer, which filters them for significant concerns; for example, a serious application failure. The monitoring tool might automatically create a ticket, or perhaps it first provides an alert to the system’s operators, who might instant message each other, or perhaps join a chatroom.
If the issue can’t be resolved operationally before it starts to impact users, an Incident ticket might be created, which has several effects:
-
First, the situation is now a matter of record, and management may start to pay attention
-
Accountability for managing the incident is defined, and expectations are that responsible parties will start to resolve it
-
If assistance is needed, the incident provides a common point of reference (it is a common reference point), in terms of work management
Depending on the seriousness of the incident, further communications by instant messaging, chat, cell phone, email, and/or conference bridge may continue. Severe incidents in regulated industries may require recording of conference bridges.
ChatOps is the tight integration of instant communications with operational execution. In a chatroom, a virtual agent or "bot" is enabled and monitors the human-to-human interactions. The human beings can issue certain commands to the bot, such as code deployments, team notifications, server restarts, or more [256].
Properly configured ChatOps provides a low-friction collaborative environment, enabling a powerful and immediate collective mental model of the situation and what is being done. It also provides a rich audit trail of who did what, when, and who else was involved. Fundamental governance objectives of accountability can be considered fulfilled in this way, on a par with paper or digital forms routed for approval (and without their corresponding delays).
6.2.3.3.2. Operational Process Emergence
Process is what makes it possible for teams to do the right thing, again and again.
Limoncelli, Chalup, and Hogan, in their excellent Cloud Systems Administration, emphasize the role of the “oncall” and “onduty” staff in the service of operations [178]. Oncall staff have a primary responsibility of emergency response, and the term oncall refers to their continuous availability, even if they are not otherwise working (e.g., they are expected to pick up phone calls and alerts at home and dial into emergency communications channels). Onduty staff are responsible for responding to non-critical incidents and maintaining current operations.
What is an emergency? It’s all a matter of expectations. If a system (by its SLA) is supposed to be available 24 hours a day, 7 days a week, an outage at 3 AM Saturday morning is an emergency. If it is only supposed to be available from Monday through Friday, the outage may not be as critical (although it still needs to be fixed in short order, otherwise there will soon be an SLA breach!).
IT systems have always been fragile and prone to malfunction. “Emergency” management is documented as a practice in “data processing” as early as 1971 [87 pp. 188-189]. In Competency Area 5, we discussed how simple task management starts to develop into process management. Certainly, there is a concern for predictability when the objective is to keep a system running, and so process management gains strength as a vehicle for structuring work. By the 1990s, a process terminology was increasingly formalized, by vendors such as IBM (in their “Yellow Book” series), the UK’s IT Infrastructure Library (ITIL), and other guidance such as the Harris Kern library (popular in the US before ITIL gained dominance). These processes include:
-
Request management
-
Incident management
-
Problem management
-
Change management
Even as a single-product team, these processes are a useful framework to keep in mind as operational work increases. See Table 14, “Basic Operational Processes” for definitions of the core processes usually first implemented.
| Process | Definition |
|---|---|
Request management |
Respond to routine requests such as providing systems access. |
Incident management |
Identify service outages and situations that could potentially lead to them, and restore service and/or mitigate immediate risk. |
Problem management |
Identify the causes of one or more incidents and remedy them (on a longer-term basis). |
Change management |
Record and track proposed alterations to critical IT components. Notify potentially affected parties and assess changes for risk; ensure key stakeholders exercise approval rights. |
These processes have a rough sequence to them:
-
Give the user access to the system
-
If the system is not functioning as expected, identify the issue and restore service by any means necessary - don’t worry about why it happened yet
-
Once service is restored, investigate why the issue happened (sometimes called a post-mortem) and propose longer-term solutions
-
Inform affected parties of the proposed changes, collect their feedback and approvals, and track the progress of the proposed change through successful completion
At the end of the day, we need to remember that operational work is just one form of work. In a single-team organization, these processes might still be handled through basic task management (although user provisioning would need to be automated if the system is scaling significantly). It might be that the simple task management is supplemented with checklists since repeatable aspects of the work become more obvious. We will continue on the assumption of basic task management for the remainder of this Competency Area, and go deeper into the idea of defined, repeatable processes as we scale to a “team of teams” in Context III.
6.2.3.3.3. Post-Mortems, Blamelessness, and Operational Demand
We briefly mentioned problem management as a common operational process. After an incident is resolved and services are restored, further investigation (sometimes called “root cause analysis”) is undertaken as to the causes and long-term solutions to the problem. This kind of investigation can be stressful for the individuals concerned and human factors become critical.
|
Note
|
The term "root cause analysis” is viewed by some as misleading, as complex system failures often have multiple causes. Other terms are post-mortems or simply causal analysis. |
We have discussed psychological safety previously. Psychological safety takes on an additional and even more serious aspect when we consider major system outages, many of which are caused by human error. There has been a long history of management seeking individuals to “hold accountable” when complex systems fail. This is an unfortunate approach, as complex systems are always prone to failure. Cultures that seek to blame do not promote a sense of psychological safety.
The definition of "counterfactual” is important. A “counterfactual” is seen in statements of the form “if only Joe had not re-indexed the database, then the outage would not have happened”. It may be true that if Joe had not done so, the outcome would have been different. But there might be other such counterfactuals. They are not helpful in developing a continual improvement response. The primary concern in assessing such a failure is "how was Joe put in a position to fail?". Put differently, how is it that the system was designed to be vulnerable to such behavior on Joe’s part? How could it be designed differently, and in a less sensitive way?
This is, in fact, how aviation has become so safe. Investigators with the unhappy job of examining large-scale airplane crashes have developed a systematic, clinical, and rational approach for doing so. They learned that if the people they were questioning perceived a desire on their part to blame, the information they provided was less reliable. (This, of course, is obvious to any parent of a four-year old.)
John Allspaw, CTO of Etsy, has pioneered the application of modern safety and incident investigation practices in digital contexts and notably has been an evangelist for the work of human factors expert and psychologist Sidney Dekker. Dekker summarizes attitudes towards human error as falling into either the old or new views. He summarizes the old view as the Bad Apple theory:
-
Complex systems would be fine, were it not for the erratic behavior of some unreliable people (Bad Apples) in it
-
Human errors cause accidents: humans are the dominant contributor to more than two thirds of them
-
Failures come as unpleasant surprises; they are unexpected and do not belong in the system - failures are introduced to the system only through the inherent unreliability of people
Dekker contrasts this with the new view:
-
Human error is not a cause of failure - human error is the effect, or symptom, of deeper trouble
-
Human error is not random - it is systematically connected to features of people’s tools, tasks, and operating environment
-
Human error is not the conclusion of an investigation; it is the starting point [83]
Dekker’s principles are an excellent starting point for developing a culture that supports blameless investigations into incidents. We will talk more systematically of culture in Section 6.3.1, “Coordination and Process”.
Finally, once a post-mortem or problem analysis has been conducted, what is to be done? If work is required to fix the situation (and when is it not?), this work will compete with other priorities in the organization. Product teams typically like to develop new features, not solve operational issues that may call for reworking existing features. Yet serving both forms of work is essential from a holistic, design thinking point of view.
In terms of queuing, operational demand is too often subject to the equivalent of queue starvation — which as Wikipedia notes is usually the result of “naive scheduling algorithms”. If we always and only work on what we believe to be the “highest priority” problems, operational issues may never get attention. One result of this is the concept of technical debt, which we discuss in Context IV.
6.2.3.3.4. Drills, Game Days, and Chaos Engineering
As noted above, it is difficult to fully reproduce complex production infrastructures as “lower” environments. Therefore, it is difficult to have confidence in any given change until it has been run in production.
The need to emulate “real-world” conditions is well understood in the military, which relies heavily on drill and exercises to ensure peak operational readiness. Analogous practices are emerging in digital organizations, such as the concept of “Game Days” — defined periods when operational disruptions are simulated and the responses assessed. A related set of tools is the Netflix Simian Army, a collection of resiliency tools developed by the online video-streaming service Netflix. It represents a significant advancement in digital risk management, as previous control approaches were too often limited by poor scalability or human failure (e.g., forgetfulness or negligence in following manual process steps).
Chaos Monkey is one of a number of tools developed to continually “harden” the Netflix system, including:
-
Latency Monkey — introduces arbitrary network delays
-
Conformity Monkey — checks for consistency with architectural standards, and shuts down non-conforming instances
-
Doctor Monkey — checks for longer-term evidence of instance degradation
-
Janitor Monkey — checks for and destroys unused running capacity
-
Security Monkey — an extension of Conformity Monkey, checks for correct security configuration
-
10-18 Monkey — checks internationalization
-
Finally, Chaos Gorilla simulates the outage of an entire Amazon availability zone
On the whole, the Simian Army behaves much as antibodies do in an organic system. One notable characteristic is that the monkeys as described do not generate a report (a secondary artifact) for manual follow-up. They simply shut down the offending resources.
Such direct action may not be possible in many environments but represents an ideal to work toward. It keeps the security and risk work “front and center” within the mainstream of the digital pipeline, rather than relegating it to the bothersome “additional work” it can so easily be seen as.
A new field of chaos engineering is starting to emerge centered on these concepts.
6.2.3.3.5. Site Reliability Engineering
Site Reliability Engineering (SRE) is a new term for operations-centric work, originating from Google and other large digital organizations. It is clearly an operational discipline; the SRE team is responsible for the “availability, latency, performance, efficiency, change management, monitoring, emergency response, and capacity planning of their service” [34 p. 7].
Google site reliability engineers have strong technical backgrounds, frequently computer science, which is atypical for operations staff in the traditional IT industry. SREs are strongly incented to automate as much as possible, avoiding “toil” (i.e., repetitive, non-value-add tasks). In other words, as Benjamin Sloss says: “we want systems that are automatic, not just automated” [34].
Google has pioneered a number of innovative practices with its SRE team, including:
-
A 50% cap on aggregate “ops” work — the other 50% is supposed to be spent on development
-
The concept of an “error budget” as a control mechanism — teams are incented not for “zero downtime” but rather to take the risk and spend the error budget
-
“Release Engineer” as a specific job title for those focused on building and maintaining the delivery pipeline
Evidence of Notability
Identifying the need for and marshaling operational response is an essential capability in managing digital systems.
Limitations
Operational response is typically urgent and time-bound. It is not reflective nor, in general, creative or innovative (except out of necessity).
Related Topics
6.2.3.4. Operations-Driven Product Demand
Description
Designing complex systems that can scale effectively and be operated efficiently is a challenging topic. Many insights have been developed by the large-scale public-facing Internet sites, such as Google, Facebook, Netflix, and others.
A reasonable person might question why systems design questions are appearing here in this Competency Area on operations. We have discussed certain essential factors for system scalability previously: cloud, Infrastructure as Code, version control, and continuous delivery. These are all necessary, but not sufficient to scaling digital systems. Once a system starts to encounter real load, further attention must go to how it runs, as opposed to what it does. It is not easy to know when to focus on scalability. If product discovery is not on target, the system will never get the level of use that requires scalability. Insisting that the digital product has a state-of-the-art and scalable design might be wasteful if the team is still searching for an MVP (in Lean Startup terms). Of course, if you are doing systems engineering and building a “cog”, not growing a “flower", you may need to be thinking about scalability earlier.
Eventually, scale matters. Cloud computing abstracts many concerns, but as your IT service’s usage increases, you will inevitably find that technical details such as storage and network architecture increasingly matter. What often happens is that the system goes through various prototypes until something with market value is found and, at that point, as use starts to scale up, the team scrambles for a more robust approach. The implementation decisions made by the Digital Practitioner and their service providers may become inefficient for the particular “workload” the product represents. The brief technical writeup, Latency Numbers Every Programmer Should Know is recommended.
There are dozens of books and articles discussing many aspects of how to scale systems. In this section, we will discuss two important principles: the CAP principle and the AKF scaling cube. If you are interested in this topic in depth, consult the references in this Competency Area.
6.2.3.4.1. The CAP Principle
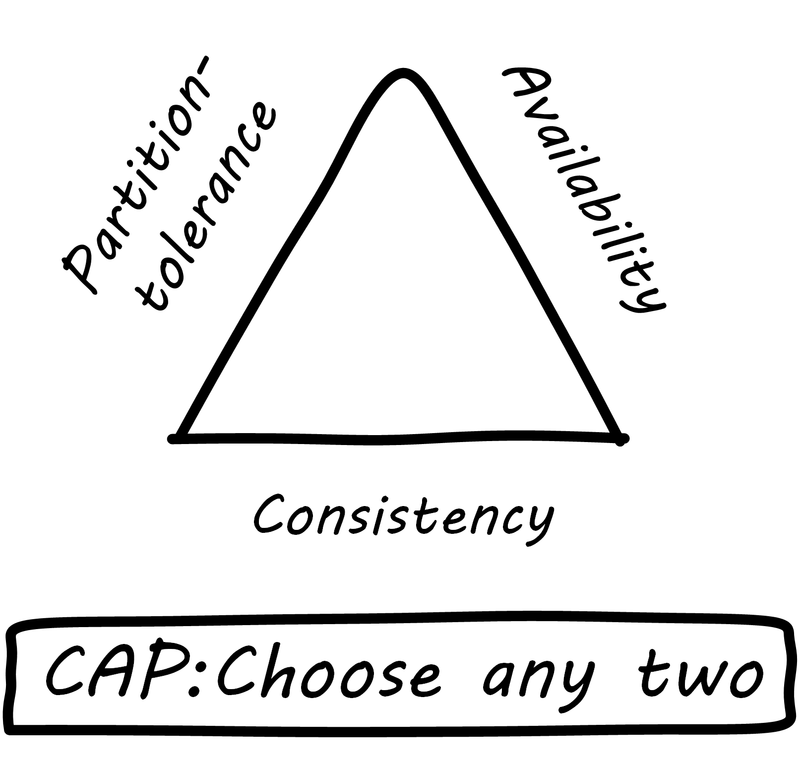
Scaling digital systems used to imply acquiring faster and more powerful hardware and software. If a 4-core server with 8 gigabytes of RAM isn’t enough, get a 32-core server with 256 gigabytes of RAM (and upgrade your database software accordingly, for millions of dollars more). This kind of scaling is termed “vertical” scaling. However, web-scale companies such as Facebook and Google determined that this would not work indefinitely. Vertical scaling in an infinite capacity is not physically (or financially) possible. Instead, these companies began to experiment aggressively with using large numbers of inexpensive commodity computers.
The advantage to vertical scaling is that all your data can reside on one server, with fast and reliable access. As soon as you start to split your data across servers, you run into the practical implications of the CAP principle (see Figure 84, “CAP Principle”).
CAP stands for:
-
Consistency
-
Availability
-
Partition-tolerance
and the CAP principle (or theorem) states that it is not possible to build a distributed system that guarantees all three [106]. What does this mean? First, let’s define our terms.
Consistency means that all the servers (or “nodes”) in the system see the same data at the same time. If an update is being processed, no node will see it before any other. This is often termed a transactional guarantee, and it is the sort of processing relational databases excel at.
For example, if you change your flight, and your seat opens up, a consistent reservation application will show the free seat simultaneously to anyone who inquires, even if the reservation information is replicated across two or more geographically distant nodes. If the seat is reserved, no node will show it available, even if it takes some time for the information to replicate across the nodes. The system will simply not show anyone any data until it can show everyone the correct data.
Availability means what it implies: that the system is available to provide data on request. If we have many nodes with the same data on them, this can improve availability, since if one is down, the user can still reach others.
Partition-tolerance is the ability of the distributed system to handle communications outages. If we have two nodes, both expected to have the same data, and the network stops communicating between them, they will not be able to send updates to each other. In that case, there are two choices: either stop providing services to all users of the system (failure of availability) or accept that the data may not be the same across the nodes (failure of consistency).
In the earlier years of computing, the preference was for strong consistency, and vendors such as Oracle® profited greatly by building database software that could guarantee it when properly configured. Such systems could be consistent and available, but could not tolerate network outages — if the network was down, the system, or at least a portion of it, would also be down.
Companies such as Google and Facebook took the alternative approach. They said: “We will accept inconsistency in the data so that our systems are always available”. Clearly, for a social media site such as Facebook, a posting does not need to be everywhere at once before it can be shown at all. To verify this, simply post to a social media site using your computer. Do you see the post on your phone, or your friend’s, as soon as you submit it on your computer? No, although it is fast, you can see some delay. This shows that the site is not strictly consistent; a strictly consistent system would always show the same data across all the accessing devices.
The challenge with accepting inconsistency is how to do so. Eventually, the system needs to become consistent, and if conflicting updates are made they need to be resolved. Scalable systems in general favor availability and partition-tolerance as principles, and therefore must take explicit steps to restore consistency when it fails. The approach taken to partitioning the system into replicas is critical to managing eventual consistency, which brings us to the AKF scaling cube.
For further discussion, see [178], Section 1.5.
6.2.3.4.2. The AKF Scaling Cube
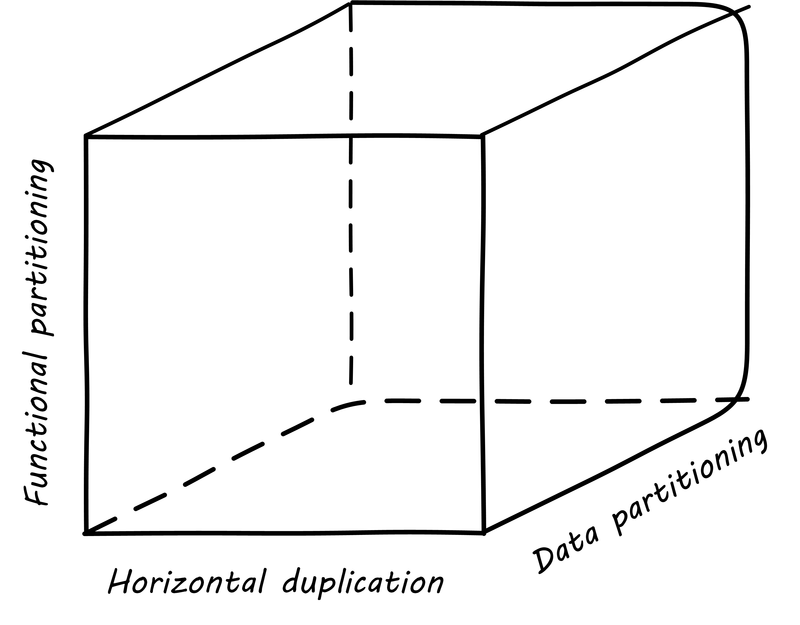
Another powerful tool for thinking about scaling systems is the AKF Scaling Cube (see Figure 85, “AKF Scaling Cube”, similar to [4 p. 376]). AKF stands for Abbott, Keeven, and Fisher, authors of The Art of Scalability [4]. The AKF cube is a visual representation of the three basic options for scaling a system:
-
Replicate the complete system (x-axis)
-
Split the system functionally into smaller layers or components (y-axis)
-
Split the system’s data (z-axis)
A complete system replica is similar to the Point of Sale (POS) terminals in a retailer. Each is a self-contained system with all the data it needs to handle typical transactions. POS terminals do not depend on each other; therefore you can keep increasing the capacity of your store’s checkout lines by simply adding more of them.
Functional splitting is when you separate out different features or components. To continue the retail analogy, this is like a department store; you view and buy electronics, or clothes, in those specific departments. The store “scales” by adding departments, which are self-contained in general; however, in order to get a complete outfit, you may need to visit several departments. In terms of systems, separating web and database servers is commonly seen — this is a component separation. E-commerce sites often separate “show” (product search and display) from “buy” (shopping cart and online checkout); this is a feature separation. Complex distributed systems may have large numbers of features and components, which are all orchestrated together into one common web or smartphone app experience.
Data splitting (sometimes termed "sharding”) is the concept of “partitioning” from the CAP discussion, above. For example, consider a conference with check-in stations divided by alphabet range; for example:
-
A-H register here
-
I-Q register here
-
R-Z register here
This is a good example of splitting by data. In terms of digital systems, we might split data by region; customers in Minnesota might go to the Kansas City data center, while customers in New Jersey might go to a North Carolina data center. Obviously, the system needs to handle situations where people are traveling or move.
There are many ways to implement and combine the three axes of the AKF scaling cube to meet the CAP constraints (Consistency, Availability, and Partition-tolerance). With further study of scalability, you will encounter discussions of:
-
Load balancing architectures and algorithms
-
Caching
-
Reverse proxies
-
Hardware redundancy
-
Designing systems for continuous availability during upgrades
Evidence of Notability
Operational insights result in requirements for products to be changed. This is an important feedback loop from the operations to the development phase, and a major theme in IT operations management literature. See, for example, [178], "Part I Design: Building It".
Limitations
Operational demand focuses on how the system runs, not what it does. Both, however, are valid concerns for product management.
Related Topics
6.2.4. Context II Conclusion
Context II covered the basic elements necessary for a collaborative product team to achieve success while still at a manageable human scale.
The IT-centric team needed capabilities for evolving its product, managing its work, and operating its product. In some cases, time and space shifting might drive the team to automate basic capabilities such as work management and ticketing. However, the overall assumption was that, for the most part, people are co-located and still can communicate with minimal friction.
Context II leads logically to Context III. There is a high-functioning team. But a single team cannot scale indefinitely. The Digital Practitioner now has no choice but to organize as a team of teams.
6.2.4.1. Context II Architectural View
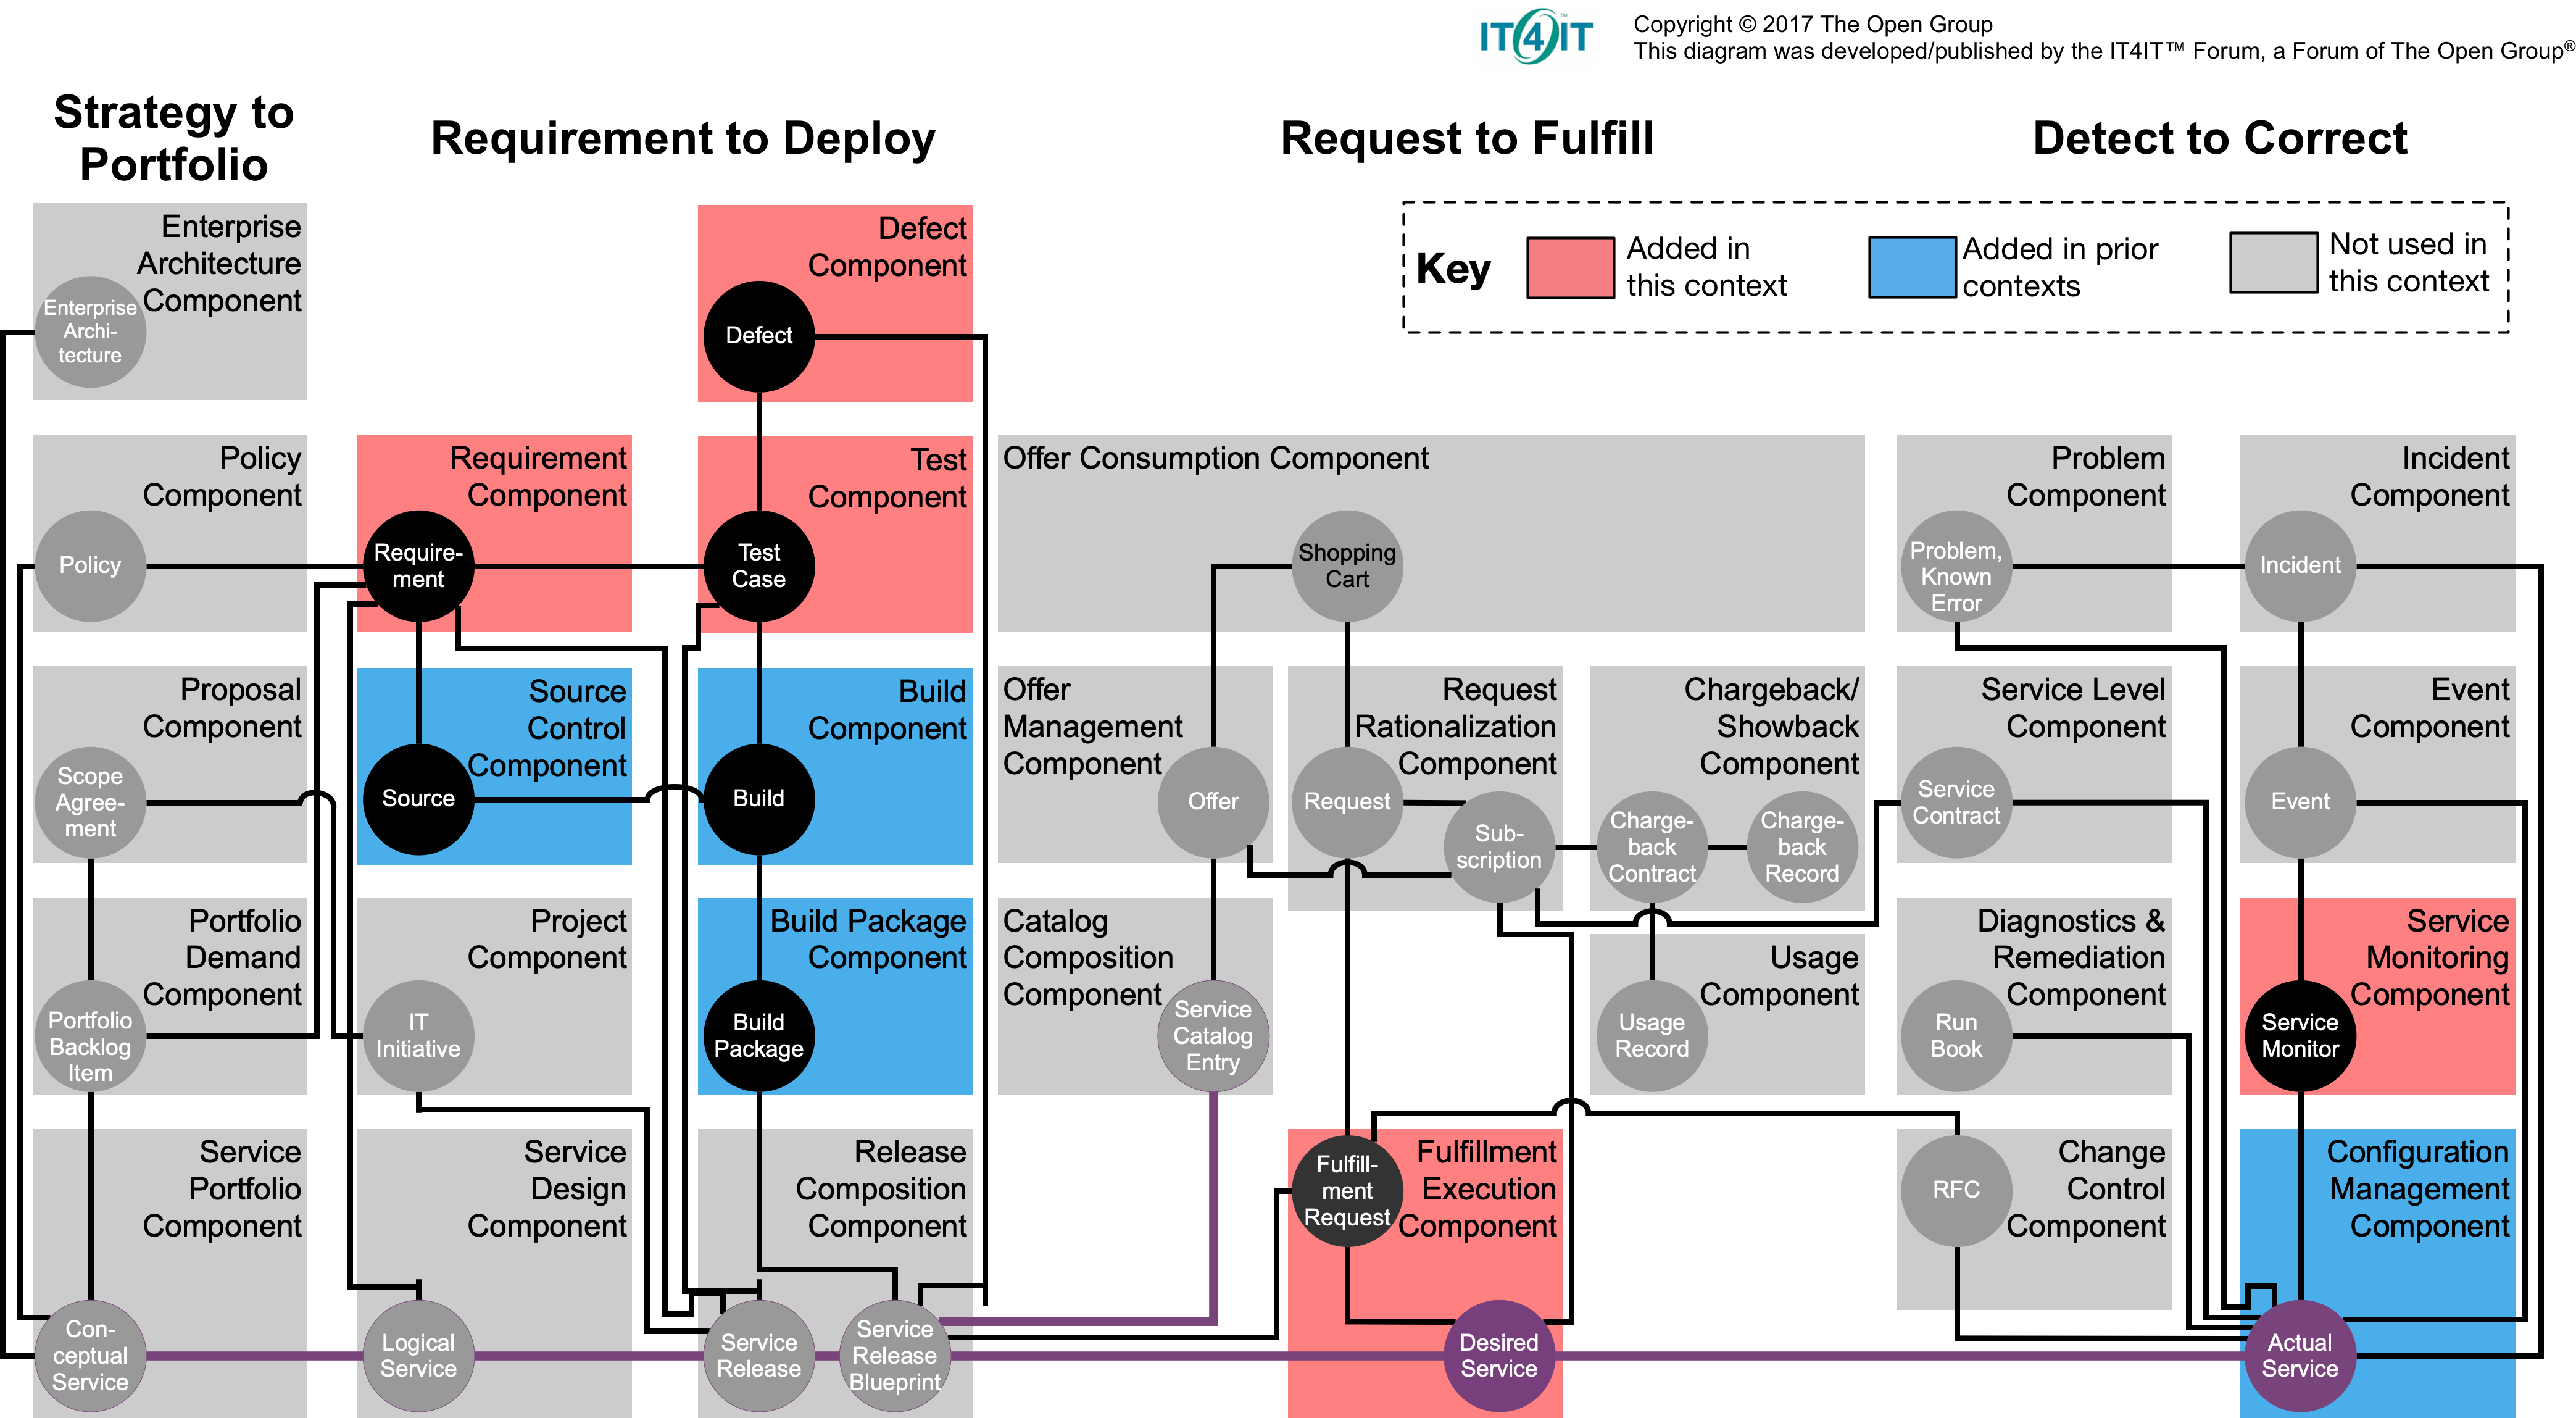
Further automation is required at the team context, as product management is formalized and operational work such as provisioning and monitoring emerges. Suggested functional components are:
-
Requirement component
-
Test component
-
Defect component
-
Fulfillment Execution component
-
Service Monitoring component
One area that the IT4IT approach does not address is a simple “work management” component. In collaborative team environments, Kanban-based tools are often used to manage the human work in an undifferentiated flow (testing, defects, requirements, issues detected from monitoring).
Fulfillment Execution is included here to generically represent the digital product’s provisioning capability. For a single digital product, provisioning may or may not be distinct from the product architecture itself. At scale, it does become distinct and requires a more elaborate architecture.
Context II "Architectural View" Learning Objectives
-
Identify the IT4IT components suitable for Context II
Related Topics
6.3. Context III: Team of Teams
|
Note
|
Team of Teams
Team of Teams: New Rules of Engagement for a Complex World is the name of a 2015 book by General Stanley McChrystal, describing his experiences as the commander of Joint Special Operations Command in the Iraq conflict. It describes how the US military was being beaten by a foe with inferior resources, and its need to shift from a focus on mechanical efficiency to more adaptable approaches. The title is appropriate for this context, as moving from “team” to “team of teams” is one of the most challenging transitions any organization can make.
|
Context Description
Context II, Section 6.2.3, “Operations Management” introduced the AKF scaling cube, and this context is in part based on a related thought experiment. As the team-based company grew, it reached a crisis point in scaling the digital product. One team could no longer cope as a single unit with the increasing complexity and operational demands. In AKF scaling cube terms, the team is scaling along the y-axis, the hardest but in some ways the most important dimension to know how to scale along.
The organization is now a “team of teams”, at a size where face-to-face communication is increasingly supplemented by other forms of communication and coordination. Teams may get results but in different ways. The organization needs some level of coordination, and not everyone is readily accessible for immediate communication; people are no longer co-located, and there may be different schedules involved.
Furthermore, the organization now has multiple products. As it scales up, it must now split its products into features and components (the y-axis of the AKF scaling cube). Then as the organization moves from your first product to adding more, further organizational evolution is required. The organization may try to keep its products from developing unmanageable interdependencies, but this is an ongoing challenge. Tensions between various teams are starting to emerge. Specialization in your organization is increasing, along with the tendency of specialists to identify more with their field than with the needs of customers. There is an increasing desire among stakeholders and executives for control and predictability. Resources are limited and always in contention. Advisors and consultants suggest various frameworks for managing the organization. As the organization scales, however, its leaders need to remember that the highest value is found in fast-moving, committed, multi-skilled teams. Losing sight of that value is a common problem for growing organizations.
As the individual becomes a manager of managers, their concerns again shift. In Context II, the leader had to delegate product management (are they building the right thing?) and take concern for basic work management and digital operations. Now, in this context, the leader is primarily a manager of managers, concerned with providing the conditions for your people to excel:
-
Defining how work is executed, in terms of decision rights, priorities, and conflicts
-
Setting the organizational mission and goals that provide the framework for making investments in products and projects
-
Instituting labor, financial, supply chain, and customer management processes and systems
-
Providing facilities and equipment to support digital delivery
-
Resolving issues and decisions escalated from lower levels in the organization
New employees are bringing in their perspectives, and the more experienced ones seem to assume that the company will use “projects” and “processes” to get work done. There is no shortage of contractors and consultants who advocate various flavors of the process and project management; while some advocate older approaches and “frameworks”, others propose newer Agile and Lean perspectives. However, the ideas of process and project management are occasionally called into question by both employees and various “thought leaders”. In short, it’s all very confusing.
Welcome to the coordination problem. This overall context will cover where these ideas came from, how they relate to each other, and how they are evolving in a digitally transforming world.
Digital Practitioners use a number of approaches to defining and managing work at various scales. Our initial progression from the product, to work, to operations management, can be seen as one dimension. We consider a couple of other dimensions as a basis for ordering Context III.
Here is an overview of Context III’s structure:
Competency Area: Coordination and Process
Going from one to multiple teams is hard. No matter how things are structured, there are dependencies requiring coordination. How to ensure that broader goals are met when teams must act jointly? Some suggest project management, while others argue that you don’t need it any more — it’s all about continuous flow through loosely-coupled product organizations. But the most ambitious ideas require some kind of choreography and products and projects need certain resources and services delivered predictably. When is work repeatable? When is it unique? Understanding the difference is essential to the organization’s success. Is variability in the work always bad? These are questions that have preoccupied management thinkers for a long time.
Competency Area: Investment and Portfolio
Each team also represents an investment decision. There is now a portfolio of features, and/or products. The organization needs a strategy for choosing among options and planning — at least at a high level — in terms of costs and benefits. Some may be using project management to help manage investments. Vendor relationships continue to expand; they are another form of strategic investment, and the practitioner needs to deepen their understanding of matters like cloud contracts and software licensing.
|
Note
|
In terms of classic project methodology, Section 6.3.2, “Investment and Portfolio” includes project initiating and planning. Execution, monitoring, and control of day-to-day work are covered in Section 6.3.1, “Coordination and Process”. The seemingly backwards order is deliberate, in keeping with the scaling model. |
Competency Area: Organization and Culture
The organization is getting big. In order to keep growing, it has had to divide into increasingly complex structures. How is it formally structured? How are people grouped, and to whom do they report, with what kind of expectations? Finally, what is the approach to bringing new people into the organization? What are the unspoken assumptions that underlie the daily work — in other words, what is the culture? Does the culture support high performance, or the opposite? How can such a thing be measured and known?
Context III "Team of Teams" High-Level Dimensions
-
Identify key drivers for the transition from a unitary team to a "team of teams"
-
Identify basics of the coordination problem and how to solve it, including the pros and cons of traditional process management
-
Identify the investment and portfolio consequences of a multi-team structure
-
Identify the basic product/function spectrum of organizational forms
-
Identify important cultural factors and concepts of measuring and changing culture
6.3.1. Coordination and Process
Area Description
The digital team been executing its objectives since its earliest existence. Execution is whenever we meet demand with supply. An idea for a new feature, to deliver some digital value, is demand. The time spent implementing the feature is supply. The two combined is execution. Sometimes it goes well; sometimes it doesn’t. Maintaining a tight feedback loop to continually assess execution is essential.
As the organization grows into multiple teams and multiple products, it has more complex execution problems, requiring coordination. The fundamental problem is the “D-word": dependency. Dependencies are why the organization must coordinate (work with no dependencies can scale nicely along the AKF x-axis). But when there are dependencies (and there are various kinds) the organization needs a wider range of techniques. One Kanban board is not sufficient to the task.
The practitioner must consider the delivery models, as well (the “3 Ps": product, project, process, and now we have added program management). Decades of industry practice mean that people will tend to think in terms of these models and unless there is clarity about the nature of our work the organization can easily get pulled into non-value-adding arguments. To help understanding, this Competency Area will take a deeper look at process management, continuous improvement, and their challenges.
6.3.1.1. Coordination Principles and Techniques
Description
As an organization scales, there is an increasing span in its time horizon and the scope of work it considers and executes. Evolving from the immediate, “hand-to-mouth” days of a startup, it now must concern itself with longer and longer timeframes: contracts, regulations, and the company’s strategy as it grows all demand this.
Granularity
The terminology used to describe work also becomes more diverse, reflecting in some ways the broader time horizons the organization is concerned with. Requests, changes, incidents, work orders, releases, stories, features, problems, major incidents, epics, refreshes, products, programs, strategies; there is a continuum of terminology from small to large. Mostly, the range of work seems tied to how much planning time is available, but there are exceptions: disasters take a lot of work, but don’t provide much advance warning! So the size of work is independent of the planning horizon.
This is significantly evolved since the earlier discussion of work management. By the time the organization started to formalize operations, work was tending to differentiate. Still, regardless of the label put on a given activity, it represents some set of tasks or objectives that real people are going to take the time to perform, and expect to be compensated for. It is all demand, requiring management. Remembering this is essential to digital management.
And, as organizations scale, dependencies proliferate: the central topic of this Competency Area.
6.3.1.1.1. Example: Scaling One Product
Good team structure can go a long way toward reducing dependencies but will not eliminate them.
Succeeding with Agile
What’s typically underestimated is the complexity and indivisibility of many large-scale coordination tasks.
Preface to the Open Organization: Igniting Passion and Performance
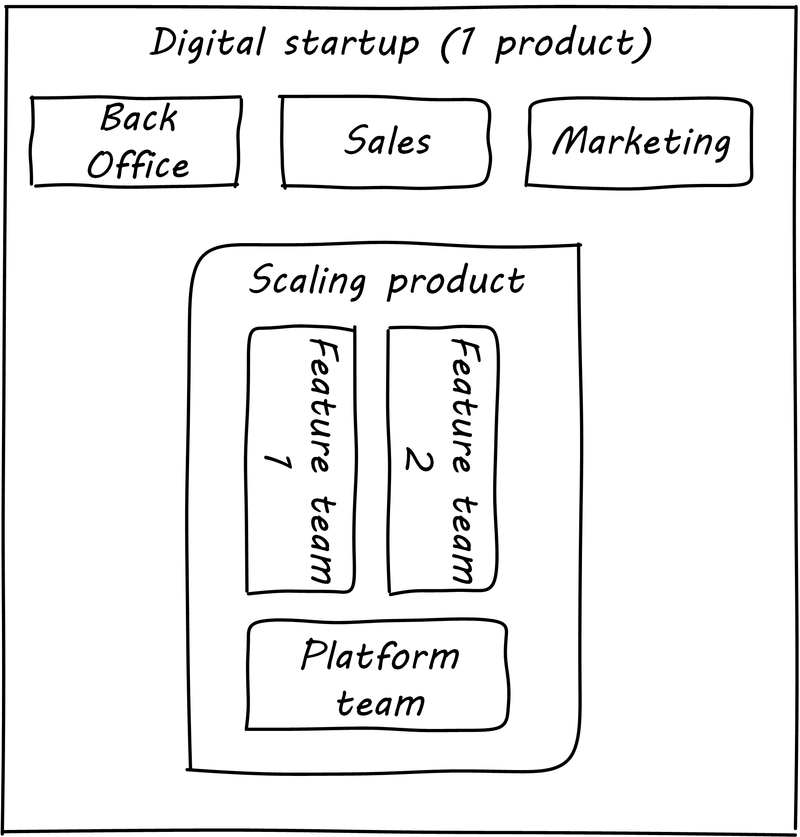
With the move to team of teams, the organization is now executing in a more complex environment; it has started to scale along the AKF scaling cube y-axis, and has either multiple teams working on one product and/or multiple products. Execution becomes more than just “pull another story off the Kanban board”. As multiple teams are formed (see Figure 87, “Multiple Feature Teams, One Product”), dependencies arise, and we need coordination. The term "architecture” is likely emerging through these discussions. (We will discuss organizational structure directly in Section 6.3.3.1, “Structuring the Organization: Product and Function”, and architecture in Section 6.4.3, “Architecture”).
As noted in the discussion of Amazon’s product strategy, some needs for coordination may be mitigated through the design of the product itself. This is why APIs and microservices are popular architecture styles. If the features and components have well-defined protocols for their interaction and clear contracts for matters like performance, development on each team can move forward with some autonomy.
But at scale, complexity is inevitable. What happens when a given business objective requires a coordinated effort across multiple teams? For example, an online e-commerce site might find itself overwhelmed by business success. Upgrading the site to accommodate the new demand might require distinct development work to be performed by multiple teams (see Figure 88, “Coordinated Initiative Across Timeframes”).
As the quote from Gary Hamel above indicates, a central point of coordination and accountability is advisable. Otherwise, the objective is at risk. (It becomes “someone else’s problem”.) We will return to the investment and organizational aspects of multi-team and multi-product scaling in Section 6.3.2, “Investment and Portfolio” and Section 6.3.3, “Organization and Culture”. For now, we will focus on dependencies and operational coordination.
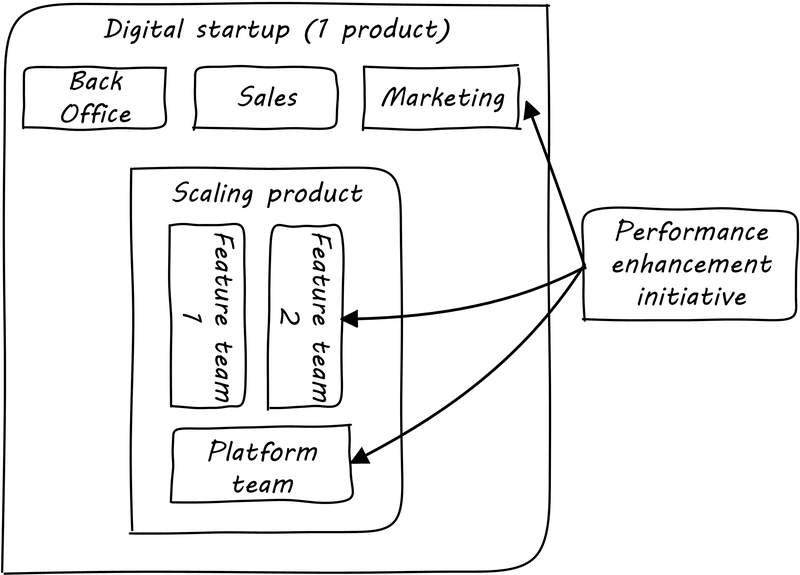
6.3.1.1.2. A Deeper Look at Dependencies
Coordination can be seen as the process of managing dependencies among activities.
What is a "dependency"? We need to think carefully about this. According to the definition above (from [187]), without dependencies, we do not need coordination. (We will look at other definitions of coordination in the next two Competency Areas.) Diane Strode and her associates [269] have described a comprehensive framework for thinking about dependencies and coordination, including a dependency taxonomy, an inventory of coordination strategies, and an examination of coordination effectiveness criteria.
To understand dependencies, Strode et al. [270] propose the framework shown in Table 15, “Dependency Taxonomy (from Strode)” (adapted from [270]).
| Type | Dependency | Description |
|---|---|---|
Knowledge. A knowledge dependency occurs when a form of information is required in order for progress. |
Requirement |
Domain knowledge or a requirement is not known and must be located or identified. |
Expertise |
Technical or task information is known only by a particular person or group. |
|
Task allocation |
Who is doing what, and when, is not known. |
|
Historical |
Knowledge about past decisions is needed. |
|
Task. A task dependency occurs when a task must be completed before another task can proceed. |
Activity |
An activity cannot proceed until another activity is complete. |
Business process |
An existing business process causes activities to be carried out in a certain order. |
|
Resource. A resource dependency occurs when an object is required for progress. |
Entity |
A resource (person, place or thing) is not available. |
Technical |
A technical aspect of development affects progress, such as when one software component must interact with another software component. |
We can see examples of these dependencies throughout digital products. In the next section, we will talk about coordination techniques for managing dependencies.
6.3.1.1.3. Organizational Tools and Techniques
Our previous discussion of work management was a simple, idealized flow of uniform demand (new product functionality, issues, etc.). Tasks, in general, did not have dependencies, or dependencies were handled through ad hoc coordination within the team. We also assumed that resources (people) were available to perform the tasks; resource contention, while it certainly may have come up, was again handled through ad hoc means. However, as we scale, simple Kanban and visual Andon are no longer sufficient, given the nature of the coordination we now require. We need a more diverse and comprehensive set of techniques.
|
Important
|
The discussion of particular techniques is always hazardous. People will tend to latch on to a promising approach without full understanding. As noted by Craig Larman, the risk is one of cargo cult thinking in your process adoption [175 p. 44]. In Section 6.3.3, “Organization and Culture” we will discuss the Mike Rother book Toyota Kata. Toyota does not implement any procedural change without fully understanding the “target operating condition” — the nature of the work and the desired changes to it. |
As we scale up, we see that dependencies and resource management have become defining concerns. However, we retain our Lean Product Development concerns for fast feedback and adaptability, as well as a critical approach to the idea that complex initiatives can be precisely defined and simply executed through open-loop approaches. In this section, we will discuss some of the organizational responses (techniques and tools) that have emerged as proven responses to these emergent issues.
|
Note
|
The table Table 16, “Coordination Taxonomy (from Strode)” uses the concept of artifact, which we introduced in Section 6.2.2, “Work Management”. For our purposes here, an artifact is a representation of some idea, activity, status, task, request, or system. Artifacts can represent or describe other artifacts. Artifacts are frequently used as the basis of communication. |
Strode et al. also provide a useful framework for understanding coordination mechanisms, excerpted and summarized into Table 16, “Coordination Taxonomy (from Strode)” (adapted from [269]).
| Strategy | Component | Definition |
|---|---|---|
Structure |
Proximity |
Physical closeness of individual team members. |
Availability |
Team members are continually present and able to respond to requests for assistance or information. |
|
Substitutability |
Team members are able to perform the work of another to maintain time schedules. |
|
Synchronization |
Synchronization activity |
Activities performed by all team members simultaneously that promote a common understanding of the task, process, and/or expertise of other team members. |
Synchronization artifact |
An artifact generated during synchronization activities. |
|
Boundary spanning |
Boundary spanning activity |
Activities (team or individual) performed to elicit assistance or information from some unit or organization external to the project. |
Boundary spanning artifact |
An artifact produced to enable coordination beyond the team and project boundaries. |
|
Coordinator role |
A role taken by a project team member specifically to support interaction with people who are not part of the project team but who provide resources or information to the project. |
The following sections expand the three strategies (structure, synchronization, boundary spanning) with examples.
Don Reinertsen proposes “The Principle of Colocation” which asserts that “Colocation improves almost all aspects of communication” [230 p. 230]. In order to scale this beyond one team, we logically need what Mike Cohn calls “The Big Room” [68 p. 346].
In terms of communications, this has significant organizational advantages. Communications are as simple as walking over to another person’s desk or just shouting out over the room. It is also easy to synchronize the entire room, through calling for everyone’s attention. However, there are limits to scaling the “Big Room” approach:
-
Contention for key individuals' attention
-
“All hands” calls for attention that actually interests only a subset of the room
-
Increasing ambient noise in the room
-
Distracting individuals from intellectually demanding work requiring concentration, driving multi-tasking and context-switching, and ultimately interfering with their personal sense of flow — a destructive outcome (see [77] for more on flow as a valuable psychological state)
The tension between team coordination and individual focus will likely continue. It is an ongoing topic in facilities design.
If the team cannot work all the time in one room, perhaps they can at least be gathered periodically. There is a broad spectrum of synchronization approaches:
All of them are essentially similar in approach and assumption: build a shared understanding of the work, objectives, or mission among smaller or larger sections of the organization, through limited-time face-to-face interaction, often on a defined time interval.
Cadenced Approaches
When a synchronization activity occurs on a timed interval, this can be called a cadence. Sometimes, cadences are layered; for example, a daily standup, a weekly review, and a monthly Scrum of Scrums. Reinertsen calls this harmonic cadencing [230 pp. 190-191]. Harmonic cadencing (monthly, quarterly, and annual financial reporting) has been used in financial management for a long time.
Examples of boundary-spanning liaison and coordination structures include:
-
Shared team members
-
Integration teams
-
Coordination roles
-
Communities of practice
-
Scrum of Scrums
-
Submittal schedules
-
API standards
-
RACI/ECI decision rights
Shared team members are suggested when two teams have a persistent interface requiring focus and ownership. When a product has multiple interfaces that emerge as a problem requiring focus, an integration team may be called for. Coordination roles can include project and program managers, release train conductors, and the like. Communities of practice will be introduced in Section 6.3.3, “Organization and Culture” when we discuss the Spotify model. Considered here, they may also play a coordination role as well as a practice development/maturity role.
Finally, the idea of a Scrum of Scrums is essentially a representative or delegated model, in which each Scrum team sends one individual to a periodic coordination meeting where matters of cross-team concern can be discussed and decisions made [68], Chapter 17.
Cohn cautions: “A Scrum of Scrums meeting will feel nothing like a daily Scrum despite the similarities in names. The daily Scrum is a synchronization meeting: individual team members come together to communicate about their work and synchronize their efforts. The Scrum of Scrums, on the other hand, is a problem-solving meeting and will not have the same quick, get-in-get-out tone of a daily Scrum [68 p. 342].”
Another technique mentioned in The Checklist Manifesto [109] is the submittal schedule. Some work, while detailed, can be planned to a high degree of detail (i.e., the “checklists” of the title). However, emergent complexity requires a different approach — no checklist can anticipate all eventualities. In order to handle all the emergent complexity, the coordination focus must shift to structuring the right communications. In examining modern construction industry techniques, Gawande noted the concept of the “submittal schedule”, which “didn’t specify construction tasks; it specified communication tasks” (p.65, emphasis supplied). With the submittal schedule, the project manager tracks that the right people are talking to each other to resolve problems — a key change in focus from activity-centric approaches.
We have previously discussed APIs in terms of Amazon's product strategy. They are also important as a product scales into multiple components and features; API standards can be seen as a boundary-spanning mechanism.
The above discussion is by no means exhaustive. A wealth of additional techniques relevant for Digital Practitioners is to be found in [175, 68]. New techniques are continually emerging from the front lines of the digital profession; the interested student should consider attending industry conferences such as those offered by the Agile Alliance.
In general, the above approaches imply synchronized meetings and face-to-face interactions. When the boundary-spanning approach is based on artifacts (often a requirement for larger, decentralized enterprises), we move into the realms of process and project management. Approaches based on routing artifacts into queues often receive criticism for introducing too much latency into the product development process. When artifacts such as work orders and tickets are routed for action by independent teams, prioritization may be arbitrary (not based on business value; e.g., cost of delay). Sometimes the work must flow through multiple queues in an uncoordinated way. Such approaches can add dangerous latency to high-value processes, as we warned in Section 6.2.2, “Work Management”. We will look in more detail at process management in a later section.
6.3.1.1.4. Coordination Effectiveness
Diane Strode and her colleagues propose that coordination effectiveness can be understood as the following taxonomy:
-
Implicit
-
Knowing why (shared goal)
-
Know what is going on and when
-
Know what to do and when
-
Know who is doing what
-
Know who knows what
-
-
Explicit
-
Right place
-
Right thing
-
Right time
-
Coordinated execution means that teams have a solid common ground of what they are doing and why, who is doing it, when to do it, and where to go for information. They also have the material outcomes of the right people being in the right place doing the right thing at the right time. These coordination objectives must be achieved with a minimum of waste, and with a speed supporting an OODA loop tighter than the competition’s. Indeed, this is a tall order!
Evidence of Notability
The emergence of coordination concerns in response to organizational scaling is a common topic in the Agile literature. See, for example, [175, 68].
Limitations
Coordination introduces overhead. Beyond a certain point, it becomes infeasible to coordinate across all dependencies.
Related Topics
6.3.1.2. Coordination, Execution, and the Delivery Models
Description
If we take the strategies proposed by Strode et al. and think of them as three, orthogonal dimensions, we can derive another useful three-dimensional figure (see Figure 89, “Cube Derived from Strode”):
-
Projects often are used to create and deploy processes; a large system implementation (e.g., of an Enterprise Resource Planning (ERP) module such as Human Resources Management) will often be responsible for process implementation including training
-
As environments mature, product, and/or project teams require process support
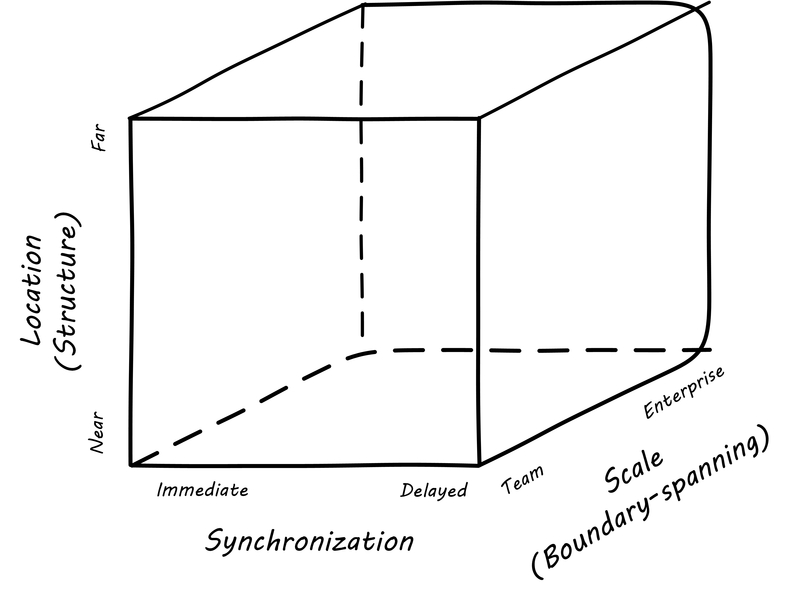
-
At the origin point, we have practices like face-to-face meetings at various scales
-
Geographically distant, immediate coordination is achieved with messaging and other forms of telecommunications
-
Co-located but asynchronous coordination is achieved through shared artifacts like Kanban boards
-
Distant and asynchronous coordination again requires some kind of telecommunications
The Z-axis is particularly challenging, as it represents scaling from a single to multiple and increasingly organizationally distant teams. Where a single team may be able to maintain a good sense of common ground even when geographically distant, or working asynchronously, adding the third dimension of organizational boundaries is where things get hard. Larger-scale coordination strategies include:
-
Operational digital processes (Section 6.2.3, “Operations Management”)
-
Change management
-
Incident management
-
Request management
-
Problem management
-
Release management
-
-
Specified decision rights
-
Projects and project managers (Section 6.3.2, “Investment and Portfolio”)
-
Shared services and expertise (Section 6.3.2, “Investment and Portfolio”)
-
Organization structures (Section 6.3.3, “Organization and Culture”)
-
Cultural norms (Section 6.3.3, “Organization and Culture”)
-
Architecture standards (Section 6.4.2, “Information Management” and Section 6.4.3, “Architecture”)
All of these coping mechanisms risk compromising to some degree the effectiveness of co-located, cross-functional teams. Remember that the high-performing product team is likely the highest-value resource known to the modern organization. Protecting the value of this resource is critical as the organization scales up. The challenge is that models for coordinating and sustaining complex digital services are not well understood. IT organizations have tended to fall back on older supply-chain thinking, with waterfall-derived ideas that work can be sequenced and routed between teams of specialists. (More on this to come in Section 6.3.3, “Organization and Culture”.)
|
Note
|
We recommend you review the definitions of the “3 Ps": product, project, and process management. |
6.3.1.2.1. Product Management Release Trains
Where project and process management are explicitly coordination-oriented, product management is broader and focused on outcomes. As noted previously, it might use either project or a process management to achieve its outcomes, or it might not.
Release management was introduced in Context I, and has remained a key concept we will return to now. Release management is a common coordination mechanism in product management, even in environments that don’t otherwise emphasize processes or projects. At scale, the concept of a “release train” is seen. SAFe considers it the “primary value delivery construct” [245].
The train is a cadenced synchronization strategy. It “departs the station” on a reliable schedule. As with Scrum, date and quality are fixed, while the scope is variable. SAFe emphasizes that “being on the train” in general is a full-time responsibility, so the train is also a temporary organizational or programmatic concept. The release train “engineer” or similar role is an example of the coordinator role seen in the Strode coordination tools and techniques matrix.
The release train is a useful concept for coordinating large, multi-team efforts, and is applicable in environments that have not fully adopted Agile approaches. As author Joanna Rothman notes: “You can de-scope features from a particular train, but you can never allow a train to be late. That helps the project team focus on delivering value and helps your customer become accustomed to taking the product on a more frequent basis” [240].
6.3.1.2.2. Project Management as Coordination
|
Note
|
We will talk about project management as an investment strategy in a future section. In this Competency Area, we look at it as a coordination strategy. Project management adds concerns of task ordering and resource management, for efforts typically executed on a one-time basis. Project management groups together a number of helpful coordination tools which is why it is widely used. These tools include: |
-
Sequencing tasks
-
Managing task dependencies
-
Managing resource dependencies of tasks
-
Managing overall risk of interrelated tasks
-
Planning complex activity flows to complete at a given time
However, project management also has a number of issues:
-
Projects are by definition temporary, while products may last as long as there is market demand
-
Project management methodology, with its emphasis on predictability, scope management, and change control, often conflicts with the product management objective of discovering information (see the discussion of Lean Product Development)
(But not all large management activities involve the creation of new information! Consider the previous example of upgrading the RAM in 80,000 POS terminals in 2,000 stores.)
The project paradigm has a benefit in its explicit limitation of time and money, and the sense of urgency this creates. In general, scope, execution, limited resources, deadlines, and dependencies exist throughout the digital business. A product manager with no understanding of these issues, or tools to deal with them, will likely fail. Product managers should, therefore, be familiar with the basic concepts of project management. However, the way in which project management is implemented, the degree of formality, will vary according to need.
A project manager may still be required, to facilitate discussions, record decisions, and keep the team on track to its stated direction and commitments. Regardless of whether the team considers itself “Agile”, people are sometimes bad at taking notes or being consistent in their usage of tools such as Kanban boards and standups.
It is also useful to have a third party who is knowledgeable about the product and its development, yet has some emotional distance from its success. This can be a difficult balance to strike, but the existence of the role of Scrum coach is indicative of its importance.
We will take another look at project management, as an investment management approach, in Section 6.3.2, “Investment and Portfolio”.
6.3.1.2.3. Decision Rights
Approvals are a particular form of activity dependency, and since approvals tend to flow upwards in the organizational hierarchy to busy individuals, they can be a significant source of delay and, as Reinertsen points out [229 p. 108], discovering “invisible electric fences” by trial and error is both slow and also reduces human initiative. One boundary spanning coordination artifact an organization can produce as a coordination response is a statement of decision rights; for example, a RACI analysis. RACI stands for:
-
Responsible
-
Accountable (sometimes understood as Approves)
-
Consulted
-
Informed
A RACI analysis is often used when accountability must be defined for complex activities. It is used in process management, and also is seen in project management and general organizational structure.
| Team Member | Product Owner | Chief Product Owner | |
|---|---|---|---|
Change interface affecting two modules |
Responsible |
Accountable |
Informed |
Change interface affecting more than two modules |
Responsible |
Informed |
Accountable |
Hire new team member |
Consulted |
Responsible |
Accountable |
Some Agile authors[6] call for an “ECI” matrix, with the “E” standing for empowered, defined as both Accountable and Responsible.
6.3.1.2.4. Process Management as Coordination
We discussed the emergence of process management in Section 6.2.2, “Work Management”, and in Section 6.2.3, “Operations Management” the basic digital processes of change, incident, problem, and request management.
As we saw in the Strode dependency taxonomy, waiting on a business process is a form of dependency. But business processes are more than just dependency sources and obstacles; they themselves are a form of coordination. In Strode’s terms, they are a boundary spanning activity. It is ironic that a coordination tool itself might be seen as a dependency and blockage to work; this shows at least the risk of assuming that all problems can or should be solved by tightly specified business processes!
Like project management, process management is concerned with ordering, but less so with the resource load (more on this to come), and more with repeatability and ongoing improvement. The concept of process is often contrasted with that of function or organization. Process management’s goal is to drive repeatable results across organizational boundaries. As we know from our discussion of product management, developing new products is not a particularly repeatable process. The Agile movement arose as a reaction to mis-applied process concepts of "repeatability” in developing software. These concerns remain. However, this document covers more than development. We are interested in the spectrum of digital operations and effort that spans from the unique to the highly repeatable. There is an interesting middle ground of processes that are at least semi-repeatable. Examples often found in the large digital organization include:
-
Assessing, approving, and completing changes
-
End-user equipment provisioning
-
Resolving incidents and answering user inquiries
-
Troubleshooting problems
We will discuss a variety of such processes, and the pros and cons of formalizing them, in the section on industry frameworks. In Section 6.4.1, “Governance, Risk, Security, and Compliance”, we will discuss IT governance in depth. The concept of “control” is critical to IT governance, and processes often play an important role in terms of control.
Just as the traditional IT project is under pressure, there are similar challenges for the traditional IT process. DevOps and continuous delivery are eroding the need for formal change management. Consumerization is challenging traditional internal IT provisioning practices. And self-service help desks are eliminating some traditional support activities. Nevertheless, any rumors of an “end to process” are probably greatly exaggerated. Measurability remains a concern; the Lean philosophy underpinning much Agile thought emphasizes measurement. There will likely always be complex combinations of automated, semi-automated, and manual activity in digital organizations. Some of this activity will be repeatable enough that the “process” construct will be applied to it.
6.3.1.2.5. Projects and Processes
Project management and process management interact in two primary ways as Figure 90, “Process and Project” illustrates:
-
Projects often are used to create and deploy processes - a large system implementation (e.g., of an ERP module such as Human Resources Management) will often be responsible for process implementation including training
-
As environments mature, product and/or project teams require process support
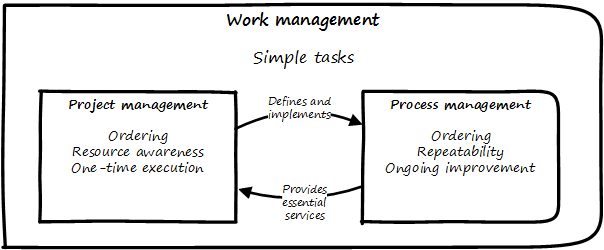
As Richardson notes in Project Management Theory and Practice: “there are many organizational processes that are needed to optimally support a successful project” [231]. For example, the project may require predictable contractor hiring, or infrastructure provisioning, or security reviews. The same is true for product teams that may not be using a “project” concept to manage their work. To the extent these are managed as repeatable, optimized processes, the risk is reduced. The trouble is when the processes require prioritization of resources to perform them. This can lead to long delays, as the teams performing the process may not have the information to make an informed prioritization decision. Many IT professionals will agree that the relationship between application and infrastructure teams has been contentious for decades because of just this issue. One response has been increasing automation of infrastructure service provisioning (private and external cloud).
Evidence of Notability
Coordination is a management fundamental. The basic models presented here (product management, project management, and process management) all have extensive bodies of literature and communities of practitioners.
Limitations
Coordination is costly, and the more that there are requirements for it to scale or be exactly precise, the more expensive it is.
Related Topics
6.3.1.3. Process Management
Description
Dictionary.com defines process as “a systematic series of actions directed to some end … a continuous action, operation, or series of changes taking place in a definite manner”. We saw the concept of “process” start to emerge in Section 6.2.2, “Work Management”, as work become more specialized and repeatable and our card walls got more complicated.
We have discussed work management, which is an important precursor of process management. Work management is less formalized; a wide variety of activities are handled through flexible Kanban-style boards or “card walls” based on the simplest “process” of:
-
To do
-
Doing
-
Done
However, the simple card wall/Kanban board can easily become much more complex, with the addition of swimlanes and additional columns, including holding areas for blocked work. As we discussed in Section 6.2.2, “Work Management”, when tasks become more routine, repeatable, and specialized, formal process management starts to emerge. Process management starts with the fundamental capability for coordinated work management, and refines it much further.
Process, in terms of “business process”, has been a topic of study and field for professional development for many years. Pioneering BPM authors such as Michael Hammer [121] and Geary Rummler [244] have had an immense impact on business operations, with concepts such as Hammer’s Business Process Re-engineering (BPR). BPR initiatives are intended to identify waste and streamline processes, eliminating steps that no longer add value. BPR efforts often require new or enhanced digital systems.
In the Lean world, value stream mapping represents a way of understanding the end-to-end flow of value, typically in a manufacturing or supply chain operational context [239].
The Lean Enterprise Institute defines value stream as: “All of the actions, both value-creating and non-value-creating, required to bring a product from concept to launch (also known as the development value stream) and from order to delivery (also known as the operational value stream). These include actions to process information from the customer and actions to transform the product on its way to the customer.”
Making value streams visible helps understand current conditions and identify issues and problems. A Value Stream Map (VSM) is a simple diagram of every step involved in the material and information flows needed to deliver value. The Lean Enterprise Institute indicates that: "Value Stream Maps can be drawn for different points in time as a way to raise consciousness of opportunities for improvement. A current state map follows a product’s path from order to delivery to determine the current conditions. A future state map deploys the opportunities for improvement identified in the current state map to achieve a higher level of performance at some future point".
Toyota considers a clear process vision, or “target condition”, to be the most fundamental objective for improving operations [238], Chapters 5 and 6. Designing processes, improving them, and using them to improve overall performance is an ongoing activity in most, if not all organizations. VSM is a powerful tool that can help define a clear process vision.
In your company, work has been specializing. A simple card-based Kanban approach is no longer sufficient. You are finding that some work is repetitive, and you need to remember to do certain things in certain orders. For example, a new human resources manager was hired and decided that a sticky note of “hire someone new for us” was not sufficient. As she pointed out to the team, hiring employees was a regulated activity, with legal liability, requiring confidentiality, that needed to follow a defined sequence of tasks:
-
Establishing the need and purpose for the position
-
Soliciting candidates
-
Filtering the candidates
-
Selecting a final choice
-
Registering that new employee in the payroll system
-
Getting the new employee set up with benefits providers (insurance, retirement, etc.)
-
Getting the new employee working space, equipment, and access to systems
-
Training the new employee in organizational policies, as well as any position-specific orientation
The sales, marketing, and finance teams have similarly been developing ordered lists of tasks that are consistently executed as end-to-end sequences. And even in the core digital development and operations teams, they are finding that some tasks are repetitive and need documentation so they are performed consistently.
Your entire digital product pipeline may be called a “process”. From initial feature idea through production, you seek a consistent means for identifying and implementing valuable functionality. Sometimes this work requires intensive, iterative collaboration and is unpredictable (e.g., developing a user interface); sometimes, the work is more repeatable (e.g., packaging and releasing tested functionality).
You are hiring more specialized people with specialized backgrounds. Many of them enter your organization and immediately ask process questions:
-
What is your security process?
-
What is your architecture process?
-
What is your portfolio process?
You have not had these conversations before. What do they mean by these different “processes”? They seem to have some expectation based on their previous employment, and if you say “we don’t have one” they tend to be confused. You are becoming concerned that your company may be running some risk, although you also are wary that “process” might mean slowing things down, and you can’t afford that.
However, some team members are cautious of the word “process". The term "process police” arises in an unhappy way.
“Are we going to have auditors tracking whether we filled out all our forms correctly?” one asks.
“We used to get these "process consultants" at my old company, and they would leave piles of three-ring binders on the shelf that no-one ever looked at” another person says.
“I can’t write code according to someone’s recipe!” a third says with some passion, and to general agreement from the developers in the room.
The irony is that digital products are based on process automation. The idea that certain tasks can be done repeatably and at scale through digitization is fundamental to all use of computers. The digital service is fundamentally an automated process, one that can be intricate and complicated. That is what computers do. But, process management also spans human activities, and that’s where things get more complex.
Processes are how we ensure consistency, repeatability, and quality. You get expected treatment at banks, coffee shops, and dentists because they follow processes. IT systems often enable processes – a mortgage origination system is based on IT software that enforces a consistent process. IT management itself follows certain processes, for all the same reasons as above.
However, processes can cause problems. Like project management, the practice of process management is under scrutiny in the new Lean and Agile-influenced digital world. Processes imply queues, and in digital and other product development-based organizations, this means invisible work-in-process. For every employee you hire who expects you to have processes, another will have bad process experiences at previous employers. Nevertheless, process remains an important tool in your toolkit for organization design.
Process is a broad concept used throughout business operations. The coverage here is primarily about process as applied to the digital organization. There is a bit of a recursive paradox here; in part, we are talking about the process by which business processes are analyzed and sometimes automated. By definition, this overall “process” (you could call it a meta-process) cannot be made too prescriptive or predictable.
The concept of “process” is important and will persist through Digital Transformation. We need a robust set of tools to discuss it. This Competency Area will break the problem into a lifecycle of:
-
Process conception
-
Process content
-
Process execution
-
Process improvement
Although we don’t preface these topics with “Agile” or “Lean”, bringing these together with related perspectives is the intent of this Competency Category.
6.3.1.3.1. Process Conception
Processes can provoke reactions when their value is not understood, or has decayed. Such reactions are commonplace in social media (and even well-regarded professional books), but we need a more objective and rational approach to understand the pros and cons of processes. We have seen a number of neutral concepts towards this end from authors such as Don Reinertsen and Diane Strode:
A process is a technique, a tool, and no technique should be implemented without a thorough understanding of the organizational context. Nor should any technique be implemented without rigorous, disciplined follow-up as to its real effects, both direct and indirect. Many of the issues with process come from a cultural failure to seek an understanding of the organization needs in objective terms such as these. We will think about this cultural failure more in the discussion of Toyota Kata.
A skeptical and self-critical, “go and see” approach is, therefore, essential. Too often, processes are instituted in reaction to the last crisis, imposed top-down, and rarely evaluated for effectiveness. Allowing affected parties to lead a process re-design is a core Lean principle (kaizen). On the other hand, uncoordinated local control of processes can also have destructive effects as discussed below.
6.3.1.3.2. Process Execution
Since our initial discussions in Section 6.2.2, “Work Management” on work management, we find ourselves returning full circle. Despite the various ways in which work is conceived, funded, and formulated, at the end “it’s all just work”. The digital organization must retain a concern for the “human resources” (that is, people) who find themselves at the mercy of:
-
Project fractional allocations driving multi-tasking and context-switching
-
Processes imposed top-down with little demand analysis or evaluation of benefits
-
Myriad demands that, although critical, do not seem to fit into either of the first two categories
The Lean movement manages through minimizing waste and over-processing. This means both removing unnecessary steps from processes, and eliminating unnecessary processes completely when required. Correspondingly, the processes that remain should have high levels of visibility. They should be taken with the utmost seriousness, and their status should be central to most people’s awareness. This is the purpose of Andon.
From workflow tools to collaboration and digital exhaust. One reason process tends to generate friction and be unpopular is the poor usability of workflow tools. Older tools tend to present myriads of data fields to the user and expect a high degree of training. Each state change in the process is supposed to be logged and tracked by having someone sign in to the tool and update status manually.
By contrast, modern workflow approaches take full advantage of mobile platforms and integration with technology like chatrooms and ChatOps. Mobile development imposes higher standards for User Experience (UX) design, which makes tracking workflow somewhat easier. Integrated software pipelines that integrate Application Lifecycle Management (ALM) and/or project management with source control and build management are increasingly gaining favor. For example:
-
A user logs a new feature request in the ALM tool
-
When the request is assigned to a developer, the tool automatically creates a feature branch in the source control system for the developer to work on
-
The developer writes tests and associated code and merges changes back to the central repository once tests are passed successfully
-
The system automatically runs build tests
-
The ALM tool is automatically updated accordingly with completion if all tests pass
See also the previous discussion of ChatOps, which similarly combines communication and execution in a low-friction manner, while providing rich digital exhaust as an audit trail.
In general, the idea is that we can understand digital processes not through painful manual status updates, but rather through their digital exhaust — the data byproducts of people performing the value-add day-to-day work, at speed, and with the flow instead of constant delays for approvals and status updates.
6.3.1.3.3. Measuring Process
One of the most important reasons for repeatable processes is so that they can be measured and understood. Repeatable processes are measured in terms of:
-
Speed
-
Effort
-
Quality
-
Variation
-
Outcomes
at the most general level and, of course, all of those measurements must be defined much more specifically depending on the process. Operations (often in the form of business processes) generate data, and data can be aggregated and reported on. Such reporting serves as a form of feedback for management and even governance. Examples of metrics might include:
-
Quarterly sales as a dollar amount
-
Percentage of time a service or system is available
-
Number of successful releases or pushes of code (new functionality)
Measurement is an essential aspect of process management but must be carefully designed. Measuring processes can have unforeseen results. Process participants will behave according to how the process is measured. If a help desk operator is measured and rated on how many calls they process an hour, the quality of those interactions may suffer. It is critical that any process “Key Performance Indicator” (KPI) be understood in terms of the highest possible business objectives. Is the objective truly to process as many calls as possible? Or is it to satisfy the customer so they need not turn to other channels to get their answers?
A variety of terms and practices exist in process metrics and measurement, such as:
-
The Balanced Scorecard
-
The concept of a metrics hierarchy
-
Leading versus lagging indicators
The Balanced Scorecard is a commonly seen approach for measuring and managing organizations. First proposed by Kaplan and Norton [163] in the Harvard Business Review, the Balanced Scorecard groups metrics into the following subject areas:
-
Financial
-
Customer
-
Internal business processes
-
Learning and growth
Metrics can be seen as “lower” versus “higher”-level. For example, the metrics from a particular product might be aggregated into a hierarchy with the metrics from all products, to provide an overall metric of product success. Some metrics are perceived to be of particular importance for business processes, and thus may be termed KPIs. Metrics can indicate past performance (lagging), or predict future performance (leading).
6.3.1.3.4. The Disadvantages of Process
Netflix CTO Reed Hastings, in an influential public presentation "Netflix Culture: Freedom and Responsibility", presents a skeptical attitude towards process. In his view, process emerges as a result of an organization’s talent pool becoming diluted with growth, while at the same time its operations become more complex.
Hastings observes that companies that become overly process-focused can reap great rewards as long as their market stays stable. However, when markets change, they also can be fatally slow to adapt. The Netflix strategy is to focus on hiring the highest-performance employees and keeping processes minimal. They admit that their industry (minimally regulated, creative, non-life-critical) is well suited to this approach [126].
One organization enthusiastically embraced process improvement, with good reason: customers, suppliers, and employees found the company’s processes slow, inconsistent, and error-prone. Unfortunately, they were so enthusiastic that each team defined the work of their small group or department as a complete process. Of course, each of these was, in fact, the contribution of a specialized functional group to some larger, but unidentified, processes. Each of these “processes” was “improved” independently, and you can guess what happened.
Within the boundaries of each process, improvements were implemented that made work more efficient from the perspective of the performer. However, these mini-processes were efficient largely because they had front-end constraints that made work easier for the performer but imposed a burden on the customer or the preceding process. The attendant delay and effort meant that the true business processes behaved even more poorly than they had before. This is a common outcome when processes are defined too “small”. Moral: Don’t confuse sub-processes or activities with business processes.
Workflow Modeling
The above quote (from [255]) well illustrates the dangers of combining local optimization and process management. Many current authors speak highly of self-organizing teams, but self-organizing teams may seek to optimize locally. Process management was originally intended to overcome this problem, but modeling techniques can be applied at various levels, including within specific departments. This is where enterprise Business Architecture can assist, by identifying these longer, end-to-end flows of value and highlighting the hand-off areas, so that the process benefits the larger objective.
Another pitfall we cover here is that of process proliferation. Process is a powerful tool. Ultimately it is how value is delivered. However, too many processes can have negative results on an organization. One thing often overlooked in process management and process frameworks is any attention to the resource impacts of the process. This is a primary difference between project and process management; in process management (both theory and frameworks), resource availability is in general assumed.
More advanced forms of process modeling and simulation such as “discrete event simulation” [275] can provide insight into the resource demands for processes. However, such techniques require specialized tooling and are not part of the typical BPM practitioner’s skillset.
Many enterprise environments have multiple cross-functional processes such as:
-
Service requests
-
Compliance certifications
-
Asset validations
-
Provisioning requests
-
Capacity assessments
-
Change approvals
-
Training obligations
-
Performance assessments
-
Audit responses
-
Expense reporting
-
Travel approvals
These processes sometimes seem to be implemented on the assumption that enterprises can always accommodate another process. The result can be a dramatic overburden for digital staff in complex environments. A frequently-discussed responsibility of Scrum masters and product owners is to “run interference” and keep such enterprise processes from eroding team cohesion and effectiveness. It is, therefore, advisable to at least keep an inventory of processes that may impose demand on staff, and understand both the aggregate demand as well as the degree of multi-tasking and context-switching that may result (as discussed in Section 6.2.2, “Work Management”). Thorough automation of all processes to the maximum extent possible can also drive value, to reduce latency, load, and multi-tasking.
Rather than a simplistic view of "process bad" or "process good", it is better to view process as simply a coordination approach. It is a powerful one with important disadvantages. It should be understood in terms of coordination contexts such as time and space shifting and predictability.
It is also important to consider lighter-weight variations on process, such as case management, checklists, and the submittal schedule.
Evidence of Notability
Process management has a long history across business and organizational management in general. Notable works include Michael Hammer’s Re-engineering the Corporation [121] and Rummler and Brache’s Improving Performance [244].
Limitations
Process management, like its earlier precursor (in this document) workflow management, is not well suited for higher-variability, higher-touch tasks.
Related Topics
6.3.1.4. Process Control and Continuous Improvement
Description
|
Note
|
This is some of the most advanced material in this document, but critical to understanding the foundations of Agile methods. |
Once processes are measured, the natural desire is to use the measurements to improve them. Process management, like project management, is a discipline unto itself and one of the most powerful tools in your toolbox. The practitioner eventually starts to realize there is a process by which process itself is managed — the process of continuous improvement. You remain concerned that work continues to flow well, that you don’t take on too much work-in-process, and that people are not overloaded and multi-tasking.
In this Competency Category, we take a deeper look at the concept of process and how processes are managed and controlled. In particular, we will explore the concept of continuous (or continual) improvement and its rich history and complex relationship to Agile.
You are now at a stage in your company’s evolution, or your career, where an understanding of continuous improvement is helpful. Without this, you will increasingly find you don’t understand the language and motivations of leaders in your organization, especially those with business degrees or background.
The scope of the word “process” is immense. Examples include:
-
The end-to-end flow of chemicals through a refinery
-
The set of activities across a manufacturing assembly line, resulting in a product for sale
-
The steps expected of a customer service representative in handling an inquiry
-
The steps followed in troubleshooting a software-based system
-
The general steps followed in creating and executing a project
-
The overall flow of work in software development, from idea to operation
This breadth of usage requires us to be specific in any discussion of the word “process”. In particular, we need to be careful in understanding the concepts of efficiency, variation, and effectiveness. These concepts lie at the heart of understanding process control and improvement and how to correctly apply it in the digital economy.
Companies institute processes because it has been long understood that repetitive activities can be optimized when they are better understood, and if they are optimized, they are more likely to be economical and even profitable. We have emphasized throughout this document that the process by which complex systems are created is not repetitive. Such creation is a process of product development, not production. And yet, the entire digital organization covers a broad spectrum of process possibilities, from the repetitive to the unique. You need to be able to identify what kind of process you are dealing with, and to choose the right techniques to manage it. (For example, an employee provisioning process flow could be simple and prescriptive. Measuring its efficiency and variability would be possible, and perhaps useful.)
There are many aspects of the movement known as “continuous improvement” that we won’t cover in this brief section. Some of them (systems thinking, culture, and others) are covered elsewhere in this document. This document is based in part on Lean and Agile premises, and continuous improvement is one of the major influences on Lean and Agile, so in some ways, we come full circle. Here, we are focusing on continuous improvement in the context of processes and process improvement. We will therefore scope this to a few concerns: efficiency, variation, effectiveness, and process control.
6.3.1.4.1. History of Continuous Improvement
The history of continuous improvement is intertwined with the history of 20th century business itself. Before the Industrial Revolution, goods and services were produced primarily by local farmers, artisans, and merchants. Techniques were jealously guarded, not shared. A given blacksmith might have two or three workers, who might all forge a pan or a sword in a different way. The term “productivity” itself was unknown.
Then the Industrial Revolution happened.
As steam and electric power increased the productivity of industry, requiring greater sums of capital to fund, a search for improvements began. Blacksmith shops (and other craft producers such as grain millers and weavers) began to consolidate into larger organizations, and technology became more complex and dangerous. It started to become clear that allowing each worker to perform the work as they preferred was not feasible.
Enter the scientific method. Thinkers such as Frederick Taylor and Frank and Lillian Gilbreth (of Cheaper by the Dozen fame,) started applying careful techniques of measurement and comparison, in search of the “one best way” to dig ditches, forge implements, or assemble vehicles. Organizations became much more specialized and hierarchical. An entire profession of industrial engineering was established, along with the formal study of business management itself.
6.3.1.4.2. Frederick Taylor and Efficiency
Frederick Taylor (1856-1915) was a mechanical engineer and one of the first industrial engineers. In 1911, he wrote Principles of Scientific Management. One of Taylor’s primary contributions to management thinking was a systematic approach to efficiency. To understand this, let’s consider some fundamentals.
Human beings engage in repetitive activities. These activities consume inputs and produce outputs. It is often possible to compare the outputs against the inputs, numerically, and understand how “productive” the process is. For example, suppose you have two factories producing identical kitchen utensils (such as pizza cutters). If one factory can produce 50,000 pizza cutters for $2,000, while the other requires $5,000, the first factory is more productive.
Assume for a moment that the workers are all earning the same across each factory, and that both factories get the same prices on raw materials. There is possibly a “process” problem. The first factory is more efficient than the second; it can produce more, given the same set of inputs. Why?
There are many possible reasons. Perhaps the second factory is poorly laid out, and the work-in-progress must be moved too many times in order for workers to perform their tasks. Perhaps the workers are using tools that require more manual steps. Understanding the differences between the two factories, and recommending the “best way”, is what Taylor pioneered, and what industrial engineers do to this day.
As Peter Drucker, one of the most influential management thinkers, says of Frederick Taylor:
The history of industrial engineering is often controversial, however. Hard-won skills were analyzed and stripped from traditional craftspeople by industrial engineers with clipboards, who now would determine the “one best way”. Workers were increasingly treated as disposable. Work was reduced to its smallest components of a repeatable movement, to be performed on the assembly line, hour after hour, day after day until the industrial engineers developed a new assembly line. Taylor was known for his contempt for the workers, and his methods were used to increase work burdens sometimes to inhuman levels. Finally, some kinds of work simply can’t be broken into constituent tasks. High-performing, collaborative, problem-solving teams do not use Taylorist principles, in general. Eventually, the term "Taylorism” was coined, and today is often used more as a criticism than a compliment.
6.3.1.4.3. W. Edwards Deming and Variation
The quest for efficiency leads to the long-standing management interest in variability and variation. What do we mean by this?
If you expect a process to take five days, what do you make of occurrences when it takes seven days? Four days? If you expect a manufacturing process to yield 98% usable product, what do you do when it falls to 97%? 92%? In highly repeatable manufacturing processes, statistical techniques can be applied. Analyzing such “variation” has been a part of management for decades, and is an important part of disciplines such as Six Sigma. This is why Six Sigma is of such interest to manufacturing firms.
W. Edwards Deming (1900-1993) is noted for (among many other things) his understanding of variation and organizational responses to it. Understanding variation is one of the major parts of his “System of Profound Knowledge”. He emphasizes the need to distinguish special causes from common causes of variation; special causes are those requiring management attention.
Deming, in particular, was an advocate of the control chart, a technique developed by Walter Shewhart, to understand whether a process was within statistical control (see Figure 91, “Process Control Chart”).

However, using techniques of this nature makes certain critical assumptions about the nature of the process. Understanding variation and when to manage it requires care. These techniques were defined to understand physical processes that in general follow normal distributions.
For example, let’s say you are working at a large manufacturer, in their IT organization, and you see the metric of "variance from project plan”. The idea is that your actual project time, scope, and resources should be the same, or close to, what you planned. In practice, this tends to become a discussion about time, as resources and scope are often fixed.
The assumption is that, for your project tasks, you should be able to estimate to a meaningful degree of accuracy. Your estimates are equally likely to be too low, or too high. Furthermore, it should be somehow possible to improve the accuracy of your estimates. Your annual review depends on this, in fact.
The problem is that neither of these is true. Despite heroic efforts, you cannot improve your estimation. In process control jargon, there are too many causes of variation for “best practices” to emerge. Project tasks remain unpredictable, and the variability does not follow a normal distribution. Very few tasks get finished earlier than you estimated, and there is a long tail to the right, of tasks that take 2x, 3x, or 10x longer than estimated.
In general, applying statistical process control to variable, creative product development processes is inappropriate. For software development, Steven Kan states: “Many assumptions that underlie control charts are not being met in software data. Perhaps the most critical one is that data variation is from homogeneous sources of variation.” That is, the causes of variation are knowable and can be addressed. This is in general not true of development work [160].
Deming (along with Juran) is also known for “continuous improvement” as a cycle; e.g., "Plan/Do/Check/Act” or "Define/Measure/Analyze/Implement/Control”. Such cycles are akin to the scientific method, as they essentially engage in the ongoing development and testing of hypotheses, and the implementation of validated learning. We touch on similar cycles in our discussions of Lean Startup, OODA, and Toyota Kata.
6.3.1.4.4. Problems in Process Improvement
There tended to be no big picture waiting to be revealed … there was only process kaizen … focused on isolated individual steps … We coined the term “kamikaze kaizen” … to describe the likely result: lots of commotion, many isolated victories … [and] loss of the war when no sustainable benefits reached the customer or the bottom line.
and Jones
There are many ways that process improvement can go wrong:
-
Not basing process improvement in an empirical understanding of the situation
-
Process improvement activities that do not involve those affected
-
Not treating process activities as demand in and of themselves
-
Uncoordinated improvement activities, far from the bottom line
The solutions are to be found largely within Lean theory:
-
Understand the facts of the process; do not pretend to understand based on remote reports; “go and see”, in other words
-
Respect people, and understand that best understanding of the situation is held by those closest to it
-
Make time and resources available for improvement activities; for example, assign them a problem ticket and ensure there are resources specifically tasked with working it, who are given relief from other duties
-
Periodically review improvement activities as part of the overall portfolio; you are placing “bets” on them just as with new features - do they merit your investment?
6.3.1.4.5. Lean Product Development and Cost of Delay
the purpose of controlling the process must be to influence economic outcomes. There is no other reason to be interested in process control.
Managing the Design Factory
Discussions of efficiency usually focus on productivity that is predicated on a certain set of inputs. Time can be one of those inputs. Everything else being equal, a company that can produce the pizza cutters more quickly is also viewed as more efficient. Customers may pay a premium for early delivery, and may penalize late delivery; such charges typically would be some percentage (say plus or minus 20%) of the final price of the finished goods.
However, the question of time becomes a game-changer in the “process” of new product development. As we have discussed previously, starting with a series of influential articles in the early 1980s, Don Reinertsen developed the idea of cost of delay for product development [229].
Where the cost of a delayed product shipment might be some percentage, the cost of delay for a delayed product could be much more substantial. For example, if a new product launch misses a key trade show where competitors will be presenting similar innovations, the cost to the company might be millions of dollars of lost revenue or more — many times the product development investment.
This is not a question of “efficiency”; of comparing inputs to outputs and looking for a few percentage points improvement. It is more a matter of effectiveness; of the company’s ability to execute on complex knowledge work.
6.3.1.4.6. Scrum and Empirical Process Control
Ken Schwaber, inventor of the Scrum methodology (along with Jeff Sutherland), like many other software engineers in the 1990s, experienced discomfort with the Deming-inspired process control approach promoted by major software contractors at the time. Mainstream software development processes sought to make software development predictable and repeatable in the sense of a defined process.
As Schwaber discusses [250 pp. 24-25] defined processes are completely understood, which is not the case with creative processes. Highly-automated industrial processes run predictably, with consistent results. By contrast, complex processes that are not understood require an empirical model.
Empirical process control, in the Scrum sense, relies on frequent inspection and adaptation. After exposure to Dupont process theory experts who clarified the difference between defined and empirical process control, Schwaber went on to develop the influential Scrum methodology. As he notes:
During my visit to DuPont … I realized why [software development] was in such trouble and had such a poor reputation. We were wasting our time trying to control our work by thinking we had an assembly line when the only proper control was frequent and first-hand inspection, followed by immediate adjustments. [250 p. 25].
In general, the idea of statistical process control for digital product development is thoroughly discredited. However, this document covers not only digital product development (as a form of R&D). It covers all of traditional IT management, in its new guise of the digitally transformed organization. Development is only part of digital management.
Evidence of Notability
Continuous improvement is a widely recognized topic in management theory. Notable influences include Shewhart, Deming, and Juran. Lean thinking is often noted for its relevance to continuous improvement. Agile and DevOps are explicitly influenced by ideas from continuous improvement (see, for example, cite:[Kim2016(32)).
Limitations
Like systems thinking, discussions of continuous improvement can appear theoretical and the audience should be considered.
Related Topics
6.3.2. Investment and Portfolio
Area Description
The decision to break an organization into multiple teams is in part an investment decision. The organization is going to devote some resources to one team, and some to another team. Furthermore, there will be additional spending still managed at a corporate level. If the results meet expectations, the organization will then likely proceed with further investments managed by the same or similar organization structure. How are these separate streams of investment decided on and managed? What is the approach for structuring them? How does an organization ensure that they are returning the desired results?
People are competitive. Multiple teams will start to contend for investment. This is unavoidable. They will want their activities adequately supported, and their understanding of “adequate” may be different from each other. They will be watching that the other teams don’t get “more than their share” and are using their share effectively. The leader starts to see that the teams need to be constantly reminded of the big picture, in order to keep their discussions and occasional disagreements constructive.
There is now a dedicated, full-time Chief Financial Officer and the organization is increasingly subject to standard accounting and budgeting rules. But annual budgeting seems to be opposed to how the digital startup has run to date. What alternatives are there? The organization’s approach to financial management affects every aspect of the company, including product team effectiveness.
The organization also begins to understand vendor relationships (e.g., your cloud providers) as a form of investment. As the use of their products deepens, it becomes more difficult to switch from them, and so the organization spends more time evaluating before committing. The organization establishes a more formalized approach. Open source changes the software vendor relationship to some degree, but it’s still a portfolio of commitments and relationships requiring management.
Project management is often seen as necessary for financial planning, especially regarding the efforts most critical to the business. The reason it is seen as essential is because of the desire to coordinate, manage, and plan. Having a vision isn’t worth much without some ability to forecast how long it will take and what it will cost, and to monitor progress against the forecast in an ongoing way. Project management is often defined as the execution of a given scope of work within constraints of time and budget. But questions arise. The organization has long been executing work, without this concept of “project”. This document discussed Scrum, Kanban, and various organizational levels and delivery models in the introduction to Context III. This Competency Category will examine this idea of “scope” in more detail. How can it be known in advance, so that the “constraints of time and budget” are reasonable?
As seen in this document’s discussions of product management, in implementing truly new products, (including digital products) estimating time and budget is challenging because the necessary information is not available. In fact, creating information — which (per Lean Product Development) requires tight feedback loops — is the actual work of the “project”. Therefore, in the new Agile world, there is some uncertainty as to the role of and even need for traditional project management. This Competency Category will examine some of the reasons for project management’s persistence and how it is adapting to the new product-centric reality.
In the project management literature and tradition, much focus is given to the execution aspect of project management — its ability to manage complex, interdependent work across resource limitations. We discussed project management and execution in Section 6.3.1.2.2, “Project Management as Coordination”. In this section, we are interested in the structural role of project management as a way of managing investments. Project management may be institutionalized through establishing an organizational function known as the Project Management Office (PMO), which may use a concept of project portfolio as a means of constraining and managing the organization’s multiple priorities. What is the relationship of the traditional PMO to the new, product-centric, digital world?
6.3.2.1. Financial Management of Digital and IT
Description
Financial health is an essential dimension of business health. And digital technology has been one of the fastest-growing budget items in modern enterprises. Its relationship to enterprise financial management has been a concern since the first computers were acquired for business purposes.
|
Important
|
Financial management is a broad, complex, and evolving topic and its relationship to IT and digital management is even more so. This brief section can only cover a few basics. However, it is important for you to have an understanding of the intersection of Agile and Lean IT with finance, as your organization’s financial management approach can determine the effectiveness of your digital strategy. |
The objectives of IT finance include:
-
Providing a framework for tracking and accounting for digital income and expenses
-
Supporting financial analysis of digital strategies (business models and operating models, including sourcing)
-
Supporting the digital and IT-related aspects of the corporate budgetary and reporting processes, including internal and external policy compliance
-
Supporting (where appropriate) internal cost recovery from business units consuming digital services
-
Supporting accurate and transparent comparison of IT financial performance to peers and market offerings (benchmarking)
A company scaling up today would often make different decisions from a company that scaled up 40 years ago. This is especially apparent in the matter of how to finance digital/IT systems development and operations. The intent of this section is to explore both the traditional approaches to IT financial management and the emerging Agile/Lean responses.
This section has the following outline:
-
Historical IT financial practices
-
Annual budgeting and project funding
-
Cost accounting and chargeback
-
-
Next-generation IT finance
-
Lean Accounting & Beyond Budgeting
-
Lean Product Development
-
Internal “venture” funding
-
Value stream orientation
-
Internal market economics
-
Service brokerage
-
6.3.2.1.1. Historic IT Financial Practices
Historically, IT financial management has been defined by two major practices:
-
An annual budgeting cycle, in which project funding is decided
-
Cost accounting, sometimes with associated internal transfers (chargebacks) as a primary tool for understanding and controlling IT expenses
Both of these practices are being challenged by Agile and Lean IT thinking.
IT organizations typically adhere to annual budgeting and planning cycles, which can involve painful rebalancing exercises across an entire portfolio of technology initiatives, as well as a sizeable amount of rework and waste. This approach is anathema to companies that are seeking to deploy Agile at scale. Some businesses in our research base are taking a different approach. Overall budgeting is still done yearly, but roadmaps and plans are revisited quarterly or monthly, and projects are reprioritized continually [69].
An Operating Model for Company-Wide Agile Development
In the common practice of the annual budget cycle, companies once a year embark on a detailed planning effort to forecast revenues and how they will be spent. Much emphasis is placed on the accuracy of such forecasts, despite its near-impossibility. (If estimating one large software project is challenging, how much more challenging to estimate an entire enterprise’s income and expenditures?)
The annual budget has two primary components: capital expenditures and operating expenditures, commonly called CAPEX and OPEX. The rules about what must go where are fairly rigid and determined by accounting standards with some leeway for the organization’s preferences.
Software development can be capitalized, as it is an investment from which the company hopes to benefit from in the future. Operations is typically expensed. Capitalized activities may be accounted for over multiple years (therefore becoming a reasonable candidate for financing and multi-year amortization). Expensed activities must be accounted for in-year.
One can only “go to the well” once a year. As such, extensive planning and negotiation traditionally take place around the IT project portfolio. Business units and their IT partners debate the priorities for the capital budget, assess resources, and finalize a list of investments. Project managers are identified and tasked with marshaling the needed resources for execution.
This annual cycle receives much criticism in the Agile and Lean communities. From a Lean perspective, projects can be equated to large “batches” of work. Using annual projects as a basis for investment can result in misguided attempts to plan large batches of complex work in great detail so that resource requirements can be known well in advance. The history of the Agile movement is in many ways a challenge and correction of this thinking, as we have discussed throughout this document.
The execution model for digital/IT acquisition adds further complexity. Traditionally, project management has been the major funding vehicle for capital investments, distinct from the operational expense. But with the rise of cloud computing and product-centric management, companies are moving away from traditional capital projects. New products are created with greater agility, in response to market need, and without the large capital investments of the past in physical hardware.
This does not mean that traditional accounting distinctions between CAPEX and OPEX go away. Even with expensed cloud infrastructure services, software development may still be capitalized, as may software licenses.
|
Note
|
The term “cost accounting” is not the same as just “accounting for costs”, which is always a concern for any organization. Cost accounting is defined as “the techniques for determining the costs of products, processes, projects, etc. in order to report the correct amounts on the financial statements, and assisting management in making decisions and in the planning and control of an organization … For example, cost accounting is used to compute the unit cost of a manufacturer’s products in order to report the cost of inventory on its balance sheet and the cost of goods sold on its income statement. This is achieved with techniques such as the allocation of manufacturing overhead costs and through the use of process costing, operations costing, and job-order costing systems." [6] |
IT is often consumed as a "shared service” which requires internal financial transfers. What does this mean?
Here is a traditional example. An IT group purchases a mainframe computer for $1,000,000. This mainframe is made available to various departments who are charged for it. Because the mainframe is a shared resource, it can run multiple workloads simultaneously. For the year, we see the following usage:
-
30% Accounting
-
40% Sales Operations
-
30% Supply Chain
In the simplest direct allocation model, the departments would pay for the portion of the mainframe that they used. But things always are more complex than that.
-
What if the mainframe has excess capacity? Who pays for that?
-
What if Sales Operations stops using the mainframe? Do Accounting and Supply Chain have to make up the loss? What if Accounting decides to stop using it because of the price increase?
-
In public utilities, this is known as a "death spiral" and the problem was noted as early as 1974 by Richard Nolan [210 p. 179].
-
-
The mainframe requires power, floor space, and cooling - how are these incorporated into the departmental charges?
-
Ultimately, the Accounting organization (and perhaps Supply Chain) are back-office cost centers as well
-
Does it make sense for them to be allocated revenues from company income, only to have those revenues then re-directed to the IT department?
-
Historically, cost accounting has been the basis for much IT financial management (see, for example, ITIL Service Strategy, [283], p.202; [225]). Such approaches traditionally seek full absorption of unit costs; that is, each “unit” of inventory ideally represents the total cost of all its inputs: materials, labor, and overhead such as machinery and buildings.
In IT/digital service organizations, there are three basic sources of cost: “cells, atoms, and bits”. That is:
-
People (i.e., their time)
-
Hardware
-
Software
However, these are “direct” costs — costs that, for example, a product or project manager can see in their full amount.
Another class of cost is “indirect”. The IT service might be charged $300 per square foot for data center space. This provides access to rack space, power, cooling, security, and so forth. This charge represents the bills the Facilities organization receives from power companies, mechanicals vendors, security services, and so forth — not to mention the mortgage!
Finally, the service may depend on other services. Perhaps instead of a dedicated database server, the service subscribes to a database service that gives them a high-performance relational database, but where they do not pay directly for the hardware, software, and support services on which the database is based. Just to make things more complicated, the services might be external (public cloud) or internal (private cloud or other offerings).
Those are the major classes of cost. But how do we understand the “unit of inventory” in an IT services context? A variety of concepts can be used, depending on the service in question:
-
Transactions
-
Users
-
Network ports
-
Storage (e.g., gigabytes of disk)
In internal IT organizations (see "Defining consumer, customer, and sponsor") this cost accounting is then used to transfer funds from the budgets of consuming organizations to the IT budget. Sometimes this is done via simple allocations (marketing pays 30%, Sales pays 25%, etc.) and sometimes this is done through more sophisticated approaches, such as defining unit costs for services.
For example, the fully absorbed unit cost for a customer account transaction might be determined to be $0.25; this ideally represents the total cost of the hardware, software, and staff divided by the expected transactions. Establishing the models for such costs, and then tracking them, can be a complex undertaking, requiring correspondingly complex systems.
IT managers have known for years that overly detailed cost accounting approaches can result in consuming large fractions of IT resources. As AT&T financial manager John McAdam noted:
“Utilizing an excessive amount of resources to capture data takes away resources that could be used more productively to meet other customer needs. Internal processing for IT is typically 30-40% of the workload. Excessive data capturing only adds to this overhead cost.” [191]
There is also the problem that unit costing of this nature creates false expectations. Establishing an internal service pricing scheme implies that if the utilization of the service declines, so should the related billings. But if:
-
The hardware, software, and staff costs are already sunk, or relatively inflexible
-
The IT organization is seeking to recover costs fully
the per-transaction cost will simply have to increase if the number of transactions goes down. James R. Huntzinger discusses the problem of excess capacity distorting unit costs, and states “it is an absolutely necessary element of accurate representation of the facts of production that some provisions be made for keeping the cost of wasted time and resources separate from normal costs” [139]. Approaches for doing this will be discussed below.
6.3.2.1.2. Next-Generation IT Finance
What accounting should do is produce an unadulterated mirror of the business — an uncompromisable truth on which everyone can rely … Only an informed team, after all, is truly capable of making intelligent decisions.
as quoted by James Huntzinger
Criticisms of traditional approaches to IT finance have increased as Digital Transformation accelerates and companies turn to Agile operating models. Rami Sirkia and Maarit Laanti (in a paper used as the basis for the SAFe's financial module) describe the following shortcomings:
-
Long planning horizons, detailed cost estimates that must frequently be updated
-
Emphasis on planning accuracy and variance analysis
-
Context-free concern over budget overruns (even if a product is succeeding in the market, variances are viewed unfavorably)
-
Bureaucratic re-approval processes for project changes
-
Inflexible and slow resource re-allocation [261]
What do critics of cost accounting, allocated chargebacks, and large batch project funding suggest as alternatives to the historical approaches? There are some limitations evident in many discussions of Lean Accounting, notably an emphasis on manufactured goods. However, a variety of themes and approaches have emerged relevant to IT services, that we will discuss below:
-
Beyond Budgeting
-
Internal “venture” funding
-
Value stream orientation
-
Lean Accounting
-
Lean Product Development
-
Internal market economics
-
Service brokerage
Setting a numerical target and controlling performance against it is the foundation stone of the budget contract in today’s organization. But, as a concept, it is fundamentally flawed. It is like telling a motor racing driver to achieve an exact time for each lap … it cannot predict and control extraneous factors, any one of which could render the target totally meaningless. Nor does it help to build the capability to respond quickly to new situations. But, above all, it doesn’t teach people how to win.
Beyond Budgeting Questions and Answers
Beyond Budgeting is the name of a 2003 book by Jeremy Hope and Robin Fraser. It is written in part as an outcome of meetings and discussions between a number of large, mostly European firms dissatisfied with traditional budgeting approaches. Beyond Budgeting’s goals are described as:
releasing capable people from the chains of the top-down performance contract and enabling them to use the knowledge resources of the organization to satisfy customers profitably and consistently beat the competition
In particular, Beyond Budgeting critiques the concept of the “budget contract”. A simple “budget” is merely a “financial view of the future … [a] 'most likely outcome' given known information at the time …”. A “budget contract” by comparison is intended to “delegate the accountability for achieving agreed outcomes to divisional, functional, and departmental managers”. It includes concerns and mechanisms such as:
-
Targets
-
Rewards
-
Plans
-
Resources
-
Coordination
-
Reporting
and is intended to “commit a subordinate or team to achieving an agreed outcome.
Beyond Budgeting identifies various fallacies with this approach, including:
-
The idea that fixed financial targets maximize profit potential
-
Financial incentives build motivation and commitment (see discussion on motivation)
-
Annual plans direct actions that maximize market opportunities
-
Central resource allocation optimizes efficiency
-
Central coordination brings coherence
-
Financial reports provide relevant information for strategic decision-making
Beyond the poor outcomes that these assumptions generate, up to 20% to 30% of senior executives' time is spent on the annual budget contract. Overall, the Beyond Budgeting view is that the budget contract is:
a relic from an earlier age. It is expensive, absorbs far too much time, adds little value, and should be replaced by a more appropriate performance management model [131 p. 4], emphasis added.
Readers of this textbook should at this point notice that many of the Beyond Budgeting concerns reflect an Agile/Lean perspective. The fallacies of efficiency and central coordination have been discussed throughout this document. However, if an organization’s financial authorities remain committed to these as operating principles, the Digital Transformation will be difficult at best.
Beyond Budgeting proposes a number of principles for understanding and enabling organizational financial performance. These include:
-
Event-driven over annual planning
-
On-demand resources over centrally allocated resources
-
Relative targets (“beating the competition”) over fixed annual targets
-
Team-based rewards over individual rewards
-
Multi-faceted, multi-level, forward-looking analysis over analyzing historical variances
A handful of companies are even exploring a venture-capital-style budgeting model. Initial funding is provided for MVPs, which can be released quickly, refined according to customer feedback, and relaunched in the marketplace … And subsequent funding is based on how those MVPs perform in the market. Under this model, companies can reduce the risk that a project will fail, since MVPs are continually monitored and development tasks reprioritized … [69].
An Operating Model for Company-Wide Agile Development
As we have discussed previously, product and project management are distinct. Product management, in particular, has more concern for overall business outcomes. If we take this to a logical conclusion, the product portfolio becomes a form of the investment portfolio, managed not in terms of schedule and resources, but rather in terms of business results.
This implies the need for some form of internal venture funding model, to cover the initial investment in an MVP. If and when this internal investment bears fruit, it may become the basis for a value stream organization, which can then serve as a vehicle for direct costs and an internal services market (see below). McKinsey reports the following case:
With a rolling backlog and stable funding that decouples annual allocation from ongoing execution, the venture-funded product paradigm is likely to continue growing. A product management mindset activates a variety of useful practices, as we will discuss in the next section.
In governing for effectiveness and innovation, one technique is that of options. Related to the idea of options is parallel development. In investing terms, purchasing an option gives the right, but not the obligation, to purchase a stock (or other value) for a given price at a given time. Options are an important tool for investors to develop strategies to compensate for market uncertainty.
What does this have to do with developing digital products?
Product development is so uncertain that sometimes it makes sense to try several approaches at once. This, in fact, was how the program to develop the first atomic bomb was successfully managed. Parallel development is analogous to an options strategy. Small, sustained investments in different development “options” can optimize development payoff in certain situations (see [230], Section 6.2.1, “Product Management”). When taken to a logical conclusion, such an options strategy starts to resemble the portfolio management approaches of venture capitalists. Venture capitalists invest in a broad variety of opportunities, knowing that most, in fact, will not pan out. See discussion of internal venture funding as a business model.
It is arguable that the venture-funded model has created different attitudes and expectations towards governance in West Coast “unicorn” culture. However, it would be dangerous to assume that this model is universally applicable. A firm is more than a collection of independent sub-organizations; this is an important line of thought in management theory, starting with Coase’s “The Nature of the Firm” [63].
The idea that “Real Options” were a basis for Agile practices was proposed by Chris Matts [190]. Investment banker turned Agile coach Franz Ivancsich strongly cautions against taking options theory too far, noting that to price them correctly you have to determine the complete range of potential values for the underlying asset [159].
Because we never show it on our balance sheet, we do not think of [design-in-process] as an asset to be managed, and we do not manage it.
Managing the Design Factory
The Lean Product Development thought of Don Reinertsen was discussed extensively in Section 6.2.2, “Work Management”. His emphasis on employing an economic framework for decision-making is relevant to this discussion as well. In particular, his concept of cost of delay is poorly addressed in much IT financial planning, with its concerns for full utilization, efficiency, and variance analysis. Other Lean Accounting thinkers share this concern; for example:
the cost-management system in a Lean environment must be more reflective of the physical operation. It must not be confined to monetary measures but must also include non-financial measures, such as quality and throughput times._+[<<Huntzinger2007,139>>]+
Another useful Reinertsen concept is that of design-in-process. This is an explicit analog to the well-known Lean concept of work-in-process. Reinertsen makes the following points [229 p. 13]:
-
Design-in-progress is larger and more expensive to hold than work-in-progress
-
It has much lower turn rates
-
It has much higher holding costs (e.g., due to obsolescence)
-
The liabilities of design-in-progress are ignored due to weaknesses in accounting standards
These concerns give powerful economic incentives for managing throughput and flow, continuously re-prioritizing for the maximum economic benefit and driving towards the Lean ideal of single-piece flow.
It was not enough to chase out the cost accountants from the plants; the problem was to chase cost accounting from my people’s minds.
There are several often-cited motivations for cost accounting [139 p. 13]:
-
Inventory valuation (not applicable for intangible services)
-
Informing pricing strategy
-
Management of production costs
IT service costing has long presented additional challenges to traditional cost accounting. As IT Financial Management Association president Terry Quinlan notes, “Many factors have contributed to the difficulty of planning Electronic Data Processing (EDP) expenditures at both application and overall levels. A major factor is the difficulty of measuring fixed and variable cost.” [225 p. 6]
This begs the broader question: should traditional cost accounting be the primary accounting technique used at all? Cost accounting in Lean and Agile organizations is often controversial. Lean pioneer Taiichi Ohno of Toyota thought it was a flawed approach. Huntzinger [139] identifies a variety of issues:
-
Complexity
-
Un-maintainability
-
Supplies information “too late” (i.e., does not support fast feedback)
-
“Overhead” allocations result in distortions
Shingo Prize winner Steve Bell observes:
The trend in Lean Accounting has been to simplify. A guiding ideal is seen in the Wikipedia article on Lean Accounting:
The “ideal” for a manufacturing company is to have only two types of transactions within the production processes; the receipt of raw materials and the shipment of finished product.
Concepts such as value stream orientation, internal market economics, and service brokering all can contribute towards achieving this ideal.
Collecting costs into traditional financial accounting categories, like labor, material, overhead, selling, distribution, and administrative, will conceal the underlying cost structure of products … The alternative to traditional methods … is the creation of an environment that moves indirect costs and allocation into direct costs. [139]
Lean Cost Management
As discussed above, Lean thinking discourages the use of any concept of overhead, sometimes disparaged as “peanut butter” costing. Rather, direct assignment of all costs to the maximum degree is encouraged, in the interest of accounting simplicity.
We discussed a venture-funded product model above, as an alternative to project-centric approaches. Once a product has proven its viability and becomes an operational concern, it becomes the primary vehicle for those concerns previously handled through cost accounting and chargeback. The term for a product that has reached this stage is “value stream”. As Huntzinger notes, “Lean principles demand that companies align their operations around products and not processes” [139 p. 19].
By combining a value stream orientation in conjunction with organizational principles such as frugality, internal market economics, and decentralized decision-making (see, for example, [131 p. 12]), both Lean and Beyond Budgeting argue that more customer-satisfying and profitable results will ensue. The fact that the product, in this case, is digital (not manufactured), and the value stream centers around product development (not production) does not change the argument.
value stream and product line managers, like so much in the Lean world, are “fractal”.
Lean Thinking
Coordinate cross-company interactions through “market-like” forces.
Beyond Budgeting Questions and Answers
IT has long been viewed as a “business within a business”. In the internal market model, services consume other services ad infinitum [195]. Sometimes the relationship is hierarchical (an application team consuming infrastructure services) and sometimes it is peer-to-peer (an application team consuming another’s services, or a network support team consuming email services, which in turn require network services).
The increasing sourcing options including various cloud options make it more and more important that internal digital services be comparable to external markets. This, in turn, puts constraints on traditional IT cost recovery approaches, which often result in charges with no seeming relationship to reasonable market prices.
There are several reasons for this. One commonly cited reason is that internal IT costs include support services, and therefore cannot fairly be compared to simple retail prices (e.g., for a computer as a good).
Another, more insidious reason is the rolling in of unrelated IT overhead to product prices. We have quoted James Huntzinger’s work above in various places on this topic. Dean Meyer has elaborated this topic in greater depth from an IT financial management perspective, calling for some organizational “goods” to be funded as either ventures (similar to above discussion) or “subsidies” (for enterprise-wide benefits such as technical standardization) [195 p. 92].
As discussed above, a particularly challenging form of IT overhead is excess capacity. The saying “the first person on the bus has to buy the bus” is often used in IT shared services, but is problematic. A new, venture-funded startup cannot operate this way — expecting the first few customers to fund the investment fully! Nor can this work in an internal market, unless heavy-handed political pressure is brought to bear. This is where internal venture funding is required.
Meyer presents a sophisticated framework for understanding and managing an internal market of digital services. This is not a simple undertaking; for example, correctly setting service prices can be surprisingly complex.
Finally, there is the idea that digital or IT services should be aggregated and “brokered” by some party (perhaps the descendant of a traditional IT organization). In particular, this helps with capacity management, which can be a troublesome source of internal pricing distortions. This has been seen not only in IT services, but in Lean attention to manufacturing; when unused capacity is figured into product cost accounting, distortions occur [139], Chapter 7, “Church and Excess Capacity”.
Applying Meyer’s principles, excess capacity would be identified as a subsidy or a venture as a distinct line item.
But cloud services can assist even further. Excess capacity often results from the available quantities in the market; e.g., one purchases hardware in large-grained capital units. But more flexibly priced, expensed compute on-demand services are available, it is feasible to allocate and de-allocate capacity on-demand, eliminating the need for accounting for excess capacity.
Evidence of Notability
Financial management in IT and digital systems has a long history of focused discussion; e.g., [225] and the work of the IT Financial Management Association and the TBM Council.
Limitations
IT financial management is a focused subset of financial management in general.
Related Topics
6.3.2.2. Digital Sourcing and Contracts
Description
Digital sourcing is the set of concerns related to identifying suppliers (sources) of the necessary inputs to deliver digital value. Contract management is a critical, subsidiary concern, where digital value intersects with law.
The basic classes of inputs include:
-
People (with certain skills and knowledge)
-
Hardware
-
Software
-
Services (which themselves are composed of people, hardware, and/or software)
Practically speaking, these inputs are handled by two different functions:
-
People (in particular, full-time employees) are handled by a human resources function
-
Hardware, software, and services are handled by a procurement function
-
Other terms associated with this are Vendor Management, Contract Management, and Supplier Management; we will not attempt to clarify or rationalize these areas in this section.
-
We discussed hiring and managing digital specialists in the the Competency Category of IT Human Resources Management.
6.3.2.2.1. Basic Concerns
A small company may establish binding agreements with vendors relatively casually. For example, when the founder first chose a cloud platform on which to build their product, they clicked on a button that said “I accept”, at the bottom of a lengthy legal document they didn’t necessarily read closely. This “clickwrap” agreement is a legally binding contract, which means that the terms and conditions it specifies are enforceable by the courts.
A startup may be inattentive to the full implications of its contracts for various reasons:
-
The founder does not understand the importance and consequences of legally binding agreements
-
The founder understands but feels they have little to lose (for example, they have incorporated as a limited liability company, meaning the founder’s personal assets are not at risk)
-
The service is perceived to be so broadly used that an agreement with it must be safe (if 50 other startups are using a well-known cloud provider and prospering, why would a startup founder spend precious time and money on overly detailed scrutiny of its agreements?)
All of these assumptions bear some risk — and many startups have been burned on such matters — but there are many other, perhaps more pressing risks for the founder and startup.
However, by the time the company has scaled to the team of teams level, contract management is almost certainly a concern of the Chief Financial Officer. The company has more resources (“deeper pockets”), and so lawsuits start to become a concern. The complexity of the company’s services may require more specialized terms and conditions. Standard “boilerplate” contracts thus are replaced by individualized agreements. Concerns over intellectual property, the ability to terminate agreements, liability for damages, and other topics require increased negotiation and counterproposing contractual language. See the case study on the 9 figure true-up for a grim scenario.
At this point, the company may have hired its own legal professional; certainly, legal fees are going up, whether as services from external law firms or internal staff.
Contract and vendor management is more than just establishing the initial agreement. The ongoing relationship must be monitored for its consistency with the contract. If the vendor agrees that its service will be available 99.999% of the time, the availability of that service should be measured, and if it falls below that threshhold, contractual penalties may need to be applied.
In larger organizations, where a vendor might hold multiple contracts, a concept of "vendor management” emerges. Vendors may be provided with “scorecards” that aggregate metrics which describe their performance and the overall impression of the customer. Perhaps key stakeholders are internally surveyed as to their impression of the vendor’s performance and whether they would be likely to recommend them again. Low scores may penalize a vendor’s chances in future Request for Information (RFI)/RFP processes; high scores may enhance them. Finally, advising on sourcing is one of the main services an Enterprise Architecture group may provide.
6.3.2.2.2. Outsourcing and Cloud Sourcing
The first significant vendor relationship the startup may engage with is for cloud services. The decision whether, and how much, to leverage cloud computing remains a topic of much industry discussion. The following pros and cons are typically considered [202]:
| Pro | Con |
|---|---|
Operational costs Public cloud workforce availability (as opposed to private cloud skills) Better capital management (i.e., through expensed cloud services) Ease in providing elastic scalability Agility (faster provisioning of commercial cloud instances) Reduce capex (faciilities, hardware, software) Promoting innovation (e.g., web-scale applications may require current cloud infrastructure) Public clouds are rich and mature, with extensive platform capabilities Flexible capacity management/resource utilization |
Data Gravity (scale of data too voluminous to easily migrate the apps and data to the cloud) Security (perception cloud is not as secure) Private clouds are improving Lack of equivalent SaaS offerings for applications being run in-house Significant integration requirements between in-house apps and new ones deployed to cloud Lack of ability to support migration to cloud Vendor licensing (see 9 figure true-up) Network latency (slow response of cloud-deployed apps) Poor transparency of cloud infrastructure Risk of cloud platform lock-in |
Cloud can reduce costs when deployed in a sophisticated way; if a company has purchased more capacity than it needs, cloud can be more economical (review the section on virtualization economics). However, ultimately, as Abbott and Fisher point out:
Large, rapidly growing companies can usually realize greater margins by using wholly owned equipment than they can by operating in the cloud. This difference arises because IaaS operators, while being able to purchase and manage their equipment cost-effectively, are still looking to make a profit on their services [4 p. 474].
Minimally, cloud services need to be controlled for consumption. Cloud providers will happily allow virtual machines to run indefinitely, and charge for them. An ecosystem of cloud brokers and value-add resellers is emerging to assist organizations with optimizing their cloud dollars.
6.3.2.2.3. Software Licensing
As software and digital services are increasingly used by firms large and small, the contractual rights of usage become more and more critical. We mentioned a "clickwrap” licensing agreement above. Software licensing, in general, is a large and detailed topic, one presenting a substantial financial risk to the unwary firm, especially when cloud and virtualization are concerned.
Software licensing is a subset of software asset management, which is itself a subset of IT asset management, discussed in more depth in the material on process management and IT lifecycles. Software asset management in many cases relies on the integrity of a digital organization’s package management; the package manager should represent a definitive inventory of all the software in use in the organization.
Free and open-source software (sometimes abbreviated FOSS) has become an increasingly prevalent and critical component of digital products. While technically “free”, the licensing of such software can present risks. In some cases, open-source products have unclear licensing that puts them at risk of legal conflicts which may impact users of the technology [182]. In other cases, the open-source license may discourage commercial or proprietary use; for example, the GNU General Public License (GPL) requirement for disclosing derivative works causes concern among enterprises [310].
6.3.2.2.4. The Role of Industry Analysts
When a company is faced by a sourcing question of any kind, one initial reaction is to research the market alternatives. But research is time-consuming, and markets are large and complex. Therefore, the role of industry or market analyst has developed.
In the financial media, we often hear from “industry analysts” who are concerned with whether a company is a good investment in the stock market. While there is some overlap, the industry analysts we are concerned with here are more focused on advising prospective customers of a given market’s offerings.
Because sourcing and contracting are an infrequent activity, especially for smaller companies, it is valuable to have such services. Because they are researching a market and talking to vendors and customers on a regular basis, analysts can be helpful to companies in the purchasing process.
However, analysts take money from the vendors they are covering as well, leading to occasional charges of conflict of interest. How does this work? There are a couple of ways.
First, the analyst firm engages in objective research of a given market segment. They do this by developing a common set of criteria for who gets included, and a detailed set of questions to assess their capabilities.
For example, an analyst firm might define a market segment of “Cloud IaaS” vendors. Only vendors supporting the basic NIST guidelines for IaaS are invited. Then, the analyst might ask: “Do you support SDNs; e.g., Network Function Virtualization?” as a question. Companies that answer “yes” will be given a higher score than companies that answer “no”. The number of questions on a major research report might be as high as 300 or even higher.
Once the report is completed, and the vendors are ranked (analyst firms typically use a two-dimensional ranking, such as the Gartner Magic Quadrant or Forrester Wave), it is made available to end users for a fee. Fees for such research might range from $500 to $5,000 or more, depending on how specialized the topic, how difficult the research, and the ability of prospective customers to pay.
|
Note
|
Large companies - e.g., those in the Fortune 500 - typically would purchase an “enterprise agreement", often defined as a named “seat” for an individual, who can then access entire categories of research. |
Customers may have further questions for the analyst who wrote the research. They may be entitled to some portion of analyst time as part of their license, or they may pay extra for this privilege.
Beyond selling the research to potential customers of a market, the analyst firm has a complex relationship with the vendors they are covering. In our example of a major market research report, the analyst firm’s sales team also reaches out to the vendors who were covered. The conversation goes something like this:
“Greetings. You did very well in our recent research report. Would you like to be able to give it away to prospective customers, with your success highlighted? If so, you can sponsor the report for $50,000.”
Because the analyst report is seen as having some independence, it can be an attractive marketing tool for the vendor, who will often pay (after some negotiating) for the sponsorship. In fact, vendors have so many opportunities along these lines they often find it necessary to establish a function known as “Analyst Relations” to manage all of them.
6.3.2.2.5. Software Development and Contracts
Software is often developed and delivered per contractual terms. Contracts are legally binding agreements, typically developed with the assistance of lawyers. As noted in [21 p. 5]: “Legal professionals are trained to act, under legal duty, to advance their client’s interests and protect them against all pitfalls, seen or unseen.” The idea of “customer collaboration over contract negotiation” may strike them as the height of naïveté.
However, Agile and Lean influences have made substantial inroads in contracting approaches.
Arbogast et al. describe the general areas of contract concern:
-
Risk, exposure, and liability
-
Flexibility
-
Clarity of obligations, expectations, and deliverables
They argue that: “An Agile project contract may articulate the same limitations of liability (and related terms) as a traditional project contract, but the Agile contract will better support avoiding the very problems that a lawyer is worried about.” (p.12)
So, what is an "Agile" contract?
There are two major classes of contracts:
-
Time and materials
-
Fixed-price
In a time and materials contract, the contracting firm simply pays the provider until the work is done. This means that the risk of the project overrunning its schedule or budget resides primarily with the firm hiring out the work. While this can work, there is often a desire on the part of the firm to reduce this risk. If you are hiring someone because they claim they are experts and can do the work better, cheaper, and/or quicker than your own staff, it seems reasonable that they should be willing to shoulder some of the risks.
In a fixed-price contract, the vendor providing the service will make a binding commitment that (for example): “we will get the software completely written in nine months for $3 million”. Penalties may be enforced if the software is late, and it is up to the vendor to control development costs. If the vendor does not understand the work correctly, they may lose money on the deal.
Reconciling Agile with fixed-price contracting approaches has been a challenging topic [214]. The desire for control over a contractual relationship is historically one of the major drivers of waterfall approaches. However, since requirements cannot be fully known in advance, this is problematic.
When a contract is signed based on waterfall assumptions, the project management process of change control is typically used to govern any alterations to the scope of the effort. Each change order typically implies some increase in cost to the customer. Because of this, the perceived risk mitigation of a fixed-price contract may become a false premise.
This problem has been understood for some time. Scott Ambler argued in 2005 that: “It’s time to abandon the idea that fixed bids reduce risk. Clients have far more control over a project with a variable, gated approach to funding in which working software is delivered on a regular basis” [16]. Andreas Opelt states: “For Agile IT projects it is, therefore, necessary to find an agreement that supports the balance between a fixed budget (maximum price range) and Agile development (scope not yet defined in detail).”
How is this done? Opelt and his co-authors further argue that the essential question revolves around the project “Iron Triangle":
-
Scope
-
Cost
-
Deadline
The approach they recommend is determining which of these elements is the “fixed point” and which is estimated. In traditional waterfall projects, the scope is fixed, while costs and deadline must be estimated (a problematic approach when product development is required).
In Opelt’s view, in Agile contracting, costs and deadlines are fixed, while the scope is “estimated” — understood to have some inevitable variability. "… you are never exactly aware of what details will be needed at the start of a project. On the other hand, you do not always need everything that had originally been considered to be important” [214].
Their recommended approach supports the following benefits:
-
Simplified adaptation to change
-
Non-punitive changes in scope
-
Reduced knowledge decay (large “batches” of requirements degrade in value over time)
This is achieved through:
-
Defining the contract at the level of product or project vision (epics or high-level stories; see discussion of Scrum) — not detailed specification
-
Developing high-level estimation
-
Establishing agreement for sharing the risk of product development variability
This last point, which Opelt et al. term “riskshare”, is key. If the schedule or cost expand beyond the initial estimate, both the supplier and the customer pay, according to some agreed %, which they recommend be between 30%-70%. If the supplier proportion is too low, the contract essentially becomes time and materials. If the customer proportion is too low, the contract starts to resemble traditional fixed-price.
Incremental checkpoints are also essential; for example, the supplier/customer interactions should be high bandwidth for the first few sprints, while culture and expectations are being established and the project is developing a rhythm.
Finally, the ability for either party to exit gracefully and with a minimum penalty is needed. If the initiative is testing market response (aka Lean Startup) and the product hypothesis is falsified, there is little point in continuing the work from the customer’s point of view. And, if the product vision turns out to be far more work than either party estimated, the supplier should be able to walk away (or at least insist on comprehensive re-negotiation).
These ideas are a departure from traditional contract management. As Opelt asks: “How can you sign a contract from which one party can exit at any time?”. Recall, however, that (if Agile principles are applied) the customer is receiving working software continuously through the engagement (e.g., after every sprint).
In conclusion, as Arbogast et al. argue: “Contracts that promote or mandate sequential lifecycle development increase project risk - an Agile approach … reduces risk because it limits both the scope of the deliverable and extent of the payment [and] allows for inevitable change” [21 p. 13].
Evidence of Notability
Sourcing, and outsourcing, have long been key topics in digital and IT management. The option to allocate some level of responsibility to external parties in exchange for compensation has been an aspect of digital management since the first computers became available.
Limitations
The decision to outsource some or all of an IT organization to a third party is often cast in terms of "it’s not our core competency". However, Digital Transformation is resulting in some companies changing their minds and bringing digital systems development and operation back in-house, as a key business competency.
Related Topics
6.3.2.3. Portfolio Management
Description
Now that we understand the coordination problem better, and have discussed finance and sourcing, we are prepared to make longer-term commitments to a more complicated organizational structure. As we stated in the Competency Area introduction, one way of looking at these longer-term commitments is as investments. We start them, we decide to continue them, or we decide to halt (exit) them. In fact, we could use the term “portfolio” to describe these various investments; this is not a new concept in IT management.
|
Note
|
The first comparison of IT investments to a portfolio was in 1974, by Richard Nolan in Managing the Data Resource Function [210]. |
Whatever the context for your digital products (external or internal), they are intended to provide value to your organization and ultimately your end customer. Each of them in a sense is a “bet” on how to realize this value (review the Spotify DIBB model), and represents in some sense a form of product discovery. As you deepen your abilities to understand investments, you may find yourself applying business case analysis techniques in more rigorous ways, but as always retaining a Lean Startup experimental mindset is advisable.
As you strengthen a hypothesis in a given product or feature structure, you increasingly formalize it: a clear product vision supported by dedicated resources. We will discuss the IT portfolio concept further in Section 6.4.3.5, “Architecture, Digital Strategy, and Portfolio”. In your earliest stages of differentiating your portfolio, you may first think about features versus components.
6.3.2.3.1. Features versus Components
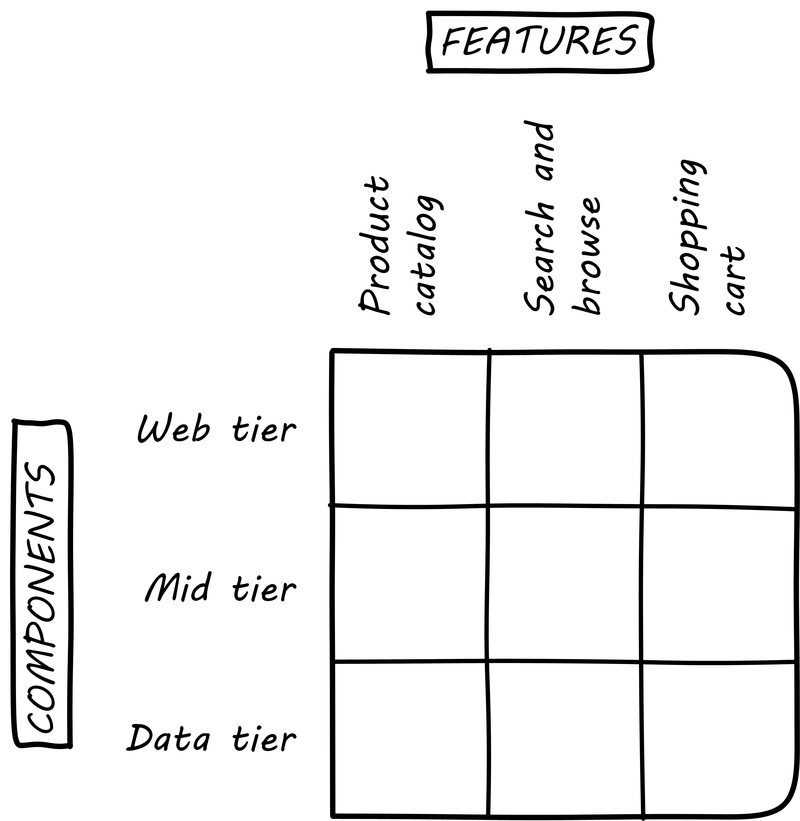
As you consider your options for partitioning your product, in terms of the AKF scaling cube, a useful and widely adopted distinction is that between “features” and “components” (see Figure 92, “Features versus Components”).
Features are what your product does. They are what the customers perceive as valuable. “Scope as viewed by the customer” according to Mark Kennaley [164] p.169. They may be "flowers" — defined by the value they provide externally, and encouraged to evolve with some freedom. You may be investing in new features using Lean Startup, the Spotify DIBB model, or some other hypothesis-driven approach.
Components are how your product is built, such as database and web components. In other words, they are a form of infrastructure (but infrastructure you may need to build yourself, rather than just spin up in the cloud). They are more likely to be “cogs” — more constrained and engineered to specifications. Mike Cohn defines a component team as “a team that develops software to be delivered to another team on the project rather than directly to users” [68 p. 183].
Feature teams are dedicated to a clearly defined functional scope (such as “item search” or “customer account lookup”), while component teams are defined by their technology platform (such as “database” or “rich client”). Component teams may become shared services, which need to be carefully understood and managed (more on this to come). A component’s failure may affect multiple feature teams, which makes them riskier.
It may be easy to say that features are more important than components, but this can be carried too far. Do you want each feature team choosing its own database product? This might not be the best idea; you will have to hire specialists for each database product chosen. Allowing feature teams to define their own technical direction can result in brittle, fragmented architectures, technical debt, and rework. Software product management needs to be a careful balance between these two perspectives. SAFe suggests that components are relatively:
-
More technically focused
-
More generally re-usable
than features. SAFE also recommends a ratio of roughly 20-25% component teams to 75%-80% feature teams [246].
Mike Cohn suggests the following advantages for feature teams [68 pp. 183-184]:
-
They are better able to evaluate the impact of design decisions
-
They reduce hand-off waste (a coordination problem)
-
They present less schedule risk
-
They maintain focus on delivering outcomes
He also suggests [68 pp. 186-187] that component teams are justified when:
-
Their work will be used by multiple teams
-
They reduce the sharing of specialists across teams
-
The risk of multiple approaches outweighs the disadvantages of a component team
Ultimately, the distinction between “feature versus component” is similar to the distinction between “application” and “infrastructure". Features deliver outcomes to people whose primary interests are not defined by digital or IT. Components deliver outcomes to people whose primary interests are defined by digital or IT.
6.3.2.3.2. Epics and New Products
In the coordination Competency Category, we talked of one product with multiple feature and/or component teams (see Figure 93, “One Company, One Product”). Features and components as we are discussing them here are large enough to require separate teams (with new coordination requirements). At an even larger scale, we have new product ideas, perhaps first seen as epics in a product backlog.
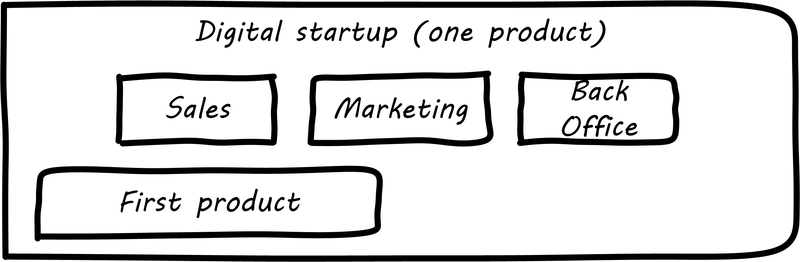
Eventually, larger and more ambitious initiatives lead to a key organizational state transition: from one product to multiple products. Consider our hypothetical startup company. At first, everyone on the team is supporting one product and dedicated to its success. There is little sense of contention with “others” in the organization. This changes with the addition of a second product team with different incentives (see Figure 94, “One Company, Multiple Products”). Concerns for fair allocation and a sense of internal competition naturally arise out of this diversification. Fairness is deeply wired into human (and animal) brains, and the creation of a new product with an associated team provokes new dynamics in the growing company.
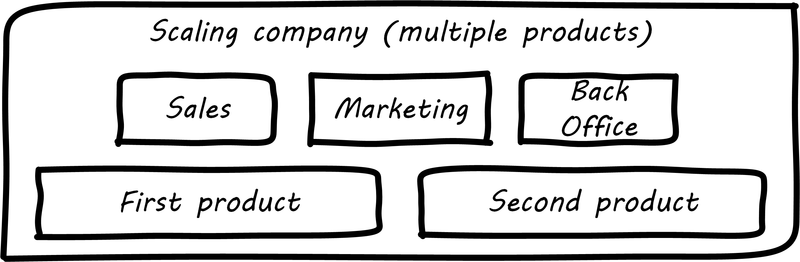
Because resources are always limited, it is critical that the demands of each product be managed using objective criteria, requiring formalization. This was a different problem when you were a tight-knit startup; you were constrained, but everyone knew they were “in it together". Now you need some ground rules to support your increasingly diverse activities. This leads to new concerns:
-
Managing scope and preventing unintended creep or drift from the product’s original charter
-
Managing contention for enterprise or shared resources
-
Execution to timeframes (e.g., the critical trade show)
-
Coordinating dependencies (e.g., achieving larger, cross-product goals)
-
Maintaining good relationships when a team’s success depends on another team’s commitment
-
Accountability for results
Structurally, we might decide to separate a portfolio backlog from the product backlog. What does this mean?
-
The portfolio backlog is the list of potential new products in which the organization might invest
-
Each product team still has its own backlog of stories (or other representations of their work)
The DEEP backlog we discussed in Section 6.2.2, “Work Management” gets split accordingly (see Figure 95, “Portfolio versus Product Backlog”).
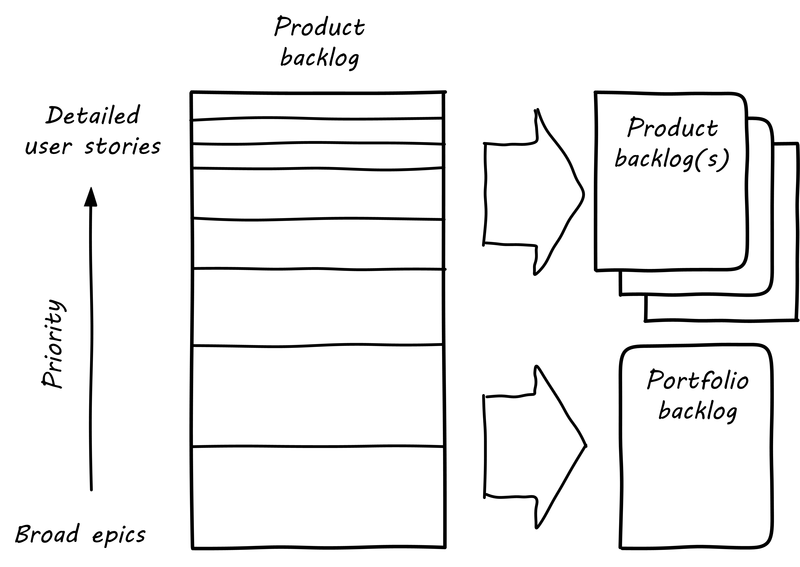
The decision to invest in a new product should not be taken lightly. When the decision is made, the actual process is as we covered in Section 6.2.1, “Product Management”: ideally, a closed-loop, iterative process of discovering a product that is valuable, usable, and feasible.
There is one crucial difference: the investment decision is formal and internal. While we started our company with an understanding of our investment context, we looked primarily to market feedback and grew incrementally from a small scale. (Perhaps there was venture funding involved, but this document doesn’t cover that.)
Now, we may have a set of competing ideas on which we are thinking about placing bets. In order to make a rational decision, we need to understand the costs and benefits of the proposed initiatives. This is difficult to do precisely, but how can we rationally choose otherwise? We have to make some assumptions and estimate the likely benefits and the effort it might take to realize them.
6.3.2.3.3. Larger-Scale Planning and Estimating
Fundamentally, we plan for two reasons:
-
To decide whether to make an investment
-
To ensure the investment’s effort progresses effectively and efficiently
We have discussed investment decision-making in terms of the overall business context, in terms of the product roadmap, the product backlog, and in terms of Lean Product Development and cost of delay. As we think about making larger-scale, multi-team digital investments, all of these practices come together to support our decision-making process. Estimating the likely time and cost of one or more larger-scale digital product investment is not rocket science; doing so is based on the same techniques we have used at the single-team, single-product level.
With increasing scope of work and increasing time horizon tends to come increasing uncertainty. We know that we will use fast feedback and ongoing hypothesis-driven development to control for this uncertainty. But at some point, we either make a decision to invest in a given feature or product and start the hypothesis testing cycle — or we don’t.
Once we have made this decision, there are various techniques we can use to prioritize the work so that the most significant risks and hypotheses are addressed soonest. But in any case, when large blocks of funding are at issue, there will be some expectation of monitoring and communication. In order to monitor, we have to have some kind of baseline expectation to monitor against. Longer-horizon artifacts such as the product roadmap and release plan are usually the basis for monitoring and reporting on product or initiative progress.
In planning and execution, we seek to optimize the following contradictory goals:
-
Delivering maximum value (outcomes)
-
Minimizing the waste of un-utilized resources (people, time, equipment, software)
Obviously, we want outcomes — digital value — but we want it within constraints. It has to be within a timeframe that makes economic sense. If we pay 40 people to do work that a competitor or supplier can do with three, we have not produced a valuable outcome relative to the market. If we take 12 months to do something that someone else can do in five, again, our value is suspect. If we purchase software or hardware we don’t need (or before we need it) and, as a result, our initiative’s total costs go up relative to alternatives, we again may not be creating value. Many of the techniques suggested here are familiar to formal project management. Project management has the deepest tools, and whether or not you use a formal project structure, you will find yourself facing similar thought processes as you scale.
To meet these value goals, we need to:
-
Estimate so that expected benefits can be compared to expected costs, ultimately to inform the investment decision (start, continue, stop)
-
Plan so that we understand dependencies (e.g., when one team must complete a task before another team can start theirs)
Estimation sometimes causes controversy. When a team is asked for a projected delivery date, the temptation for management is to “hold them accountable” for that date and penalize them for not delivering value by then. But product discovery is inherently uncertain, and therefore such penalties can seem arbitrary. Experiments show that when animals are penalized unpredictably, they fall into a condition known as “learned helplessness”, in which they stop trying to avoid the penalties [304].
We discussed various coordination tools and techniques previously. Developing plans for understanding dependencies is one of the best known such techniques. An example of such a planning dependency would be that the database product should be chosen and configured before any schema development takes place (this might be a component team working with a feature team).
6.3.2.3.4. Planning Larger Efforts
… many large projects need to announce and commit to deadlines many months in advance, and many large projects do have inter-team dependencies …
Agile Estimating
Agile and adaptive techniques can be used to plan larger, multi-team programs. Again, we have covered many fundamentals of product vision, estimation, and work management in earlier material. Here, we are interested in the concerns that emerge at a larger scale, which we can generally class into:
-
Accountability
-
Coordination
-
Risk management
With larger blocks of funding comes higher visibility and inquiries as to progress. At a program level, differentiating between estimates and commitments becomes even more essential.
Mike Cohn suggests that larger efforts specifically can benefit from the following coordination techniques [67]:
-
Estimation baseline (velocity)
-
Key details sooner
-
Lookahead planning
-
Feeding buffers
Estimating across multiple teams is difficult without a common scale, and Cohn proposes an approach for determining this in terms of team velocity. He also suggests that, in larger projects, some details will require more advance planning (it is easy to see APIs as being one example), and some team members' time should be devoted to planning for the next release. Finally, where dependencies exist, buffers should be used; that is, if Team A needs something from Team B by May 1, Team B should plan on delivering it by April 15.
Finally, risk and contingency planning is essential. In developing any plan, Abbott and Fisher recommend the “5-95 rule”: 5% of the time on building a good plan, and 95% of the time planning for contingencies [4 p. 105]. We will discuss risk management in detail in Section 6.4.1, “Governance, Risk, Security, and Compliance”.
Evidence of Notability
Portfolio management in the IT and digital context has been a topic since at least 1974 [210].
Limitations
IT portfolios (whether conceived as service, project, application, or product portfolios) are significantly different from classic financial portfolios and the usefulness of the metaphor is periodically questioned.
Related Topics
6.3.2.4. The Digital Product or Service Catalog
Description
A Digital Product or Service Catalog is an organized and curated collection of any and all business and IT-related services that can be performed by, for, or within an enterprise [306].
(Though the above serves as a good general definition of a Service Catalog, this section will explain some complexities around this naming and related concepts.)
When an organization reaches a team of teams level, teams need some way to start exposing their digital products and services to other teams and individuals in the organization.
If your organization is a SaaS provider or some other external digital product or service provider, at this level, you may also have enough differentiation in your digital product or service offerings that your public-facing digital Product or Service Catalog requires more formalized management.
|
Note
|
While industry terminology is still unsettled, some organizations and software vendors are staying with the “Service Catalog” name, while others are now using “Digital Product Catalog” to reflect and promote DPM practices’ growing influence among Digital Practitioners; more on this below. |
“While Service Catalogs are not new, they are becoming increasingly critical to enterprises seeking to optimize IT efficiencies, service delivery, and business outcomes. They are also a way of supporting both business and IT services, as well as optimizing IT for cost and value with critical metrics and insights.”
Digital Product/Service Catalogs can cover various needs and requests, from professional service requests to end-user IT support requests, to user access to internally delivered software and applications, to support for third-party cloud services across the board, to support for business (non-IT) services which are managed through an integrated service desk [88].
Digitally-savvy organizations pursue commoditization and enhanced automation for self-service for many service request types.
The most recent trends reflect an increasing number of organizations using Artificial Intelligence (AI) to automate service requests and using Service Catalogs to manage cloud services.
| Digital Product/Service Examples by Type and Delivery Option | DevOps | Low/No-Code | Externally Sourced (SIAM) |
|---|---|---|---|
High touch |
Requests to change internally developed services |
Access to internal professional services (e.g., SRE/security consultations) |
External professional services |
Commodity |
Rare |
Internal workflows (ESM) - can include provisioning of both internally and externally sourced operational services (e.g., IaaS) |
BPO |
Operational/Application |
DevOps-driven strategic digital services |
More complex low/no code-based development |
SaaS |
Operational/Infrastructure |
Infrastructure platforms; e.g., the DevOps pipeline itself |
N/A |
PaaS, IaaS, and SIAM |
6.3.2.4.1. Service Catalog Management Approaches: APM versus SPM versus DPM
Though Service Catalogs have been around for a long time, the management concepts underpinning them are evolving.
Traditionally, Service Catalogs have been developed in the service of the larger management approaches of Application Portfolio Management (APM) or Service Portfolio Management (SPM), but are increasingly being driven by Digital Product Management (DPM) concepts; below is a short summary of this evolution.
For larger organizations, one approach to keep tabs on every IT product is APM [185]. Commonly associated with Enterprise Architecture practices where the application architecture is needed to manage and make broad-sweeping technology or data changes. These would include efforts such as understanding the impact of choosing a different database vendor, deciding to port internally managed applications into the cloud, or to address regulatory requirements like Sarbanes-Oxley (SOX), Health Insurance Portability and Accountability Act (HIPAA), or Payment Card Industry (PCI) which impact many different applications—even if they don’t have an active team assigned.
The APM practices, however, often lack operational context, often summarizing the detail from CMDBs and support metrics to have a vague idea of how well the applications are performing, but often not with great fidelity.
From an operational context, some organizations use SPM practices to manage the services being consumed, focusing on ticket generation, consumption measurement, and user satisfaction of the IT products after they have been put into operational status. The SPM practices have strong operational management roots, pursuing operational concerns such as reliability, stability, and other support-oriented metrics.
However, SPM doesn’t often address architectural, planning, and compliance needs well. ITIL V3 introduced Service Strategy [211]; however, in reality few organizations implemented this, and few vendors provide tools to manage services in a strategic/planning context even today.
While there are operational versus planning needs creating the two portfolios, we find there is a common owner that is accountable for both. What APM practices call a “Business Owner” is often the same person SPM practices call a “Service Manager”. Often this common stakeholder is responsible for the business context of the IT product, whether it’s a product used internally or externally.
Another line being blurred is the consumers of the IT product; some are internal and increasingly many are external consumers. The differences in who uses an IT product are now becoming very blurry; for example, traditionally human resources systems that used to provide employee-facing functionality, now also offer job applicant functionality for external use. The user experience for the consumption of an IT product therefore needs to be considered in a similar fashion, whether it’s an employee consumption experience or customer-facing experience. Employees would become frustrated where employers were to provide poor employee experience. And worse, a customer’s experience with an IT product can spell disaster, resulting in loss of revenue and, in extreme cases, damage to the company’s brand.
Newer concepts have emerged to better manage all aspects of every IT product through the full value stream. “DPM” bridges the classic APM and SPM worlds into a full lifecycle approach, and this new portfolio management acumen is often used to maintain the planning, delivery, and operational details of the IT product, effectively collapsing two highly separated worlds into one simpler portfolio, and addressing both the portfolio-level challenges introduced at larger-scale, while simultaneously addressing gaps between planning and building an IT product versus deliver/run aspects.
To summarize, digital products and services increasingly are understood as the front end of value streams. Digital products and services provide desired outcomes consumers of the product want, and there is a value stream in the execution of a digital product or service.
However, there are also much longer lifecycle management concerns of the digital product or service itself and, for Digital Practitioners, it is important to keep in mind that the immediate end-to-end transactional gratification — for the digital product or service consumer — is a different concern than the management and governance of the full lifecycle of the multiple things that deliver that transactional gratification.
The former is oriented towards the consumer of the digital product or service, while the latter is oriented to the long-term stakeholder (the business owner) of the digital product or service.
6.3.2.4.2. Service Catalog versus Request Catalog
Service Catalogs and Request Catalogs are not the same. To clarify the difference, Rob England provides a good analogy:
"A service is a pipe. Customers sign up for a pipe. They select from a Service Catalog. Transactions come out of the pipe. Users request a transaction. They select from a Request Catalog."
England explains the analogy: "The customer is the business entity which is engaging to consume a service. A service provider agrees with another entity as the service customer. The individual people have delegated roles and responsibilities within that relationship including possibly the approval of transactions. If you as an individual buy a service from a service provider you are not personally buying it, you are buying on behalf of your organization.
The person who approves the expenditure on an individual transaction (a request) is not the customer. That is merely part of the internal process for request fulfilment. The person who agrees the initial engagement of the service is the customer.
The customer creates the pipe, the user consumes a transaction out of the pipe." [95]
Confusion around the distinction between these two catalogs has also caused come confusion for some service-level managers. Charles Betz writes: "Service-level metrics take two forms: First, there are those that measure the fulfill service request process (in this case, how long it took to provision someone’s email). Second, there are those that measure the aggregate performance of the system as a whole, as a "service" to multiple users and to those who paid for it.
This can be confusing, as a list of SLAs may or may not appear consistent with the Service Catalog. The orderable services provide user access to the human resources system, but the SLA may not be about how quickly such access is provided – instead, it may be about the aggregate experience of all the users who have access to the human resources system." [32]
6.3.2.4.3. Service Requests can Trigger Activities Against an Application Service or a Function
There are also ambiguities around the concept of the service lifecycle. "Some services (e.g., particular application services) have a lifecycle, yet other services (e.g., project management) would in theory always be required by the enterprise.
Some would solve this by saying that the actual "service" is not the application system, but that approach results in pushing important lifecycle activities down to a "system" level.
Another approach is simply to see the Service Catalog as containing distinct transactional/IT-based services and professional services; this is a pragmatic approach. The data implications might be that there is no one conceptual entity containing all "services" – the physical Service Catalog is an amalgamation of the two distinct concepts."
The semantics here are important and can be confusing when not fully understood [32].
6.3.2.4.4. Service Catalog Support for Hybrid Cloud, Multi-Cloud, and Service Integration and Management (SIAM)
Multi-cloud is the use of multiple cloud computing and storage services in a single heterogeneous architecture. This also refers to the distribution of cloud assets, software, applications, etc. across several cloud-hosting environments. With a typical multi-cloud architecture utilizing two or more public clouds as well as multiple private clouds, a multi-cloud environment aims to eliminate the reliance on any single cloud provider [306].
Hybrid cloud is a composition of two or more clouds (private, community, or public) that remain distinct entities but are bound together, offering the benefits of multiple deployment models. Hybrid cloud can also mean the ability to connect collocation, managed, and/or dedicated services with cloud resources. A hybrid cloud service crosses isolation and provider boundaries so that it can’t be simply put in one category of private, public, or community cloud service. It allows extension of either the capacity or the capability of a cloud service, by aggregation, integration, or customization with another cloud service [194].
More mature Service Catalogs provide metrics for cost and usage, selective service-level/quality guarantees, role-based support for secure and appropriate access, and integrated levels of automation to make service provisioning more dynamic, accessible, and efficient.
Service Catalog support for cloud services has increased and now nearly all organizations are using some form of a Service Catalog to support them, and cloud support priorities are growing in diversity. These include:
-
Internal Software as a Service (SaaS) applications
-
Internal Infrastructure as a Service (IaaS) services
-
SaaS from public cloud
-
IaaS from public cloud
-
Internal Platform as a Service (PaaS) offerings
-
PaaS from public cloud
[88]
Service Integration and Management (SIAM) is an approach to managing multiple suppliers of services (business services as well as IT services) and integrating them to provide a single business-facing IT organization. It aims at seamlessly integrating interdependent services from various internal and external service providers into end-to-end services in order to meet business requirements [306].
Multi-source IT operating models are increasingly common and offer many benefits; however, they also present some challenges. One of those challenges is managing and integrating services from multiple insourced and outsourced service providers, which may lead to issues falling into the gaps between the service providers. Digitalization increases the number of suppliers used in an organization. This has led to the need for SIAM, which has therefore become an emerging service area globally.
The Digital Product/Service Catalog is one of the key elements in SIAM. “A small but growing percentage of companies have a professional SIAM model in use and many companies lack a proper Service Catalog and CMDB, which include business services as well. The Service Catalog itself is essential in proving understandable and industrialized services for the business. If it is not in good shape, the IT operations are on a lower maturity level and cannot provide full value for the business and end users.”
The aim of SIAM is to:
-
Manage multiple suppliers and integrate them to deliver services
-
Ensure that the services meet the business need
-
Get single point of visibility and end-to-end accountability
-
Manage service management processes
-
Achieve multi-supplier control and provide governance over suppliers
[119]
SIAM can act a coordination mechanism for internal and external parties for cross-supplier catalog integration and can complement DevOps activities. "You have a value stream of activities across the product/service lifecycle that can be measured, discussed at all levels, improved with the use of technology, and delivered to the customer in a consistent and reliable manner. SIAM is going to suggest that you create a strong governance, but DevOps will encourage that this governance structure be flexible enough to not stifle the agility of delivery and improvement. Which adds to the culture of sharing and improvement." [41]
6.3.2.4.5. "Single Pane of Glass" Service or Request Catalogs?
Given all of the newer/digital Service and Request Catalog missions and capabilities, the holy grail of "Single Pane of Glass" Service or Request Catalogs is harder to achieve than ever. The reality is that many large organizations are both consuming services and making requests from - and offering services and fulfillment through - multiple Service and Request Catalogs. Still, this doesn’t mean that concepts, operating models, etc. which bring consolidation, synthesis, and integration should not be pursued where and when it is beneficial. In the new digital world, most endeavors that clarify, integrate, automate, optimize, etc. the value chains of business-critical services will benefit the business.
6.3.2.4.6. The Rise of ESM/EBM: Service Catalogs are Front-Ending Enterprise/Business Digital Products and Services
Enterprise Service Management (ESM)/Enterprise Business Management (EBM) is the practice of applying ITSM to other areas of an enterprise or organization with the purpose of improving performance, efficiency, and service delivery.
ESM (sometimes called EBM) is a holistic approach to service management that mirrors what ITSM does:
-
Uses service management concepts and principles
-
Implemented through the use of same or similar technologies, such as service desk and incident/service request software/ITSM suites, taking advantage of their self-service service delivery commoditization capabilities such as low-code or no-code workflow automation, platform-level knowledge management, and social/chat integration, etc. [267]
Enterprise/business service support through integrated service desk/ITSM tools combines Business Process Automation (BPA) and IT Process Automation (ITPA), and a striking number of IT organizations are making the leap; in fact, many organizations today are consolidating IT and non-IT customer service.
The following enterprise groups were among the most dependent on Service Catalogs to support their services:
-
Vendor and contract management
-
Facilities management
-
Purchasing
-
Enterprise operations
-
Sales
-
Human resources
-
Marketing
-
External customer-facing catalog options
-
Corporate finance
-
Legal
[88]
6.3.2.4.7. Digital Product/Service Catalog Support of Cloud and DevOps
In more advanced IT environments, Service Catalog integrations can handshake with service modeling and CMDBs to enable yet more advanced levels of automation; this can be especially helpful when catalog services are tied to development and DevOps initiatives [88].
George Lawton agrees: "With the evolution and adoption of cloud and DevOps, enterprises have seen a number of new opportunities to expand the use of Service Catalogs … Traditionally, a Service Catalog was limited to simple types of requests such as access requests, password resets, and new end-user technology hardware purchases.
Now, with the advent of new IaaS cloud platforms, Service Catalogs have expanded to allow IT and software engineering teams to request; for example:
-
New virtual machines with automated provisioning
-
Items to manage those virtual machines and to configure load balancers
-
Domain name system configurations
-
Firewall configurations
Indeed, through Service Catalogs and automation capabilities, the need for a centralized infrastructure for non-production environments is diminishing. We are continually looking for opportunities to develop and deploy new catalog items with a big focus on automation … And we are continually seeing a huge decrease in requests that require IT to touch requests in order for them to be fulfilled, and a huge increase in both man-hours saved from IT support staff and wait time saved from our requestors." [176]
Many are aware of "the growing generational gap between public clouds and enterprise IT. Consider the size of budgets public cloud companies invest in R&D. The budgets are astronomically huge when you compare to the budget of a typical enterprise IT. This economy of scale is likely only going to widen with time. Most enterprises will be unable to match the scale or technical expertise of public clouds in their private data centers.
This gap leads to some innovative developers in enterprises to be mavericks, bypassing traditional IT departments and operating outside enterprise control to look for the next-generation services and infrastructure. To avoid this, IT often focuses not on provisioning infrastructure, but providing the infrastructure and application components as a service to empower these developers_." [184]
6.3.2.4.8. Using AI to Automate Requests/Cognitive Service Catalogs
"One of the challenges with traditional Service Catalogs was that they placed a burden on the employee making a request, thus limiting adoption. "Previously, Service Catalogs were clunky and portal-based. The customer had to log in, file a request, and wait for the request to be fulfilled … CIOs can reduce this burden using conversational bots to automate requests. Employees simply chat with the bot, tell it what they need, and the bot uses AI to learn employees' preferences along the way.
One large telco … was going through a massive transformation around employee and customer service experience. The company pursued a strategy of using bots across multiple chat channels including Slack, SMS, and Skype to access a Service Catalog. Any industry that is affected by the accuracy, speed, and cost of customer service can use this technology to automate their service desk function. We are seeing a lot of momentum around telcos that are facing increasing pressure to move faster, and financial institutions like banks are moving toward cognitive Service Catalogs." [176]
6.3.2.4.9. The Service/Request Catalog and Digital Financial Management
As the Service and Request Catalog discussions in this section should make clear, the Service Catalog’s role as a live services subset of the Service Portfolio - along with Service Portfolio Mnagement concepts and goals - is a complex one.
Technology Business Management (TBM) is a framework for “running IT with greater business acumen” to effectively and consistently communicate the cost of IT along with the business services IT provides. The primary goal of TBM is to provide the ability of IT and business leaders to have data-driven discussions ("value conversations") about cost and value of IT to best support business goals. It is designed to provide “a shared decision-making model for technology and business leaders” and a structure for IT executives to have “conversations with the CEO and the Board of Directors about the value of IT investments” [72].
In order to price digital products/services and requests, you have to know the cost for them. TBM attempts to bring rosetta stone capabilities for translating the language and numbers between the business, IT, and finance. Among other things, TBM also provides techniques for service and digital product-centric costing to aid Service Catalog pricing efforts, but also cost-per-unit calculation techniques needed for Request Catalog pricing.
As Jez Humble writes: "Agile methods and continuous delivery have been successfully applied to everything from mainframe systems in large financial services companies to embedded systems in consumer electronics, consistently delivering higher-quality, faster delivery, greater business responsiveness, and reduced costs over the product lifecycle.
Any company that hopes to survive in the digital age must move beyond zero sum thinking. The recipe is easy to understand, but hard to implement: leaders must set and communicate clear business goals in terms of time-to-market, quality, and cost. They must then invest the necessary resources for everyone in the organization to collaborate so they can solve the problems that prevent them from achieving these goals. Nothing should be out of scope - Enterprise Architecture, process, budgeting, and governance, risk and compliance." [135]
TBM is a key enabler for such collaboration among the business, IT, and finance.
6.3.2.4.10. Service/Request Catalog Maturity as a Measure of Success
A recent survey compared some features of "companies who view themselves as "extremely successful" with those who were only marginally so (the two extremes), which almost always produces meaningful patterns of difference. In this case, the following patterns arose.
Those ITSM teams who viewed themselves as extremely successful were:
-
2X more likely to have a Service Catalog
-
2X more likely to offer users access to corporate applications through mobile
-
Dramatically more likely to support cloud-related services in their catalogs; in fact they were 5X more likely to support SaaS from public cloud and 6X more likely to support PaaS from public cloud
-
Considerably more likely to support enterprise services, including:
-
2X more likely to support human resources
-
3X more likely to support facilities management
-
2X more likely to support legal
-
More than 4X more likely to support purchasing
-
5X more likely to support marketing
-
Nearly 3X more likely to support enterprise operations
-
Given this data, it becomes obvious that we are not only living in the midst of the "digital age" in which "Digital Transformation" is key, but that Service Catalogs are increasingly becoming a critical cornerstone in making Digital Transformation yet more of a reality [88].
6.3.2.4.11. Service/Product Catalog Conclusion
Digital Practitioners should understand that there is now more being accomplished by Service Catalogs than ever before, and there is a clear need for scale-appropriate, Lean, Agile, and outcome-focused Digital Product/Service Catalog and Request Catalog management and governance strategies and roadmaps to manage this complexity.
Since organizations will not want to implement all possible Service and Request Catalog missions at once, organizations should find it beneficial to fold the Service and Request Catalog development and maturity under their coordination and investment management areas, at the team of teams level, and under their governance and Enterprise Architecture areas at the enduring enterprise level, to take advantage of their Service Catalog complementary tools and techniques, such as Service Catalog roadmap development, Service Catalog goverance policies, etc.
Related Topics
To be added in a future version.
6.3.2.5. Project Management
Description
In the DPBoK emergence model, we always seek to make clear why we need a new concept or practice. It is not sufficient to say: “we need project management because companies of our size use it”. Many authoritative books on Agile software development assume that some form of project management is going to be used. Other authors question the need for it or at least raise various cautions.
Project management, like many other areas of IT practice, is undergoing a considerable transformation in response to the Agile transition. However, it will likely remain an important tool for value delivery at various scales.
Fundamentally, project management is a means of understanding and building a shared mental model of a given scope of work. In particular, planning the necessary tasks gives a basis for estimating the time and cost of the work as a whole, and therefore understanding its value. Even though industry practices are changing, value remains a critical concern for the Digital Practitioner.
As the above quotes indicate, there are diverse opinions on the role and importance of traditional project management in the enterprise. Clearly, it is under pressure from the Agile movement. Project management professionals are advised not to deny or diminish this fact. One of the primary criticisms of project management as a paradigm is that it promotes large “batches” of work. It is possible for a modern, IT-centric organization to make considerable progress on the basis of product management plus simple, continuous work management, without the overhead of the formalized project lifecycle suggested by the PMBOK.
Cloud computing is having impacts on traditional project management as well. As we will see in the section on the decline of traditional IT, projects were often used to install vendor-delivered commodity software, such as for payroll or employee expense. Increasingly, that kind of functionality is delivered by online service providers, leaving “traditional” internal IT with considerably reduced responsibilities.
Some of the IT capability may remain in the guise of an internal “service broker”, to assist with the sourcing and procurement of online services. The remainder moves into DPM, as the only need for internal IT is in the area of revenue-generating, market-facing strategic digital product.
So, this section will examine the following questions:
-
Given the above trends, under what circumstances does formalized project management make economic sense?
-
Assuming that formalized project management is employed, how do we continue to support objectives such as fast feedback and adaptability?
6.3.2.5.1. A Traditional IT Project
So, what does all this have to do with IT? As discussed in previous material, project management is one of the main tools used to deliver value across specialized skill-based teams, especially in traditional IT organizations.
A “traditional” IT project would usually start with the “sponsorship” of some executive with authority to request funding. For example, suppose that the VP of Logistics under the Chief Operating Officer (COO) believes that a new supply chain system is required. With the sponsorship of the COO, she puts in a request (possibly called a “demand request” although this varies by organization) to implement this system. The assumption is that a commercial software package will be acquired and implemented. The IT department serves as an overall coordinator for this project. In many cases, the “demand request” is registered with the enterprise PMO, which may report to the CIO.
|
Note
|
Why might the Enterprise PMO report under the CIO? IT projects in many companies represent the single largest type of internally managed capital expenditure. The other major form of projects - building projects - are usually outsourced to a general contractor. |
The project is initiated by establishing a charter, allocating the funding, assigning a project manager, establishing communication channels to stakeholders, and a variety of other activities. One of the first major activities of the project will be to select the product to be used. The project team (perhaps with support from the architecture group) will help lead the RFI/RFQ processes by which vendors are evaluated and selected.
|
Note
|
RFI stands for Request for Information; RFQ stands for Request for Quote. See the links for definitions. |
Once the product is chosen, the project must identify the staff who will work on it, perhaps a combination of full-time employees and contractors, and the systems implementation lifecycle can start.
We might call the above, the systems implementation lifecycle, not the software development lifecycle. This is because most of the hard software development was done by the third party who created the supply chain software. There may be some configuration or customization (adding new fields, screens, reports) but this is lightweight work in comparison to the software engineering required to create a system of this nature.
The system requires its own hardware (servers, storage, perhaps a dedicated switch) and specifying this in some detail is required for the purchasing process to start. The capital investment may be hundreds of thousands or millions of dollars. This, in turn, requires extensive planning and senior executive approval for the project as a whole.
It would not have been much different for a fully in-house developed application, except that more money would have gone to developers. The slow infrastructure supply chain still drove much of the behavior, and correctly “sizing” this infrastructure was a challenge particularly for in-house developed software. (The vendors of commercial software would usually have a better idea of the infrastructure required for a given load.) Hence, there is much attention to up-front planning. Without requirements there is no analysis or design; without design, how do you know how many servers to buy?
Ultimately, the project comes to an end, and the results (if it is a product such as a digital service) are transitioned to a “production” state. Figure 96, “Traditional IT Implementation Lifecycle” presents a graphical depiction.
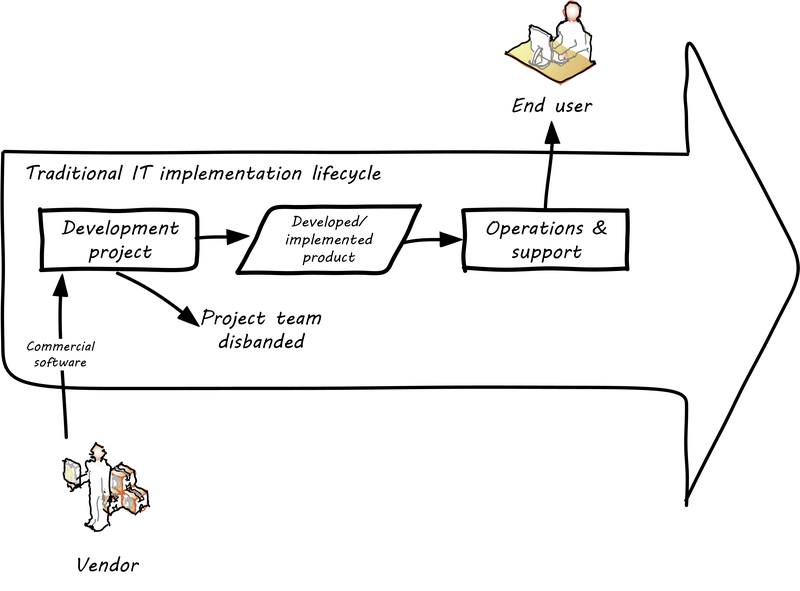
There are a number of problems with this classic model, starting with the lack of responsiveness to consumer needs (see Figure 97, “Customer Responsiveness in Traditional Model”).
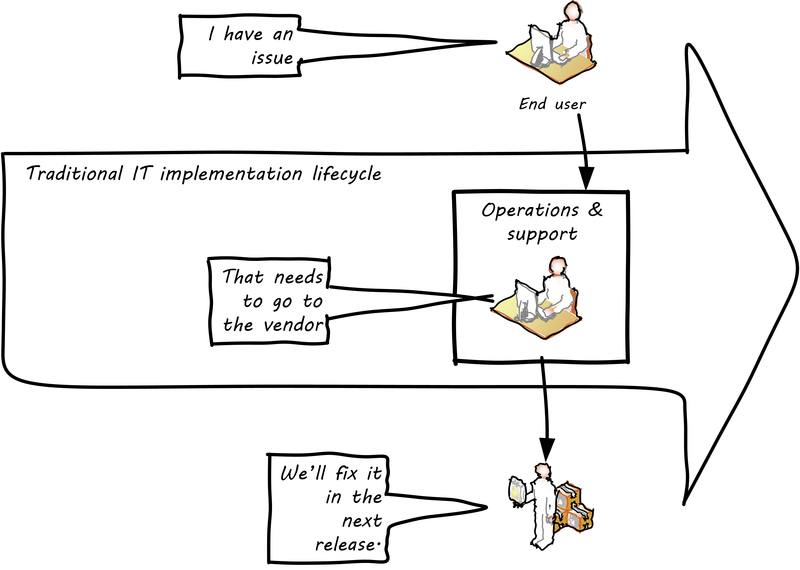
This might work for a non-competitive function, but if the “digital service consumer” has other options, they may go elsewhere. If they are an internal user within an enterprise, they might be engaged in critical competitive activities.
The above scenario is in decline, and along with it a way of life for many “IT” professionals. One primary reason is cloud, and in particular SaaS. Another reason is the increasing adoption of the Lean/Agile product development approach for digital services. Figure 98, “Traditional Enterprise IT “Space”” presents one view of the classic model.
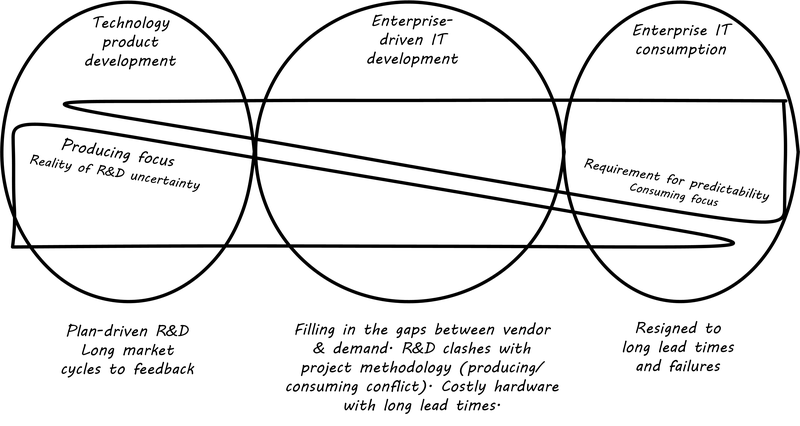
Notice the long triangles labeled “Producing focus” and “Consuming focus”. These represent the perspectives of (for example) a software vendor versus their customer. Traditionally, the R&D functions were most mature within the product companies. What was less well understood was that internal IT development was also a form of R&D. Because of the desire for scope management (predictability and control), the IT department performing systems development was often trapped in the worst of both worlds — having neither a good quality product nor high levels of certainty. For many years, this was accepted by the industry as the best that could be expected. However, the combination of Lean/Agile and cloud is changing this situation (see Figure 99, “Shrinking Space for Traditional IT”).
There is diminishing reason to run commodity software (e.g., human resources, payroll, expenses, etc.) in-house. Cloud providers such as Workday, Concur, Salesforce, and others provide ready access to the desired functionality “as a service”. The responsiveness and excellence of such products are increasing, due to the increased tempo of market feedback (note that while a human resource management system may be a commodity for your company, it is strategic for Workday) and concerns over security and data privacy are rapidly fading.
What is left internal to the enterprise, increasingly, are those initiatives deemed “competitive” or “strategic”. Usually, this means that they are going to contribute to a revenue stream. This, in turn, means they are “products” or significant components of them. (See Section 6.2.1.1, “Product Management Basics”.) A significant market-facing product initiative (still calling for project management per se) might start with the identification of a large, interrelated set of features, perhaps termed an “epic”. Hardware acquisition is a thing of the past, due to either private or public cloud. The team starts with analyzing the overall structure of the epic, decomposing it into stories and features, and organizing them into a logical sequence.
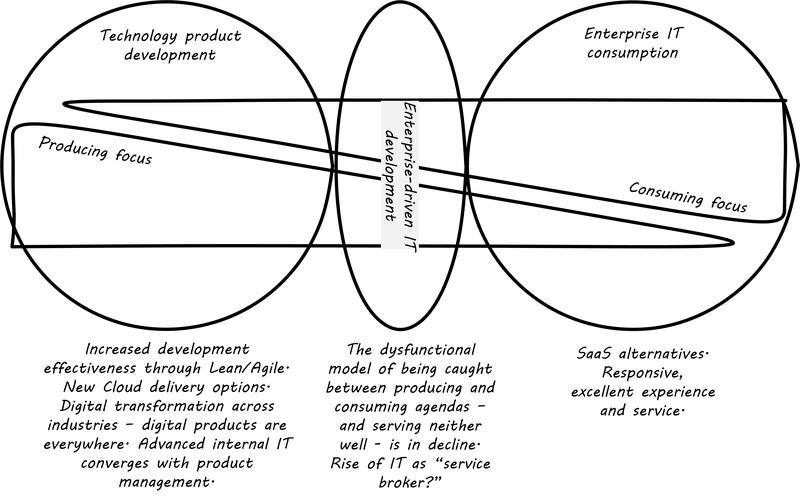
Because capacity is available on-demand, new systems do not need to be nearly as precisely “sized”, which meant that implementation could commence without as much up-front analysis. Simpler architectures suffice until the real load is proven. It might then be a scramble to refactor software to take advantage of new capacity, but the overall economic effect is positive, as over-engineering and over-capacity are increasingly avoided. So, IT moves in two directions — its most forward-looking elements align to the enterprise product management roadmap, while its remaining capabilities may deliver value as a “service broker”. (More on this in the section on IT sourcing.)
Let’s return to the question of project management in this new world.
6.3.2.5.2. How is a Project Different from Simple “Work Management”?
In Section 6.2.2, “Work Management”, we covered a simple concept of “work management” that deliberately did not differentiate product, project, and/or process-based work. As was noted at the time, for smaller organizations, most or all of the organization would be the “project team”, so what would be the point?
The project is starting off as a list of tasks that is essentially identical to a product backlog. Even in Kanban, we know who is doing what, so what is the difference? Here are key points:
-
The project is explicitly time-bound; as a whole, it is lengthier and more flexible than the repetitive, time-boxed sprints of Scrum, but more fixed than the ongoing flow of Kanban
-
Dependencies - you may have had a concept of one task or story blocking another, and perhaps you used a white board to outline more complex sequences of work, but project management has an explicit concept of dependencies in the tasks and powerful tools to manage them; this is essential in the most ambitious and complex product efforts
-
Project management also has more robust tools for managing people’s time and effort, especially as they translate to project funding; while estimation and ongoing re-planning of spending can be a contentious aspect of project management, it remains a critical part of management practice in both IT and non-IT domains
At the end of the day, people expect to be paid for their time, and investors expect to be compensated through the delivery of results. Investment capital only lasts as a function of an organization’s “burn rate”; the rate at which the money is consumed for salaries and expenses. Some forecasting of status (whether that of a project, organization, product, program, etc.) is, therefore, an essential and unavoidable obligation of management unless funding is unlimited (a rare situation to say the least).
Project accounting, at scale, is a deep area of considerable research and theory behind it. In particular, the concept of Earned Value Management is widely used to quantify the performance of a project portfolio.
6.3.2.5.3. The “Iron Triangle”
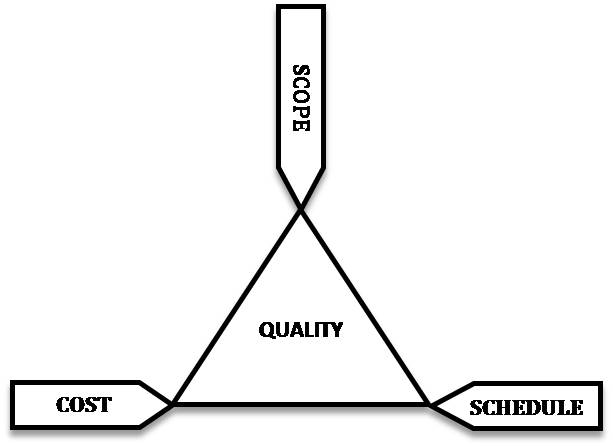
The project management "Iron Triangle" represents the interaction of cost, time, scope, and quality of a project (see Figure 100, “Project “Iron Triangle””[7]). The idea is that, in general, one or more of these factors may be a constraint.
The same applies to project management and reflects well the “Iron Triangle” of trade-offs. However, more recent thinking in the DevOps movement suggests that optimizing for continuous flow and speed tends to have beneficial impacts on quality as well. As digital pipelines increase their automation and speed to delivery, quality also increases because testing and building become more predictable. Conversely, the idea that stability increases through injecting delay into the deployment process (i.e., through formal change management) is also under question (see [100]).
6.3.2.5.4. Project Practices
Project management (not restricted to IT) is a defined area of study, theory, and professional practice. This section provides a (necessarily brief) overview of these topics.
We will first discuss the PMBOK, which is the leading industry framework-in-project management, at least in the US. (PRINCE2® is another framework, originating from the UK, which will not be covered in this edition.) We will spend some time on the critical issues of scope management which drive some of the conflicts seen between traditional project management and Agile product management.
PMBOK details are easily obtained on the web, and will not be repeated here. It is clear that the Agile critiques of waterfall project management have been taken seriously by the PMBOK thought leaders. There is now a PMI Agile certification and much explicit recognition of the need for iterative and incremental approaches to project work.
The PMBOK remains extensive and complex when considered as a whole. This is necessary, as it is used to manage extraordinarily complex and costly efforts in domains such as construction, military/aerospace, government, and others. Some of these efforts (especially those involving systems engineering, over and above software engineering) do have requirements for extensive planning and control that the PMBOK meets well.
However, in Agile domains that seek to be more adaptive to changing business dynamics, full use of the PMBOK framework may be unnecessary and wasteful. The accepted response is to “tailor” the guidance, omitting those plans and deliverables that are not needed.
|
Important
|
Part of the problem with extensive frameworks such as the PMBOK is that knowing how and when to tailor them is hard-won knowledge that is not part of the usual formalized training. And yet, without some idea of “what matters” in applying the framework, there is great risk of wasted effort. The Agile movement in some ways is a reaction to the waste that can result from overly detailed frameworks. |
Scope management is a powerful tool and concept, at the heart of the most challenging debates around project management. The PMBOK uses the following definitions [223]:
Scope: The sum of the products, services, and results to be provided as a project. See also project scope and product scope.
Scope Change: Any change to the project scope. A scope change almost always requires an adjustment to the project cost or schedule.
Scope Creep: The uncontrolled expansion of product or project scope without adjustments to time, cost, and resources.
Change Control: A process whereby modifications to documents, deliverables, or baselines associated with the project are identified, documented, approved, or rejected.
In the Lean Startup world, products may pivot and pivot again, and their resource requirements may flex rapidly based on market opportunity. Formal project change control processes are in general not used. Even in larger organizations, product teams may be granted certain leeway to adapt their “products, services, and results” and while such adaptations need to be transparent, formal project change control is not the vehicle used.
On the other hand, remember our emergence model. The simple organizational change from one to multiple products may provoke certain concerns and a new kind of contention for resources. People are inherently competitive and also have a sense of fairness. A new product team that seems to be unaccountable for results, consuming “more than its share” of the budget while failing to meet the original vision for their existence, will cause conflict and concern among organizational leadership.
It is in the tension between product autonomy and accountability that we see project management techniques such as the Work Breakdown Structure (WBS) and project change control employed. The WBS is defined by the PMBOK as:
… a hierarchical decomposition of the total scope of work to be carried out by the project team to accomplish the project objectives and create the required deliverables. The WBS organizes and defines the total scope of the project, and represents the work specified in the current approved project. [223]
[222] recommends: “Subdivide your WBS component into additional deliverables if you think either of the following situations applies: The component will take much longer than two calendar weeks to complete. The component will require much more than 80 person-hours to complete.”
This may seem reasonable, but in iterative product development, it can be difficult to “decompose” a problem in the way project management seems to require. Or to estimate in the way Portny suggests. This can lead to two problems.
First, the WBS may be created at a seemingly appropriate level of detail, but since it is created before key information is generated, it is inevitably wrong and needing ongoing correction. If the project management approach requires a high-effort “project change management” process, much waste may result as “approvals” are sought for each feedback cycle. This may result in increasing disregard by the development team for the project manager and his/her plan, and corresponding cultural risks of disengagement and lowering of trust on all sides.
Second, we may see the creation of project plans that are too high-level, omitting information that is in fact known at the time — for example, external deadlines or resource constraints. This happens because the team develops a cultural attitude that is averse to all planning and estimation.
Project management is where we see the first formalization of risk management (which will be more extensively covered in Section 6.4.1, “Governance, Risk, Security, and Compliance”). Briefly, risk is classically defined as the probability of an adverse event times its cost. Project managers are alert to risks to their timelines, resource estimates, and deliverables.
Risks may be formally identified in project management tooling. They may be accepted, avoided, transferred, or mitigated. Unmanaged risks to a project may result in the project as a whole reporting an unfavorable status.
Enterprise IT organizations have evolved to use a mix of project management, processes, and ad hoc work routing to achieve their results. Often, resources (people) are assigned to multiple projects; a practice sometimes called “fractional allocation”.
In fractional allocation, a Database Administrator (DBA) will work 25% on one project, 25% on another, and still be expected to work 50% on ongoing production support. This may appear to work mathematically, but practically it is an ineffective practice. Both Gene Kim in The Phoenix Project [165] and Eli Goldratt in Critical Chain [112] present dramatized accounts of the overburden and gridlock that can result from such approaches.
As previously discussed, human beings are notably bad at multi-tasking, and the mental “context-switching” required to move from one task to another is wasteful and ultimately not scalable. A human being fractionally allocated to more and more projects will get less and less done in total, as the transactional friction of task switching increases.
A third major reason for the continued use of project management and its techniques is governing work that has been outsourced to third parties. This is covered in detail in the section on sourcing.
6.3.2.5.5. The Future of Project Management
Recall our three “Ps”:
-
Product
-
Project
-
Process
Taken together, the three represent a coherent set of concerns for value delivery in various forms. But in isolation, any one of them ultimately is limited. This is a particular challenge for project management, whose practitioners may identify deeply with their chosen field of expertise.
Clearly, formalized project management is under pressure. Its methods are perceived by the Agile community as overly heavyweight; its practitioners are criticized for focusing too much on success in terms of cost and schedule performance and not enough on business outcomes. Because projects are by definition temporary, project managers have little incentive to care about technical debt or operational consequences. Hence the rise of the product manager.
However, a product manager who does not understand the fundamentals of project execution will not succeed. As we have seen, modern products, especially in organizations scaling up, have dependencies and coordination needs, and to meet those needs, project management tools will continue to provide value.
Loose coupling to the project plan rescue? While this document does not go into systems architectural styles in depth, a project with a large number of dependencies may be an indication that the system or product being constructed also has significant interdependencies. Recall Amazon’s product strategy including its API mandate.
Successful systems designers for years have relied on concepts such as encapsulation, abstraction, and loose-coupling to minimize the dependencies between components of complex systems so that their design, construction, and operation can be managed with some degree of independence. These ideas are core to the software engineering literature. Recent expressions of these core ideas are SOA and microservices.
Systems that do not adopt such approaches are often termed “monolithic” and have a well-deserved reputation for being problematic to build and operate. Many large software failures stem from such approaches. If you have a project plan with excessive dependencies, the question at least should be asked: does my massive, tightly-coupled project plan indicate I am building a monolithic, tightly-coupled system that will not be flexible or responsive to change?
Again, many digital companies build tremendously robust integrated services from the combination of many quasi-independent, microservice-based “product” teams, each serving a particular function. However, when a particular organizational objective requires changes to more than one such “product”, the need for cross-team coordination emerges. Someone needs to own this larger objective, even if its actual implementation is carried out across multiple distinct teams. We will discuss this further in Section 6.3.3, “Organization and Culture”.
Evidence of Notability
Project management has historically been the primary vehicle for funding and managing new IT and digital functionality. It is only in the past decade that the product management alternative has emerged as a replacement.
Limitations
There are many limitations to project management as an IT delivery paradigm, starting with the premise that it is temporary. Implicit in this approach is an assumption that temporary projects "build" things to be "run" ongoing by an operations team. In other words, it is difficult to implement project management without implementing waterfall development to some degree.
Related Topics
6.3.3. Organization and Culture
Area Description
The organization is going through a critical phase, the “team of teams” transition. There are increasingly specialized people delivering an increasingly complex digital product, or perhaps even several distinct products. Deep-skilled employees are great, but they tend to lose the big picture. The organization is in constant discussions around the tension between functional depth versus product delivery. And when it goes from one team to multiple, the topic of the organization must be formalized.
Leaders often must think about how their company should be structured. There is no shortage of opinions there. From functional centers of excellence to cross-functional product teams, and from strictly hierarchical models to radical models like holacracy, there seems to be an infinite variety of choices.
A structure needs to be filled with the right people. How can the organization retain that startup feel it had previously, with things getting this big? Many leaders know intuitively that great hires are the basis for your company’s success, but now the organization must think more systematically about hiring. Finally, the people hired will create the company’s culture. Many employees and consultants emphasize the role of culture, but what do they mean? Is there such a thing as a “good” culture? How is one culture better than another?
Ultimately, as the Digital Practitioner moves into higher leadership, they realize that the concern for organization and culture is all about creating the conditions for success. The leader can’t drive success as an individual any more; that is increasingly for others to do. All you can do is set the stage for their efforts, provide overall direction and vision, and let your teams do what they do best.
This Competency Area proceeds in a logical order, from operational organization forms, to populating them by hiring staff, to the hardest to change questions of culture.
6.3.3.1. Structuring the Organization: Product and Function
Description
There are two major models that Digital Practitioners may encounter in their career:
-
The traditional centralized back-office “IT” organization
-
Digital technology as a component of market-facing product management
The traditional IT organization started decades ago, with “back-office” goals like replacing file clerks and filing cabinets. At that time, computers were not flexible or reliable, business did not move as fast, and there was a lot of value to be gained in relatively simple efforts like converting massive paper filing systems into digital systems. As these kinds of efforts grew and became critical operational dependencies for companies, the role of Chief Information Officer (CIO) was created, to head up increasingly large organizations of application developers, infrastructure engineers, and operations staff.
The business objectives for such organizations centered on stability and efficiency. Replacing 300 file clerks with a system that didn’t work, or that wound up costing more was obviously not a good business outcome! On the other hand, it was generally accepted that designing and implementing these systems would take some time. They were complex, and many times the problem had never been solved before. New systems might take years — including delays — to come online, and while executives might be unhappy, oftentimes the competition wasn’t doing much better. CIOs were conditioned to be risk-averse; if systems were running, changing them was scrutinized with great care and rarely rushed.
The culture and practices of the modern IT organization became more established, and while it retained a reputation for being slow, expensive, and inflexible, no-one seemed to have any better ideas. It didn’t hurt that the end customer wasn’t interested in computers.
Then along came the personal computer, and the dot-com boom. Suddenly everyone had personal computers at home and was on the Internet. Buying things! Computers continued to become more reliable and powerful as well. Companies realized that their back-office IT organizations were not able to move fast enough to keep up with the new e-commerce challenge, and in many cases organized their Internet team outside of the CIO’s control (which sometimes made the traditional IT organization very unhappy). Silicon Valley startups such as Google and Facebook in general did not even have a separate “CIO” organization, because for them (and this is a critical point) the digital systems were the product. Going to market against tough competitors (Alta Vista and Yahoo® against Google, Friendster and MySpace against Facebook) wasn’t a question of maximizing efficiency. It was about product innovation and effectiveness and taking appropriate risks in the quest for these rapidly growing new markets.
Let’s go back to our example of the traditional CIO organization. A typical structure under the CIO might look as shown in Figure 101, “Classic IT Organization”.
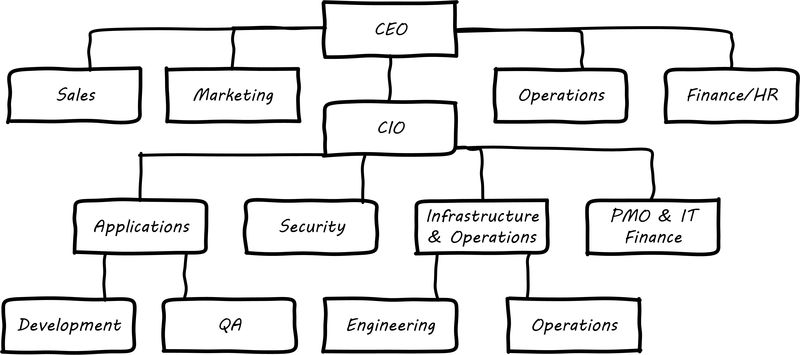
(We had some related discussion in Table 11, “Application, Infrastructure, Development, Operations”). Such a structure was perceived to be “efficient” because all the server engineers would be in one organization, while all the Java developers would be in another, and their utilization could be managed for efficiency. Overall, having all the “IT” people together was also considered efficient, and the general idea was that “the business” (sales, marketing, operations, and back-office functions like finance and human resources) would define their "requirements" and the IT organization would deliver systems in response. It was believed that organizing into "centers of excellence” (sometimes called organizing by function) would make the practices of each center more and more effective, and therefore more valuable to the organization as a whole. However, the new digital organizations perceived that there was too much friction between the different functions on the organization chart. Skepticism also started to emerge that “centers of excellence” were living up to their promise. Instead, what was too often seen was the emergence of an “us versus them” mentality, as developers argued with the server and network engineers.
One of the first companies to try a completely different approach was Intuit. As Intuit started selling its products increasingly as services, it re-organized and assigned individual infrastructure contributors - e.g., storage engineers and DBAs - to the product teams with which they worked [4], p.103.
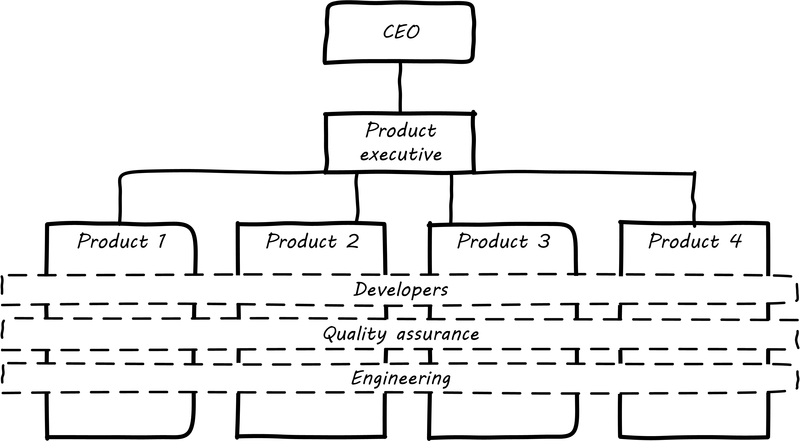
This model is also called the "Spotify model” (see Figure 102, “New IT Organization”). The dotted line boxes (Developers, Quality Assurance, Engineering) are no longer dedicated “centers of excellence” with executives leading them. Instead, they are lighter-weight “communities of interest” organized into chapters and guilds. The cross-functional product teams are the primary way work is organized and understood, and the communities of interest play a supporting role. Henrik Kniberg provided one of the first descriptions of how Spotify organizes along product lines [169]. (Attentive readers will ask: “What happened to the PMO? And what about security?”. There are various answers to these questions, which we will continue to explore in Context III.)
One important note: Human resources management lines of authority in this model may still be by functional center, not product line. This is the case at Spotify. However, the overall power structure shifts in favor of product focus decisively.
The consequences of this transition in organizational style are still being felt and debated. Sriram Narayan is in general an advocate of product organization. However, in his book Agile Organization Design, he points out that “IT work is labor-intensive and highly specialized”, and therefore managing IT talent is a particular organizational capability it may not make sense to distribute [207]. Furthermore, he observes that IT work is performed on medium to long time scales, and “IT culture” differs from “business culture”, concluding that "although a merger of business and IT is desirable, for the vast majority of big organizations it isn’t going to happen anytime soon".
Conversely, Abbott and Fisher in The Art of Scalability argue that: "… The difference in mindset, organization, metrics, and approach between the IT and product models is vast. Corporate technology governance tends to significantly slow time-to-market for critical projects … IT mindsets are great for internal technology development, but disastrous for external product development” [4 pp. 122-124]. However, it is possible that Abbott and Fisher are overlooking the decline of traditional IT. Hybrid models exist, with “product” teams reporting up under “business” executives, and the CIO still controlling the delivery staff who may be co-located with those teams. We will discuss the alternative models in more detail below.
6.3.3.1.1. Conway’s Law
Melvin Conway is a computer programmer who worked on early compilers and programming languages. In 1967 he proposed the thesis that:
Any organization that designs a system (defined broadly) will produce a design whose structure is a copy of the organization’s communication structure. [73].
What does this mean? If we establish two teams, each team will build a piece of functionality (a feature or component). They will think in terms of “our stuff” and “their stuff” and the interactions (or interface) between the two. Perhaps this seems obvious, but as you scale up, it is critical to keep in mind. In particular, as you segment your organization along the AKF y-axis, you will need to keep in mind the difference between features and components. You are on a path to have dozens or hundreds of such teams. The decisions you make today on how to divide functionality and work will determine your operating model far into the future.
Ultimately, Conway’s law tells us that to design a product is also to design an organization and vice versa. This is important for designers and architects to remember.
6.3.3.1.2. Defining the Organization
There are many different ways we can apply these ideas of traditional functional organizing versus product-oriented organizing, and features versus components. How do we begin to decide these questions? As a Digital Practitioner in a scaling organization, you need to be able to lead these conversations. The cross-functional, diverse, collaborative team is a key unit of value in the digital enterprise, and its performance needs to be nurtured and protected.
Abbott and Fisher suggest the following criteria when considering organizational structures [4 p. 12]:
-
How easily can I add or remove people to/from this organization? Do I need to add them in groups, or can I add individual people?
-
Does the organizational structure help or hinder the development of metrics that will help measure productivity?
-
Does the organizational structure allow teams to own goals and feel empowered and capable of meeting them?
-
Which types of conflict will arise, and will that conflict help or hinder the mission of the organization?
-
How does this organizational structure help or hinder innovation within my company?
-
Does this organizational structure help or hinder the time-to-market for my products?
-
How does this organizational structure increase or decrease the cost per unit of value created?
-
Does work flow easily through the organization, or is it easily contained within a portion of the organization?
6.3.3.1.3. Team Persistence
Team persistence is a key question. The practice in project-centric organizations has been temporary teams, that are created and broken down on an annual or more frequent basis. People “rolled on” and “rolled off” projects regularly in the common heavyweight project management model. Often, contention for resources resulted in fractional project allocation, as in “you are 50% on Project A and 25% on Project B” which could be challenging for individual contributors to manage. With team members constantly coming and going, developing a deep, collective understanding of the work was difficult. Hard problems benefit from team stability. Teams develop both a deeper rational understanding of the problem, as well as emotional assets such as psychological safety. Both are disrupted when even one person on a team changes. Persistent teams of committed individuals also (in theory) reduce destructive multi-tasking and context-switching.
6.3.3.1.4. Product and Function
There is a fundamental tension between functional specialization and end-to-end value delivery — the tendency for specialist teams start to identify with their specialty and not the overall mission. The tension may go by different names:
-
Product versus function
-
Value stream versus activity
-
Process versus silo
As we saw previously, there are three major concepts used to achieve an end-to-end flow across functional specialties:
-
Product
-
Project
-
Process
These are not mutually-exclusive models and may interact with each other in complex ways. (See the scaling discussion in the Context III introduction.)
6.3.3.1.5. Waterfall and Functional Organization
For example, some manufacturing can be represented as a very simple, sequential process model (see Figure 103, “Simple Sequential Manufacturing”).
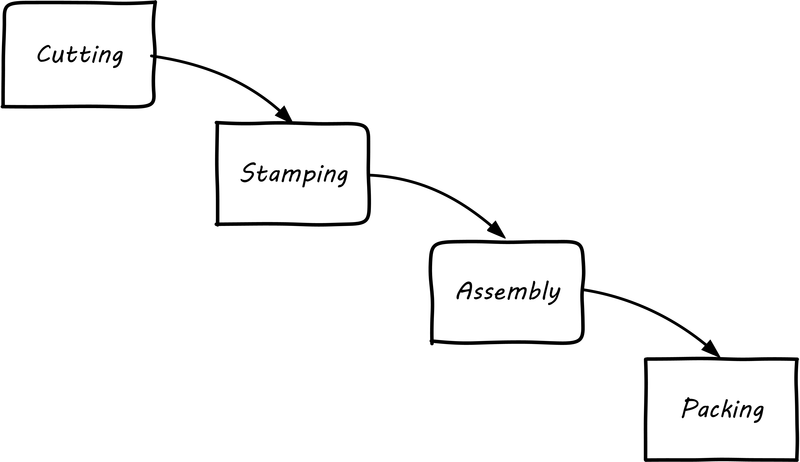
The product is already defined, and the need to generate information (i.e., through feedback) is at an absolute minimum.
|
Note
|
Even in this simplest model, feedback is important. Much of the evolution of 20th century manufacturing has been in challenging this naive, open-loop model. (Remember our brief discussion of open-loop?) The original, open-loop waterfall model of IT systems implementation (see Figure 104, “Waterfall”) was arguably based on just such a naive concept. |
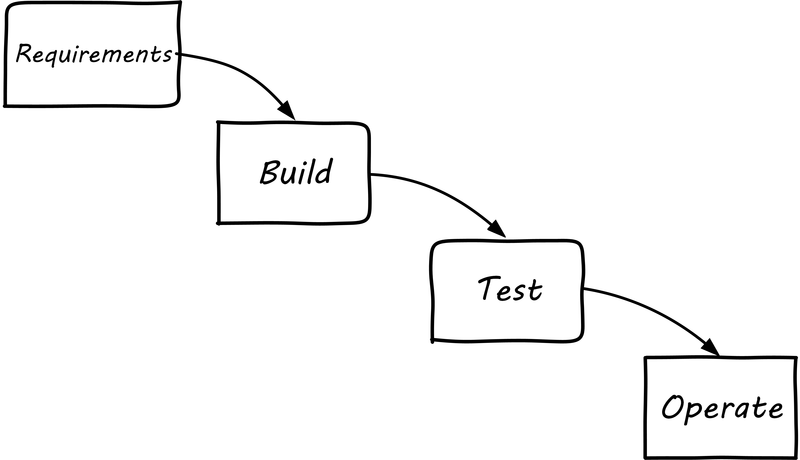
(Review Section 6.1.3.2, “Agile Software Development” on waterfall development and Agile history.) Functional, or practice, areas can continually increase their efficiency and economies of scale through deep specialization.
6.3.3.1.6. Defining “Practice"
A “practice” is synonymous with “discipline” — it is a set of interrelated precepts, concerns, and techniques, often with a distinct professional identity. “Java programming”, “security”, or “capacity management” are practices. When an organization is closely identified with a practice, it tends to act as a functional silo (more on this to come). For example, in a traditional IT organization, the Java developers might be a separate team from the HTML, CSS and JavaScript specialists. The DBAs might have their own team, and also the architects, business analysts, and quality assurance groups. Each practice or functional group develops a strong professional identity as the custodians of “best practices” in their area. They may also develop a strong set of criteria for when they will accept work, which tends to slow down product discovery.
There are two primary disadvantages to the model of projects flowing in a waterfall sequence across functional areas:
-
It discourages closed-loop feedback
-
There is transactional friction at each hand-off
Go back and review: the waterfall model falls into the “original sin” of IT management, confusing production with product development. As a repeatable production model, it may work, assuming that there is little or no information left to generate regarding the production process (an increasingly questionable assumption in and of itself). But when applied to product development, where the primary goal is the experiment-driven generation of information, the model is inappropriate and has led to innumerable failures. This includes software development, and even implementing purchased packages in complex environments.
6.3.3.1.7. The Continuum of Organizational Forms
|
Note
|
The following discussion and accompanying set of diagrams is derived from Preston Smith and Don Reinertsen’s thought regarding this problem in Developing Products in Half the Time [264] and Managing the Design Factory [229]. Similar discussions are found in the Guide to the Project Management Body of Knowledge [223] and Abbott and Fisher’s The Art of Scalability [4]. |
There is a spectrum of alternatives in structuring organizations for flow across functional concerns. First, a lightweight “matrix” project structure may be implemented, in which the project manager has limited power to influence the activity-based work, where people sit, etc. (see Figure 105, “Lightweight Project Management Across Functions”).
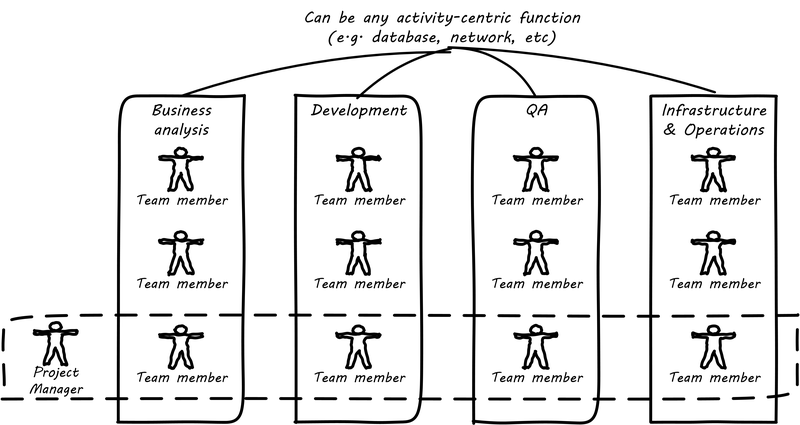
Work flows across the functions, perhaps called "centers of excellence”, and there may be contention for resources within each center. Often, simple “first in, first out” queuing approaches are used to manage the ticketed work , rather than more sophisticated approaches such as cost of delay. It is the above model that Reinertsen was thinking of when he said: “The danger in using specialists lies in their low involvement in individual projects and the multitude of tasks competing for their time.” Traditional I&O organizations, when they implemented defined Service Catalogs, can be seen as attempting this model. (More on this in the discussion of ITIL and shared services.)
Second, a heavyweight project structure may specify much more, including dedicated time assignment, modes of work, standards, and so forth (see Figure 106, “Heavyweight Project Management Across Functions”). The vertical functional manager may be little more than a resource manager, but does still have reporting authority over the team member and crucially still writes their annual performance evaluation (if the organization still uses those). This has been the most frequent operating model in the traditional CIO organization.
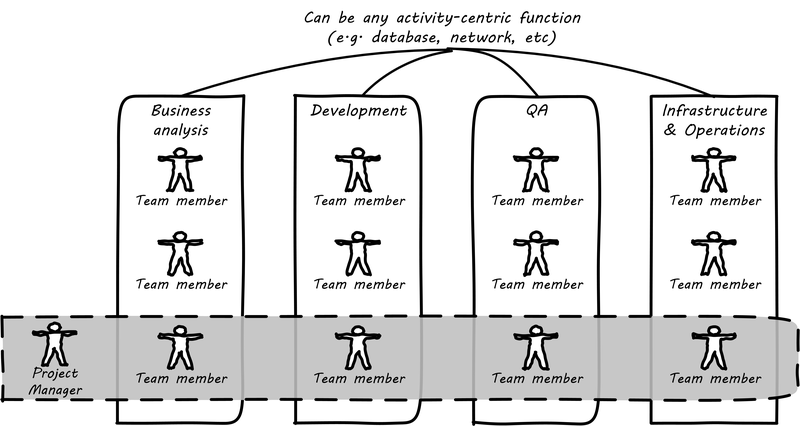
If even more focus is needed — the now-minimized influence of the functional areas is still deemed too strong — the organization may move to completely product-based reporting (see Figure 107, “Product Team, Virtual Functions”). With this, the team member reports to the product owner. There may still be communities of interest (Spotify guilds and tribes are good examples) and there still may be standards for technical choices.
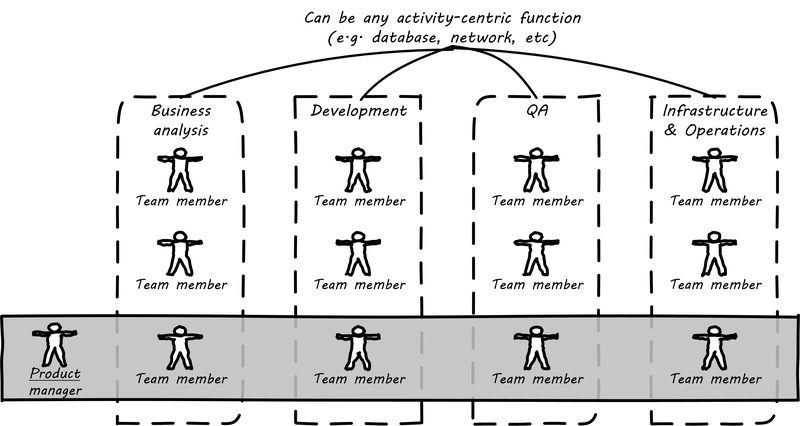
Finally, in the skunkworks model, all functional influence is deliberately blocked, as distracting or destructive to the product team’s success (see Figure 108, “Skunkworks Model”).
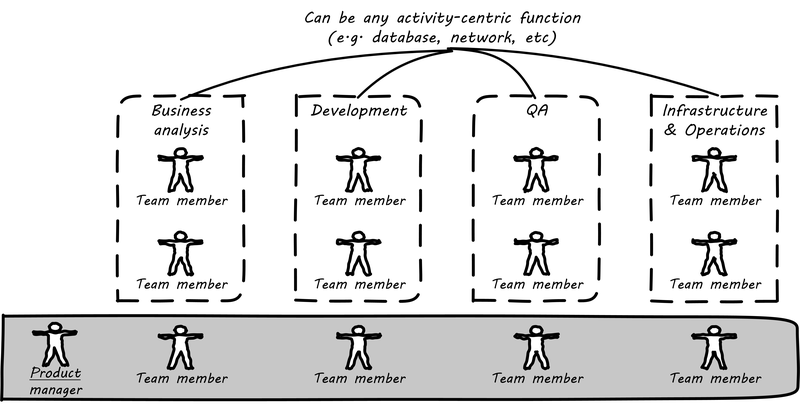
The product team has complete autonomy and can move at great speed. It is also free to:
-
Re-invent the wheel, developing new solutions to old and well-understood problems
-
Bring in new components on a whim (regardless of whether they are truly necessary) adding to sourcing and long-term support complexity
-
Ignore safety and security standards, resulting in risk and expensive retrofits
Early e-commerce sites were often set up as skunkworks to keep the interference of the traditional CIO to a minimum, and this was arguably necessary. However, ultimately, skunkworks is not scalable. Research by the Corporate Executive Board suggests that: “Once more than about 15% of projects go through the fast [skunkworks] team, productivity starts to fall away dramatically.” It also causes issues with morale, as a two-tier organization starts to emerge with elite and non-elite segments [113].
Because of these issues, Don Reinertsen observes that: “Companies that experiment with autonomous teams learn their lessons, and conclude that the disadvantages are significant. Then they try to combine the advantages of the functional form with those of the autonomous team” [229].
The Agile movement is an important correction to dominant IT management approaches employing open-loop delivery across centralized functional centers of excellence. However, the ultimate extreme of the skunkworks approach cannot be the basis for organization across the enterprise. While functionally specialized organizations have their challenges, they do promote understanding and common standards for technical areas. In a product-centric organization, communities of interest or practice provide an important counterbalancing platform for coordination strategies to maintain common understandings.
6.3.3.1.8. Scaling the Product Organization
The functional organization scales well. Just keep hiring more Java programmers, or DBAs, or security engineers and assign them to projects as needed. However, scaling product organizations requires more thought. The most advanced thinking in this area is found in the work of Scrum authors such as Ken Schwaber, Mike Cohn, Craig Larman, and Roman Pichler. Scrum, as we have discussed, is a strict, prescriptive framework calling for self-managing teams with:
-
Product owner
-
Scrum master
-
Team member
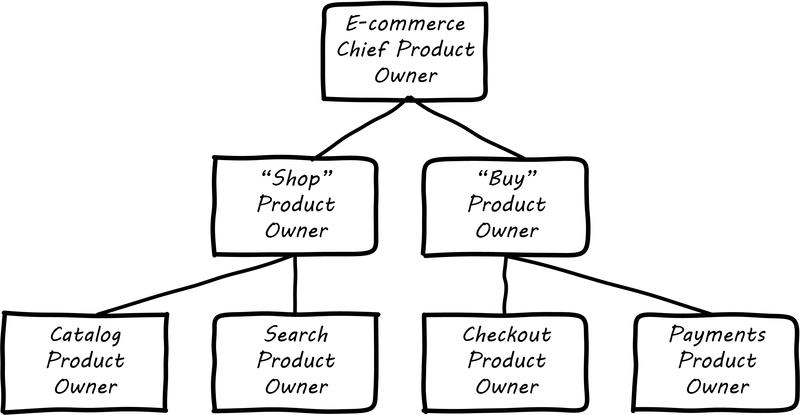
Let’s accept Scrum and the 2-pizza team as our organizing approach. A large-scale Scrum effort is based on multiple small teams; e.g., representing AKF scaling cube partitions (see Figure 109, “Product Owner Hierarchy”, similar to [219], p.12; [249]). If we want to minimize multi-tasking and context-switching, we need to ask: “How many product teams can a given product owner handle?”. In Agile Product Management with Scrum, Roman Pichler says: “My experience suggests that a product owner usually cannot look after more than two teams in a sustainable manner” [219 p. 12]. Scrum authors, therefore, suggest that larger-scale products be managed as aggregates of smaller teams. We will discuss how the product structure is defined in Section 6.3.2, “Investment and Portfolio”.
6.3.3.1.9. From Functions to Components to Shared Services
We have previously discussed feature versus component teams. As a reminder, features are functional aspects of software (things people find directly valuable) while components are how software is organized (e.g., shared services and platforms such as data management).
As an organization grows, we see both the feature and component sides scale. Feature teams start to diverge into multiple products, while component teams continue to grow in the guise of shared services and platforms. Their concerns continue to differentiate, and communication friction may start to emerge between the teams. How an organization handles this is critical.
In a world of digital products delivered as services, both feature and component teams may be the recipients of ongoing investment. An ongoing objection in discussions of Agile is: “We can’t put a specialist on every team!". This objection reflects the increasing depth of specialization seen in the evolving digital organization. Ultimately, it seems there are two alternatives to handling deep functional specialization in the modern digital organization:
-
Split it across teams
-
Turn it into an internal product
We have discussed the first option above (split the specialty across teams). But for the second option consider, for example, the traditional role of server engineer (a common infrastructure function). Such engineers historically have had a consultative, order-taking relationship to application teams:
-
An application team would identify a need for computing capacity (“we need four servers”)
-
The infrastructure engineers would get involved and provide recommendations on make, model, and capacity
-
Physical servers would be acquired, perhaps after some debate and further approval cycles
Such processes might take months to complete, and often caused dissatisfaction. With the rise of cloud computing, however, we see the transition from a consultative, order-taking model to an automated, always-on, self-service model. Infrastructure organizations move their activities from consulting on particular applications to designing and sustaining the shared, self-service platform. At that point, are they a function or a product?
6.3.3.1.10. Final Thoughts on Organization Forms
Formal organizational structures determine, to a great extent, how work gets done. But enterprise value requires that organizational units — whether product or functional — collaborate and coordinate effectively. Communications structures and interfaces, as covered in Section 6.3.1, “Coordination and Process”, are therefore an essential part of organizational design.
And of course, an empty structure is meaningless. You need to fill it with real people, which brings us to the topic of human resource management in the digital organization.
Evidence of Notability
Debates over organizational form are frequent of late. The years between 2010 and 2020 have seen a massive shift in many IT and digital organizations, from a focus on deep functional specialization to broader, cross-functional teams. Best practices and lessons at this writing are still unformed. Works such as Narayam’s Agile Organization Design [207] as well as coverage of the topic in other literature and industry guidance provide evidence of notability.
Limitations
Organization design influences, but does not completely determine, organizational results.
Related Topics
6.3.3.2. IT Human Resources Management
Description
Now that you have decided, for now, on an organization structure, you need to put people into it. As you scale, hiring people (like managing money) becomes a practice requiring formalization, and you will doubtless need to hire your first human resources professional soon, in order to stay compliant with applicable laws and regulations.
6.3.3.2.1. Basic Concerns
Human resources management can also be termed "people management”. It is distinct from supply chain and technology management, being concerned with the identification and recruitment, onboarding, ongoing development of, and eventual exit of individuals from an organization. This brief section covers the topic as it relates to digital management, incorporating recent cases and perspectives.
6.3.3.2.2. Hiring
Here is a typical hiring process:
-
Solicit candidates, through various channels such as job boards and recruiters
-
Review resumes and narrow candidate pool down for phone interviews
-
Conduct phone interviews and narrow candidate pool down for in-person interviews
-
Conduct in-person interviews, identify candidates for offers
-
Make offer, negotiate to acceptance
-
Hire and onboard
Your organization has been hiring people for some time now. It has always been one of your most important decisions, but you have reached the point where a more formal and explicit understanding of how you do this is essential.
First, why do you hire new staff? How and when do you perceive a need? It is well established that increasing the size of a team can slow it down. Legendary software engineer Fred Brooks, in his work The Mythical Man Month, identified the pattern that “adding more people to a late project makes it later” [43].
Are you adding people because of a perceived need for specialist skills? While this will always be a reason for new hires, many argue in favor of “T-shaped” people — people who are deep in one skill, and broad in others. Hiring new staff has an impact on culture — is it better to train from within, or source externally?
Second, how are you hiring staff? In a traditional, functionally specialized model, someone in a human resources organization acts as an intermediary between the hiring manager, and the job applicant (sometimes with a recruiter also in the mix between the company and the applicant). Detailed job descriptions are developed, and applicants not explicitly matching the selection criteria (e.g., in their resume) are not invited for an interview.
Such practices do not necessarily result in good outcomes. Applicants routinely tailor resumes to the job description. In some cases, they have been known to copy the job description into invisible sections of their resume so that they are guaranteed a “match” if automated resume-scanning software is used.
A compelling case study of the limitations of traditional human resources-driven hiring is discussed by Robert Sutton and Huggy Rao in Scaling up Excellence: Getting to More without Settling for Less [274]. The authors describe the company Lotus Software, one of the pioneers of early desktop computing.
With [company founder] Kapor’s permission, [head of organizational development] Klein pulled together the resumes of the first 40 Lotus employees … [and] submitted all 40 resumes to the Lotus human resources department. Not one of the 40 applicants, including Kapor, was invited for a job interview. The founders had built a world that rejected people like them.
Sean Landis, author of Agile Hiring [2], believes that: “accepted hiring wisdom is not very effective when applied to software professionals”. He further states that:
-
Very few companies hire well
-
Individuals with deep domain knowledge are in the best position to perform great hiring
-
Companies often focus on the wrong candidates
-
It is important to track metrics on the cost and effectiveness of hiring practices
In short, hiring is one of the most important decisions the digital enterprise makes, and it cannot be reduced to a simple process to be executed mechanically. Requiring senior technical talent to interview candidates may result in improved hiring decisions. However, such requirements add to the overall work demands placed on these individuals.
Finally, it is important to understand the costs of a bad hire. One risk is hiring "toxic" individuals who do not work well with others, degrade team morale, and even drive good employees to leave. Recent research by Michael Housman and Dylan Minor suggests that while the benefit from hiring a highly qualified “superstar” worker at most is $5,303, the cost of hiring a “toxic” worker (one destructive of morale and team norms) averages $12,489 — certainly a risk to consider [132].
6.3.3.2.3. Process as Skill
Sometimes new employees come in expecting that you are following certain processes. This is in part because “process” experience can be an important part of an employee’s career background. A skilled human resources manager may consider their experience with large-scale enterprise hiring processes to be a major part of their qualifications for a position in your company.
This applies to both “business” and “IT” processes. In fact, in the digital world, there is no real difference. Digital processes:
-
Initiate new systems, from idea to construction
-
Publicize and grant access to the new systems
-
Capture revenue from the systems
-
Support people in their interactions with the systems
-
Fix the systems when they break
-
Improve the systems based on stakeholder feedback
It is not clear which of these are “IT” versus “business” processes. But they are definitely processes. Some of them are more predictable, some less so, but they all represent some form of ordered work that is repeatable to some degree. And to some extent, you may be seeking people with experience defined at least in part by their exposure to processes.
6.3.3.2.4. Education and Training
Human resources departments are frequently responsible for education and training. Sometimes, employees take trainings and then through some form of examination or other proof, achieve a "certification" which can further their career. ITIL and PMBOK have been well-known IT certifications offered to individuals.
More recently, organizations have embraced a "dojo" approach; immersive environments where entire teams are trained [251]. Such approaches focus more on learning by doing, as opposed to passing multiple-choice tests (the basis of basic ITIL and PMBOK certification).
6.3.3.2.5. Allocation and Tracking People’s Time
When a new hire enters your organization, they enter a complex system that will structure and direct their daily activities through a myriad of means. The various means that direct their action include:
-
Team assignment (e.g., to an ongoing product)
-
Project assignment
-
Process responsibilities
Notice again the appearance of the "3 Ps".
Product, project, and process become challenging when they are all allowed to generate demand on individuals independently of each other. In the worst-case scenario, the same individual winds up with:
-
Collaborative team responsibilities
-
“Fractional” allocation to one or more projects
-
Ticketed process responsibilities
|
Note
|
Fractional allocation is the practice of funding individuals through assigning them at some % to a project. For example, a server engineer might be allocated 25% time to a project for six months to define its infrastructure architecture, while being assigned 30% to another project to refresh obsolete infrastructure. |
When demand is un-coordinated, these multiple channels can result in multi-tasking and dramatic overburden and, in the worst case, the individual becomes the constraint to enterprise value. Project managers expect deliverables on time, and too often have no visibility to operational concerns (e.g., outages) that may affect the ability of staff to deliver. Ad hoc requests “smaller than a project, bigger than a ticket” further complicate matters.
The Phoenix Project presents an effective and realistic dramatization of the resulting challenges. Work is entering the system through multiple channels, and the overburden on key individuals (such as Brent, the lead systems engineer) has reached crisis proportions. Through a variety of mechanisms, they take control of the demand channels and greatly improve the organization’s success. One of the most important lessons is well articulated by Erik, the mentor:
“Your job as VP of IT Operations is to ensure the fast, predictable, and uninterrupted flow of planned work that delivers value to the business while minimizing the impact and disruption of unplanned work, so you can provide stable, predictable, and secure IT service … You must figure out how to control the release of work into IT Operations and, more importantly, ensure that your most constrained resources are doing only the work that serves the goal of the entire system, not just one silo. [165 p. 91+]+
In order to understand the work, measuring the consumption of people’s time is important. There are various time-tracking approaches:
-
Simple allocation of staff payroll to product or organizational line
-
Project management systems (sometimes these are used for weekly time tracking, even for staff that are not assigned to projects — in such cases, placeholder operational projects are created)
-
Human resources management systems
-
Ticketing/workflow systems — advanced systems, such as those found in the Professional Services Automation sector, track time when tickets are in an “open” status
-
Backlog management systems (that may seem similar to ticketing systems)
-
Home-built systems
There is little industry consensus on best practices here. There are reasonable concerns about the burden of time tracking on employees, and poor data quality resulting from employees attempting to “code” activities when summarizing their time on a weekly or bi-weekly basis.
6.3.3.2.6. Accountability and Performance
Regardless of whether the company is a modern digital enterprise or more traditional in its approach, the commitment, performance, and results of employees is a critical concern. The traditional approach to managing this has been an annual review cycle, resulting in a performance ranking from 1 to 5:
-
Did not meet expectations
-
Partially met expectations
-
Met expectations
-
Exceeded expectation
-
Significantly exceeded expectations
This annual rating determines the employee’s compensation and career prospects in the organization. Some companies, notably GE and Microsoft, have attempted “stack rankings” in which the “bottom” 10% (or more) performers must be terminated. As the Davis and Daniels quote above indicates, such practices are terribly destructive of psychological safety and therefore team cohesion. High-profile practitioners are therefore moving away from this practice [45], [213].
The traditional annual review is a large “batch” of feedback to the employee, and therefore ineffective in terms of systems theory, not much better than an open-loop approach. Because of the weaknesses of such slow feedback (not to mention the large annual costs, expensive infrastructure, and opportunity costs of the time spent), companies are experimenting with other approaches.
Deloitte Consulting, as reported in the Harvard Business Review [46], realized that its annual performance review process was consuming two million hours of time annually, and yet was not delivering the needed value. In particular, ratings were suffering from the measurable flaw that they tended to reveal more about the person doing the rating, than the person being rated!
They started by redefining the goals of the performance management system to identify and reward performance accurately, as well as further fueling improvements.
A new approach with greater statistical validity was implemented, based on four key questions:
-
Given what I know of this person’s performance, and if it were my money, I would award this person the highest possible compensation increase and bonus
-
Given what I know of this person’s performance, I would always want him or her on my team
-
This person is at risk for low performance
-
This person is ready for promotion today
In terms of the frequency of performance check-ins, they note:
… the best team leaders … conduct regular check-ins with each team member about near-term work … to set expectations for the upcoming week, review priorities, comment on recent work and provide course correction, coaching, or important new information … If a leader checks in less often than once a week, the team member’s priorities may become vague … the conversation will shift from coaching for near-term work to giving feedback about past performance … If you want people to talk about how to do their best work in the near future, they need to talk often …
Sutton and Rao, in Scaling up Excellence, discuss the similar case of Adobe. At Adobe: “annual reviews required 80,000 hours of time from the 2,000 managers at Adobe each year, the equivalent of 40 full-time employees. After all that effort, internal surveys revealed that employees felt less inspired and motivated afterwards — and turnover increased”. Because of such costs and poor results, Adobe scrapped the entire performance management system in favor of a “check-in” approach. In this approach, managers are expected to have regular conversations about performance with employees and are given much more say in salaries and merit increases. The managers themselves are evaluated through random “pulse surveys” that measure how well each manager “sets expectations, gives and receives feedback, and helps people with their growth and development” [274 p. 113].
Whether incentives (e.g., pay raises) should be awarded individually or on a team basis is an ongoing topic of discussion in the industry. Results often derive from team performance, and the contributions of any one individual can be difficult to identify. Because of this, Scrum pioneer Ken Schwaber argues that: “the majority of the enterprise’s bonus and incentive funds need to be allocated based on the team’s performance rather than the individual’s performance” [249 p. 6]. However, this runs into another problem: that of the “free-rider”. What do we do about team members who do not pull their weight? Even in self-organizing teams, confronting someone about their behavior is not something people do willingly, or well.
Ideally, teams will self-police, but this becomes less effective with scale. In one case study in the Harvard Business Review, Continental Airlines found that the free rider problem was less of a concern when metrics were clearly correlated with team activity. In their case, the efforts and cooperation of gate teams had a significant influence on On-Time Arrival and Departure metrics, which could then be used as the basis for incentives [168].
Ultimately, both individuals and teams need coaching and direction. Team-level management and incentives must still be supplemented with some feedback loops centering on the individual. Perhaps this feedback is not compensation-based, but the organization must still identify individuals with leadership potential and deal with free riders and toxic individuals.
Observed behaviors are a useful focus. Sean Landis describes the difference between behaviors and skills as follows:
Two things make good leaders: behaviors and skills. If you focus on behaviors in your hiring of developers, they will be predisposed for leadership success. The hired candidate may walk in the door with the skills necessary to lead or not. If not, skills are easy to acquire through training and mentoring. People can acquire or modify behaviors, but it is much harder than skill development. Hire for behaviors and train the leadership skills. [2+]+
He further provides many examples of behaviors, such as:
-
Adaptable
-
Accountable
-
Initiative-taker
-
Optimistic
-
Relational
Evidence of Notability
Many executives and military leaders have identified the central importance of hiring decisions. In large, complex organizations, choosing the right people is the most powerful lever a leader has to drive organizational performance. The organizational context these new hires find themselves in will profoundly affect them and the results of their efforts.
Limitations
Hiring the right individuals will not lead to organizational success if other aspects of the operating model are ineffective; e.g., demand and execution management that encourage too much work-in-process.
Related Topics
6.3.3.3. Why Culture Matters
Description
“Culture” is a difficult term to define, and even more difficult to characterize across large organizations. It starts with how an organization is formally structured, because structure is, in part, a set of expectations around how information flows. “Who talks to who, when and why” is in a sense culture. Culture can also be seen embedded in artifacts like processes and formally specified operating models.
But “culture” has additional, less tangible meanings. The anecdotes executives choose to repeat are culture. Whether an organization tacitly condones being five minutes late for meetings (because walk time in large facilities is expected) or has little tolerance for this (because most people dial in) is culture. The degree of deference shown to senior executives, and their opinions, is culture. Whether a junior person dares to hit “reply-all” on an email including her boss’s boss is culture. Organizational tolerance for competitive or toxic behavior is culture.
Culture cannot be directly changed — it is better seen as a lagging indicator, that changes in response to specific practical interventions. Even tools and processes can change the culture, if they are judiciously chosen (most tools and processes do not have this effect). Skeptical? Consider the impact that computers — a tool — have had on culture. Or email.
We have already touched on culture in the Section 6.2.1, “Product Management” discussion of team formation. These themes of psychological safety, equal collaboration, emotional awareness, and diversity inform our further discussions. We will look at culture from a few additional perspectives in this section:
-
Motivation
-
Schneider matrix
-
The Westrum typology
-
Mike Rother’s research into Toyota’s improvement and coaching “katas”
6.3.3.3.1. Motivation
One of the most important reasons to be concerned about culture is its effect on motivation. There is little doubt that a more motivated team performs better than an unmotivated, “going through the motions” organization. But what motivates people?
One of the oldest discussions of culture is Douglas McGregor’s idea of “Theory X” versus “Theory Y” organizations, which he developed in the 1960s at the Massachusetts Institute of Technology.
“Theory X” organizations rely on extrinsic motivators and operate on the assumption that workers must be cajoled and punished in order to produce results. We see Theory X approaches when organizations focus on pay scales, bonuses, titles, awards, writeups/demerits, performance appraisals, and the like.
Theory Y organizations operate on the assumption that most people seek meaningful work intrinsically and that they have the ability to solve problems in creative ways that do not require tight standardization. According to Theory Y, people can be trusted and should be treated as mature individuals, in contrast to the distrust inherent in Theory X.
Related to Theory Y, in terms of intrinsic motivation, Daniel Pink, the author of Drive, suggests that three concepts are key: autonomy, mastery, and purpose. If these three qualities are experienced by individuals and teams, they will be more likely to feel motivated and collaborate more effectively.
6.3.3.3.2. Schneider and Westrum
One model for understanding culture is the matrix proposed by William Schneider (see Figure 110, “Schneider Matrix”, similar to [248]).
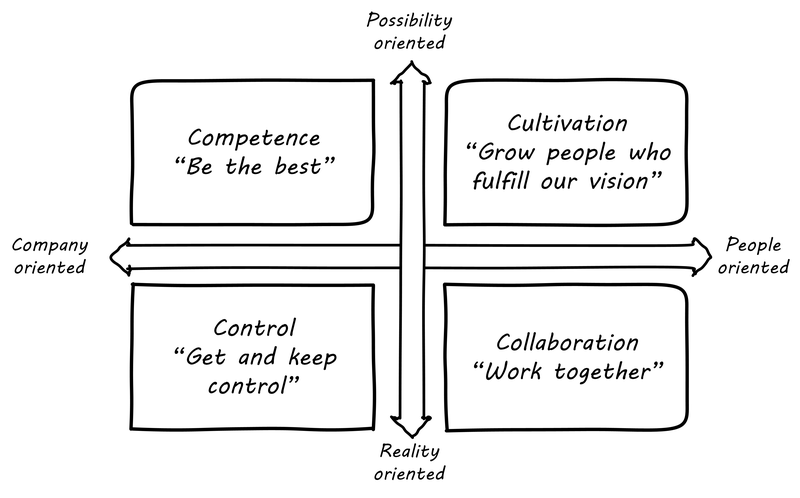
Two dimensions are proposed:
-
The extent to which the culture is focused on the company or the individual
-
The extent to which the company is “possibility-oriented” versus “reality-oriented”
This is not a neutral matrix. It is not clear that highly controlling cultures are ever truly effective. Even in the military, which is generally assumed to be the ultimate “command and control” culture, there are notable case studies of increased performance when more empowering approaches were encouraged.
For example, military commanders realized as long ago as the Napoleonic wars that denying soldiers and commanders autonomy in the field was a good way to lose battles. Even in peacetime operations, forward-thinking military commanders continue to focus on “what, not how”.
In Turn the Ship Around: A True Story of Turning Followers into Leaders, Captain L. David Marquette discusses moving from a command-driven to an outcome-driven model, and the beneficial results it had on the USS Santa Fe [189]. Similar themes appear in Captain D. Michael Abrashoff’s It’s Your Ship: Management Techniques from the Best Damn Ship in the Navy [5].
Neither of these accounts is surprising when we consider the more sophisticated aspects of military doctrine. Don Reinertsen provides a rigorous overview in Chapter 9 of Principles of Product Development Flow. In this discussion, he notes that the military has been experimenting with centralized versus decentralized control for centuries. Modern warfighting relies on autonomous, self-directed teams that may be out of touch with central command and required to improvise effectively to achieve the mission. Therefore, military orders are incomplete without a statement of “commander’s intent” — the ultimate outcome of the mission [230], pp.243-265. Military leaders are also concerned with pathological "toxic command” which is just as destructive in the military as anywhere else [293].
Similar to the Schneider matrix is the Westrum typology, which proposes that there are three major types of culture:
-
Pathological
-
Bureaucratic
-
Generative
The cultural types exhibit the following behaviors:
| Pathological (Power-oriented) | Bureaucratic (Rule-oriented) | Generative (Performance-oriented) |
|---|---|---|
Low cooperation |
Modest cooperation |
High cooperation |
Messengers (of bad news) shot |
Messengers neglected |
Messengers trained |
Failure is punished |
Failure leads to justice |
Failure leads to inquiry |
(Excerpted from [224].)
The State of DevOps research has demonstrated a correlation between generative cultures and digital business effectiveness [224], [44]. Notice also the relationship to blameless postmortems discussed in Section 6.2.3, “Operations Management”.
6.3.3.3.3. State of DevOps Survey Research
6.3.3.3.4. Toyota Kata
Academics and consultants have been studying Toyota for many years. The performance and influence of the Japanese automaker are legendary, but it has been difficult to understand why. Much has been written about Toyota’s use of particular tools, such as Kanban bins and Andon boards. However, Toyota views these as ephemeral adaptations to the demands of its business.
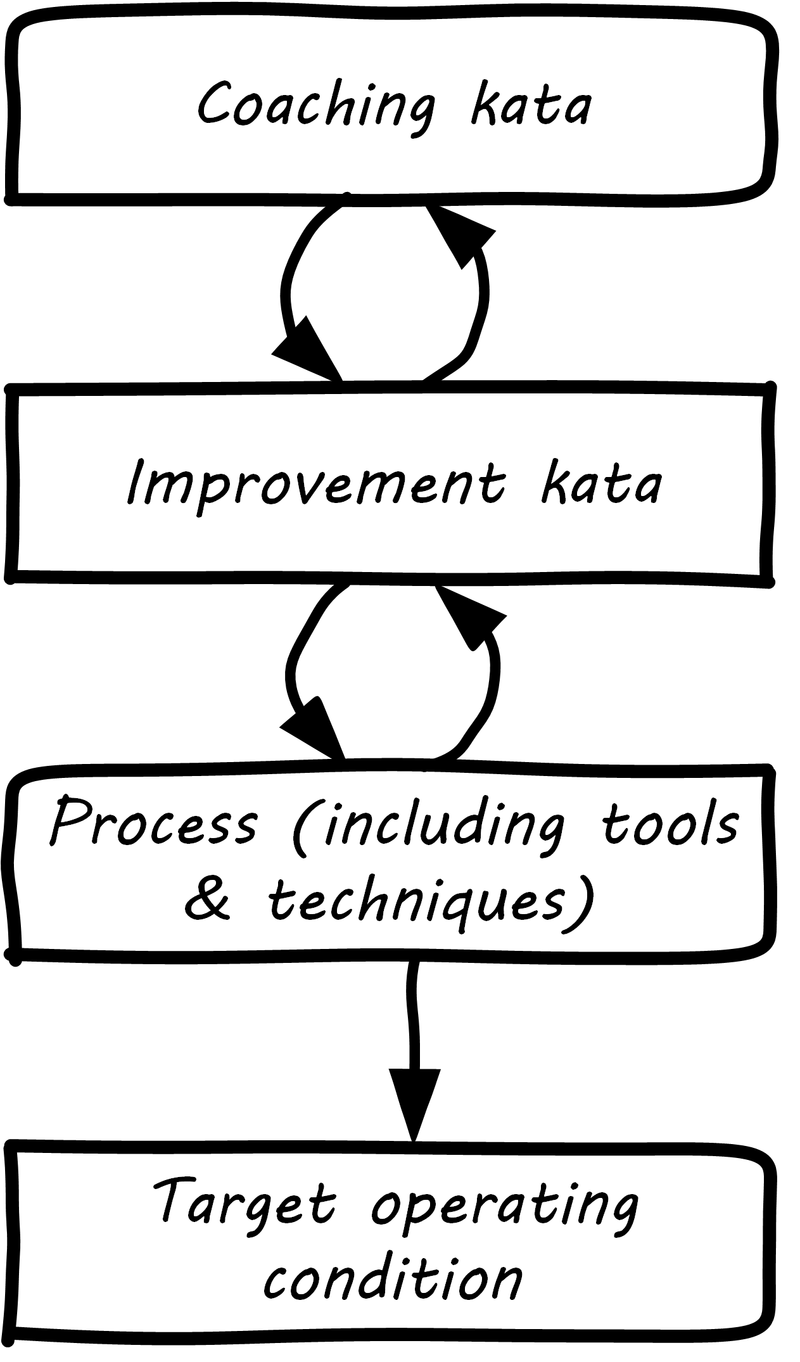
According to Mike Rother in Toyota Kata [238], underlying Toyota’s particular tools and techniques are two powerful practices:
-
The improvement kata
-
The coaching kata
What is a kata? It is a Japanese word stemming from the martial arts, meaning pattern, routine, or drill. More deeply, it means “a way of keeping two things in alignment with each other”. The improvement kata is the repeated process by which Toyota managers investigate and resolve problems, in a hands-on, fact-based, and preconception-free manner, and improve processes towards a “target operating condition”. The coaching kata is how the improvement kata is instilled in new generations of Toyota managers (see Figure 111, “Toyota Kata”, similar to [238]).
As Rother describes it, the coaching and improvement katas establish and reinforce a coherent culture or mental model of how goals are achieved and problems approached. It is understood that human judgment is not accurate or impartial. The method compensates with a teaching-by-example focus on seeking facts without preconceived notions, through direct, hands-on investigation and experimental approaches.
This is not something that can be formalized into a simple checklist or process; it requires many guided examples and applications before the approach becomes ingrained in the upcoming manager.
Evidence of Notability
Culture quickly emerged as one of the key concerns of the DevOps community. Google’s research into psychological safety is a concrete validation of its importance and notability.
Limitations
Culture is both intangible and a lagging indicator. Culture cannot be changed through exhortations to "be more collaborative" and so forth. However, organizational priorities that are perceived to be real - as in reinforced by performance objectives - can change culture. Work practices (including even the use of certain technologies) can and do change culture. (Skeptical? Think about how email changed work culture, for better and worse.)
Related Topics
6.3.3.4. Industry Frameworks
Description
This culminating section consists of a critical examination of the IT management frameworks, which can be seen as structured approaches to many concerns discussed in Context III: coordination, processes, investment management, projects, and organizational structures.
Industry frameworks and bodies of knowledge play a powerful role in shaping organizational structures and their communication interfaces, and creating a base of people with consistent skills to fill the resulting roles. While there is much of value in the frameworks, they may lead you into the planning fallacy or defined process traps. Too often, they assume that variation is the enemy, and they do not provide enough support for the alternative approach of empirical process control. At the time of publication, the frameworks are challenged on many fronts by Agile, Lean, and DevOps approaches.
6.3.3.4.1. Defining Frameworks
|
Note
|
There are other usages of the term “framework”, especially in terms of software frameworks. Process and management frameworks are non-technical. |
So, what is a “framework”? The term “framework”, in the context of a business process, is used for comprehensive and systematic representations of the concerns of a professional practice. In general, an industry framework is a structured artifact that seeks to articulate a professional consensus regarding a domain of practice. The intent is usually that the guidance be mutually-exclusive and collectively exhaustive within the domain so that persons knowledgeable in the framework have a broad understanding of domain concerns.
The first goal of any framework, for a given conceptual space, is to provide a “map” of its components and their relationships. Doing this serves a variety of goals:
-
Develop and support professional consensus in the business area
-
Support training and orientation of professionals new to the area (or its finer points)
-
Support governance and control activities related to the area (more on this in Section 6.4.1, “Governance, Risk, Security, and Compliance”)
Many frameworks have emerged in the IT space, with broader and narrower domains of concern. Some are owned by non-profit standards bodies; others are commercial. We will focus on five in this document. In roughly chronological order, they are:
|
Note
|
Both ITIL and COBIT have recently released new versions (COBIT 2019, ITIL 4) which respond in some measure to these challenges noted above. However, since much of the current industry practice still reflects earlier versions, the discussion here will remain for the forseeable future. |
6.3.3.4.2. Observations on the Frameworks
In terms of the new digital delivery approaches, there are a number of issues and concerns with the frameworks:
-
The misuse of statistical process control
-
Local optimization temptation
-
Lack of execution model
-
Proliferation of secondary artifacts, compounded by batch-orientation
-
Confusion of process definition
Some frameworks, notably the original Capability Maturity Model (CMM), emphasize statistical process control. However, as we discussed in the previous section, process control theorists see creative, knowledge-intensive processes as requiring empirical control. Statistical process control applied to software has therefore been criticized as inappropriate [226].
In CMM terms, empirical process control starts by measuring and immediately optimizing (adjusting). As Martin Fowler notes: “a process can still be controlled even if it can’t be defined" [250]. They need not - and cannot - be fully defined. Therefore, it is highly questionable to assume that process optimization is something only done at the highest levels of maturity.
This runs against much current thinking and practice, especially that deriving from Lean philosophy, in which processes are seen as always under improvement. (See discussion of Toyota Kata.) All definition, measurement, and control must serve that end.
PMBOK suggests that “control charts may also be used to monitor cost and schedule variances, volume, and frequency of scope changes, or other management results to help determine if the project management processes are in control” [223 pp. 4108-4109]. This also contradicts the insights of empirical process control, unless the project was also a fully defined process - unlikely from a process control perspective.
IT capability frameworks can be harmful if they lead to fragmentation of improvement effort and lack of focus on the flow of IT value.
The digital delivery system at scale is a complex socio-technical system, including people, process, and technology. Frameworks help in understanding it, by breaking it down into component parts in various ways. This is all well and good, but the danger of reductionism emerges.
|
Note
|
There are various definitions of "reductionism”. This discussion reflects one of the more basic versions. |
A reductionist view implies that a system is nothing but the sum of its parts. Therefore, if each of the parts is attended to, the system will also function well.
This can lead to a compulsive desire to do “all” of a framework. If ITIL v2011 calls for 25 processes, then a large, mature organization by definition should be good at all of them. But the 25 processes (and dozens more sub-processes and activities) called for by ITIL v2011 [8], or the 32 called for in COBIT 5, are somewhat arbitrary divisions. They overlap with each other. Furthermore, there are many digital organizations that do not use a full framework-based process portfolio and yet deliver value as well as organizations that do use the frameworks to a greater degree.
The temptation for local, process-level optimization runs counter to core principles of Lean and systems thinking. Many management thinkers, including W. Edwards Deming, Eli Goldratt, and others have emphasized the dangers of local optimization and the need for taking a systems view.
As this document’s structure suggests, the delivering of IT value requires different approaches at different scales. There is recognition of this among framework practitioners; however, the frameworks themselves provide insufficient guidance on how they scale up and down.
It is also questionable whether even the largest actual IT organizations on the planet could fully implement the full scope of the process-based frameworks. Specifying too many interacting processes has its own complications. Consider: Both ITIL 2011 and COBIT devote considerable time to documenting possible process inputs and outputs. As a part of every process definition, ITIL 2011 had a section entitled “triggers, inputs, outputs, and interfaces”. The “Service-Level Management Process” [281 pp. 120-122], for example, lists:
-
7 triggers (e.g., “service breaches”)
-
10 inputs (e.g., “customer feedback”)
-
10 outputs (e.g., “reports on OLAs”)
-
7 interfaces (e.g., “supplier management”)
COBIT similarly details process inputs and outputs. In the Enabling Processes guidance, each management practice suggests inputs and outputs. For example, the APO08 process “Manage Relationships” has an activity of “Provide input to the continual improvement of services”, with:
-
6 inputs
-
2 outputs
But processes do not run themselves. These process inputs and outputs require staff attention. They imply queues and therefore work-in-process, often invisible. They impose a demand on the system, and each hand-off represents transactional friction. Some hand-offs may be implemented within the context of an IT management suite; others may require procedural standards, which themselves need to be created and maintained. The industry currently lacks understanding of how feasible such fully elaborated frameworks are in terms of the time, effort, and organizational structure they imply.
We have discussed the issue of overburden previously. Too many organizations have contending execution models, where projects, processes, and miscellaneous work all compete for people’s attention. In such environments, the overburden and wasteful multi-tasking can reach crisis levels. With ITIL in particular, because it does not cover project management or architecture, we have a very large quantity of potential process interactions that is nevertheless incomplete. (It should be noted that ITIL 4 now terms its primary concerns "practices", not "processes" - this is a notable shift.)
The process hand-offs also imply that artifacts (documents of various sorts, models, software, etc.) are being created and transferred in between teams, or at least between roles on the same team with some degree of formality. Primary artifacts are executable software and any additional content intended directly for value delivery. Secondary artifacts are anything else.
An examination of the ITIL and COBIT process interactions shows that many of the artifacts are secondary concepts such as “plans”, “designs”, or “reports”:
-
Design specifications (high-level and detailed)
-
Operation and use plan
-
Performance reports
-
Action plans
-
Consideration and approval
and so on. (Note that actually executable artifacts; e.g., source code, are not included here.)
Again, artifacts do not create themselves. Dozens of artifacts are called for in the process frameworks. Every artifact implies:
-
Some template or known technique for performing it
-
People trained in its creation and interpretation
-
Some capability to store, version, and transmit it
Unstructured artifacts such as plans, designs, and reports, in particular, impose high cognitive load and are difficult to automate. As digital organizations automate their pipelines, it becomes essential to identify the key events and elements they may represent, so that they can be embedded into the automation layer.
Finally, even if a given process framework does not specifically call for waterfall, we can sometimes still see its legacy. For example:
-
Calls for thorough, “rigorous” project planning and estimation
-
Cautions against “cutting corners”
-
“Design specifications” moving through approval pipelines (and following a progression from general to detailed)
All of these tend to signal a large batch-orientation, even in frameworks making some claim of supporting Agile.
Good system design is a complex process. We introduced technical debt in Section 6.1.3, “Application Delivery”, and will revisit it in Section 6.4.3, “Architecture”. But the slow feedback signals resulting from the batch processes implied by some frameworks are unacceptable in current industry. This is in part why new approaches are being adopted.
One final issue with the “process” frameworks is that, while they use the word “process” prominently, they are not aligned with BPM best practices [30].
All of these frameworks provide useful descriptions of major ongoing capabilities and practices that the large IT organization must perform. But in terms of our preceding discussion on process method, they, in general, are developed from the perspective of steady-state functions, as opposed to a value stream or defined process perspective.
The BPM community is clear that processes are countable and event-driven (see [255]). Naming them with a strong, active verb is seen as essential. “True” IT processes, therefore, might include:
-
Accept Demand
-
Deliver Release
-
Complete Change
-
Resolve Incident
-
Improve Service
However, if reviewing ITIL, a BPM consultant would see the "process" called “Capacity Management” and observe that it is not countable or event-driven. “How many capacities did you do today?” is not a sensible question, for the most part.
Evidence of Notability
The major frameworks have had an enormous influence on digital and IT management. They drive many of the basic assumptions encountered in digital management and IT practices. Consultancies and training organizations monetize them; auditors assess organizations against their "best practices".
Limitations
Frameworks struggle to strike a balance between too extremes: being either too specific and prescriptive versus being too abstract and theoretical. In the digitally transforming economy, informed by Agile practices, they seem to specify simple cookbook recipes to increasingly dynamic and complex problems. Is this inherent to any framework? Can a new framework overcome these issues? That, in part, is the motivation for this document.
Related Topics
6.3.4. Context III Conclusion
Process management is a critical practice in business operations and will continue into the digital era. There are a variety of approaches, concerns, and techniques that must be considered and correctly applied.
Section 6.3.2, “Investment and Portfolio” considered the fundamentals of project and resource management, with some caution and with an understanding that not all work is performed through classical project management and its Iron Triangle of cost, quality, and scope.
Finally, Section 6.3.3, “Organization and Culture” discussed organizational structure and culture, and the importance of culture in organizational effectiveness.
Context III is essential preparation for Context IV — essentially, Context III is about management, where Context IV expands into governance and the longest-lived, largest-scale concerns for digital delivery.
6.3.4.1. Context III Architectural View
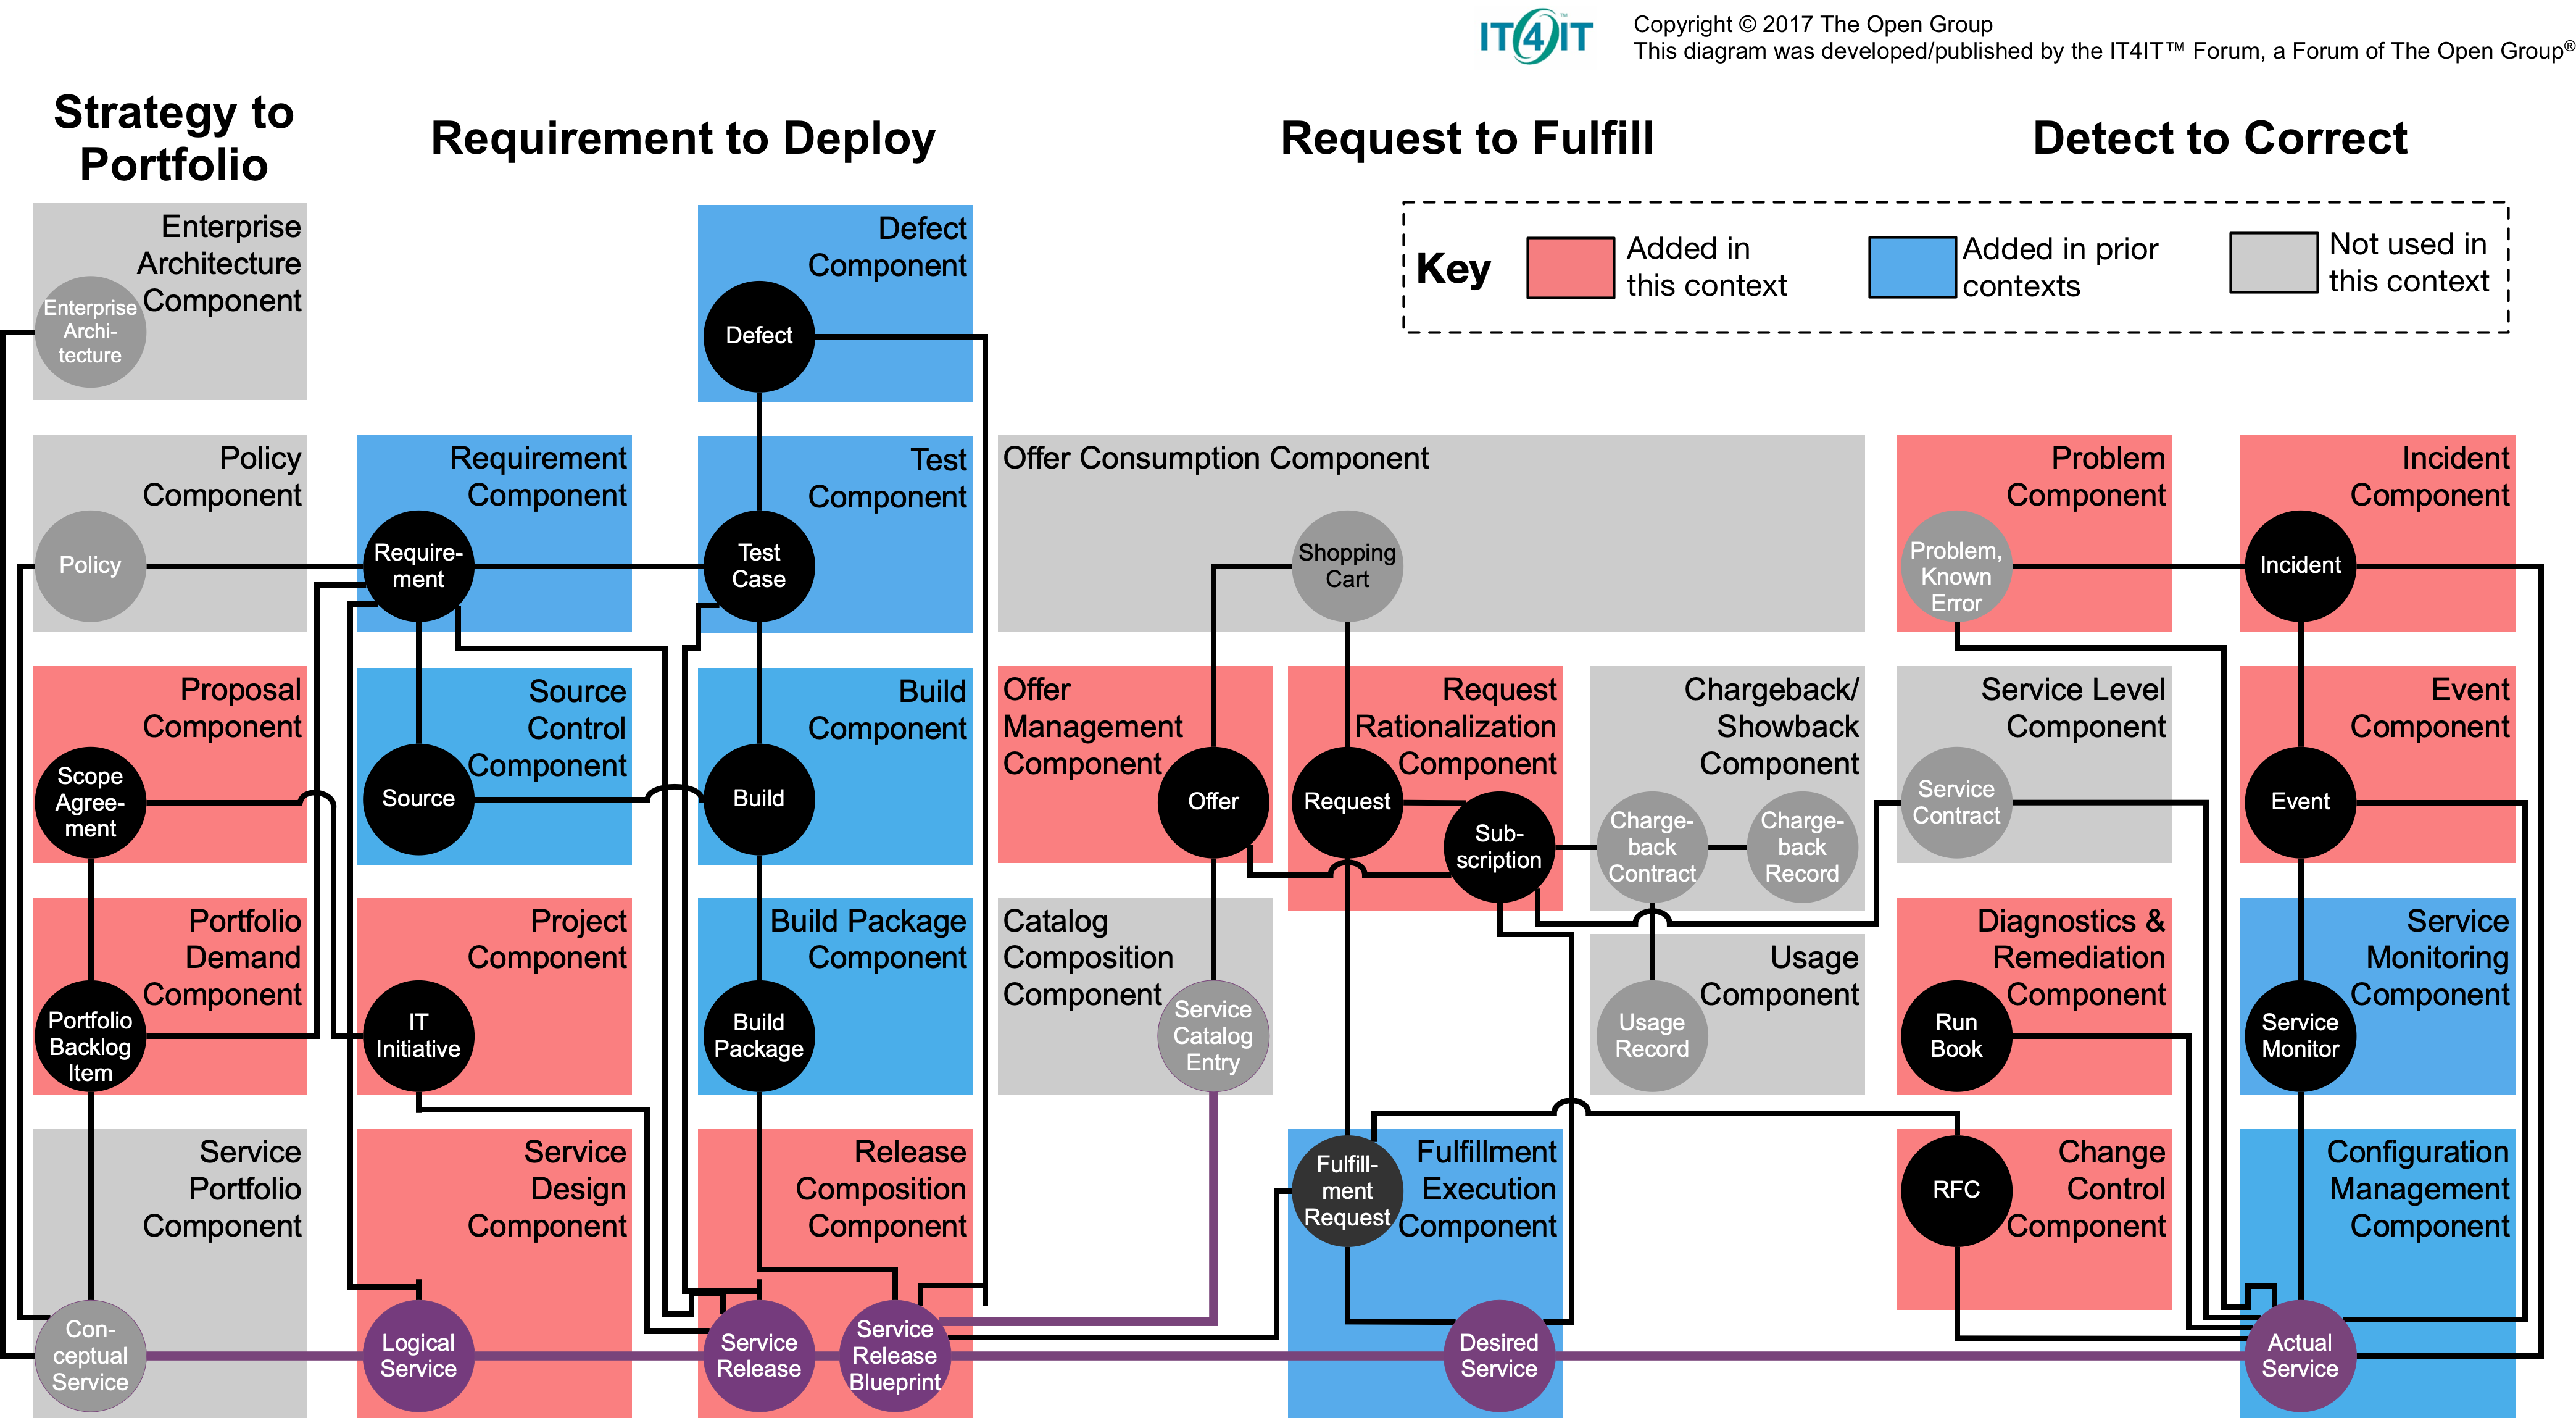
As the organization scales to multiple products and teams, new components are required for coordinating and managing investment, provisioning multiple services, and abstracting operational issues when product to team cardinality is not 1:1. Formal ITSM queue-based processes (incident, change, problem) emerge here as mechanisms for communicating, executing, and assessing risk across team boundaries. Suggested functional components include:
-
Proposal Component
-
Portfolio Demand Component
-
Project Component
-
Service Design Component
-
Release Composition Component
-
Offer Management Component
-
Request Rationalization Component
-
Problem Component
-
Diagnostics & Remediation Component
-
Change Control Component
-
Incident Component
-
Event Component
|
Note
|
The requirements for many of these components are discussed in Context II, but their appearance in Context III indicates the increasing formalization and automation required to support team of teams activities. |
Context III "Architectural View" Learning Objectives
-
Identify the IT4IT components suitable for Context III
Related Topics
6.4. Context IV: Enduring Enterprise
Context Description
In this context, we imagine that the practitioner is now running one of the larger and more complex IT-based operations on the planet, with an annual IT budget of hundreds of millions or billions of dollars. There are thousands of programmers, systems engineers, and IT managers, with a wide variety of responsibilities. IT is in your market-facing products and in your back-office operations. In fact, it is sometimes hard to distinguish the boundaries as your company transforms into a digital business.
Agile techniques remain important, but things are getting complex, and you are testing the boundaries of what is possible. How can we operate at this scale and still be Agile? Decisions made long ago come back to haunt, security threats are increasing, and, at this scale, there is no escaping the auditors.
The term "enterprise" does not necessarily imply any particular size, although it is often associated with larger-scale organizations. For the thought experiment here, at this stage the organization has scaled up to a relatively large size. However, what may be less obvious is that scaling up in size also means scaling out in terms of timeframes: concern for the past and the future extend further and further in each direction. Organizational history is an increasing factor, and the need to manage this knowledge base can’t be ignored. The organization is fulfilling responsibilities set in place by those no longer present, and is building product and signing service contracts to be fulfilled by those who will come after. Hence the qualifier "Enduring" is applied to Context IV.
Competency Area: Governance, Risk, Security, and Compliance
The practitioner needs to cope with new layers of enterprise organization, and external forces (regulators, vendor partners, security adversaries, auditors) increasingly defining their options. This Competency Area sets the frame for the section. Section 6.4.2, “Information Management” and Section 6.4.3, “Architecture” in many ways are further elaborations of two major domains of governance concerns.
Competency Area: Information Management
This document has been concerned with data, information, and knowledge since the earliest days of the digital journey. But at this scale, it must formalize its information management approaches and understandings; without that, it will never capture the full value available with modern analytics and Big Data.
Competency Area: Architecture
The digital organization must understand its big picture of interacting lifecycles, reduce technical debt and redundancy, and obtain better economies of scale. Architecture is a complex and challenging topic area, with multiple domains and value propositions, and its share of controversy.
|
Important
|
Context IV, like the other parts, needs to be understood as a unified whole. In reality, enterprises struggle with the issues in all three Competency Areas simultaneously. |
Context IV "Enduring Enterprise" High-Level Dimensions
-
Identify key drivers for operating at the largest scale
-
Identify the essential temporal dimension of Context IV
-
Identify the role of governance
-
Identify the role of information management
-
Identify the role of architecture
6.4.1. Governance, Risk, Security, and Compliance
Area Description
Operating at scale requires a different mindset. When the practitioner was starting out, the horizon seemed bounded only by imagination, will, and talent. At enterprise scale, it is a different world. The practitioner finds themselves constrained by indifferent forces and hostile adversaries, some of them competing fairly, and others seeking to attack by any means. Whether or not the organization is a for-profit, publicly traded company, it is now large enough that audits are required; it is also likely to have directors of some nature. The concept of “controls” has entered the practitioner’s awareness.
As a team of teams, the practitioner needs to understand resource management, finance, the basics of multiple product management and coordination, and cross-functional processes. At the enterprise level, they need also to consider questions of corporate governance. Stakeholders have become more numerous, and their demands have multiplied, so the well-established practice of establishing a governing body is applied.
Security threats increase proportionally to the company’s size. The talent and persistence of these adversaries are remarkable. Other challenging players are, on paper, “on the same side”, but auditors are never to be taken for granted. Why are they investigating IT systems? What are their motivations and responsibilities? Finally, what laws and regulations are relevant to IT?
|
Important
|
As with other Competency Areas in the later part of this document, we are going to some degree introduce this topic “on its own terms”. We will then add additional context and critique in subsequent sections. |
The organization has been concerned with security as a technical practice since your company started. Otherwise, you would not have gotten this big. But now, it has a Chief Information Security Officer, formal risk management processes, a standing director-level security steering committee, auditors, and compliance specialists. That kind of formalization does not usually happen until an organization grows to a certain size.
|
Note
|
More than any other Competency Area, the location of this material, and especially its Security subsection, draws attention. Again, any topic in any Competency Area may be a matter of concern at any stage in an organization’s evolution. Security technical practices were introduced in Context I. |
This document needed the content in Context III to get this far. It was critical to understand structure, how the organization was organizing our strategic investments, and how the organization is engaging in operational activities. In particular it is difficult for an organization to govern itself without some ability to define and execute processes, as processes often support governance controls and security protocols.
This Competency Area covers “Governance, Risk, Security, and Compliance” because there are clear relationships between these concerns. They have important dimensions of independence as well. It is interesting that Shon Harris' popular Guide to the CISSP® starts its discussion of security with a chapter titled “Information Security Governance and Risk Management”. Governance leads to a concern for risk, and security specializes in certain important classes of risk. Security requires grounding in governance and risk management.
Compliance is also related but again distinct, as is the concern for adherence to laws and regulations, and secondarily internal policy.
Competency Area 10 "Governance, Risk, Security, and Compliance" High-Level Dimensions
-
Define governance versus management
-
Describe key objectives of governance according to major frameworks
-
Define risk management and its components
-
Describe and distinguish assurance and audit, and describe their importance to digital operations
-
Discuss digital security concerns and practices
-
Identify common regulatory compliance issues
-
Describe how governance is retaining its core concerns while evolving in light of Digital Transformation
-
Describe automation techniques relevant to supporting governance objectives throughout the digital delivery pipeline
6.4.1.1. Governance
Description
6.4.1.1.1. What Is Governance?
The system by which organizations are directed and controlled.
To talk about governing digital or IT capabilities, we must talk about governance in general. Governance is a challenging and often misunderstood concept. First and foremost, it must be distinguished from “management”. This is not always easy but remains essential. The ISACA COBIT framework, across its various versions, has made a clear distinction between governance and management, which encompass different types of activities, organizational structures, and purposes. In most enterprises, governance is the responsibility of the Board of Directors under the leadership of the chairperson while management is the responsibility of the executive management under the leadership of the CEO.
Here is simple explanation of governance:
Suppose you own a small retail store. For years, you were the primary operator. You might have hired an occasional cashier, but that person had limited authority; they had the keys to the store and cash register, but not the safe combination, nor was their name on the bank account. They did not talk to your suppliers. They received an hourly wage, and you gave them direct and ongoing supervision.[9] In this case, you were a manager. Governance was not part of the relationship.
Now, you wish to go on an extended vacation — perhaps a cruise around the world, or a trek in the Himalayas. You need someone who can count the cash and deposit it, and place orders with and pay your suppliers. You need to hire a professional manager.
They will likely draw a salary, perhaps some percentage of your proceeds, and you will not supervise them in detail as you did the cashier. Instead, you will set overall guidance and expectations for the results they produce. How do you do this? And perhaps even more importantly, how do you trust this person?
Now, you need governance.
As we see in the above quote, one of the most firmly reinforced concepts in the COBIT guidance (more on this and ISACA in the next section) is the need to distinguish governance from management. Governance is by definition a Board-level concern. Management is the CEO’s concern. In this distinction, we can still see the shop owner and his or her delegate.
In political science and economics, the need for governance is seen as an example of the principal-agent problem [93]. Our shopkeeper example illustrates this. The hired manager is the “agent”, acting on behalf of the shop owner, who is the “principal”.
In principal-agent theory, the agent may have different interests than the principal. The agent also has much more information (think of the manager running the shop day-to-day, versus the owner off climbing mountains). The agent is in a position to do economic harm to the principal; to shirk duty, to steal, to take kickbacks from suppliers. Mitigating such conflicts of interest is a part of governance.
In larger organizations (such as you are now), it is not just a simple matter of one clear owner vesting power in one clear agent. The corporation may be publicly owned, or in the case of a non-profit, it may be seeking to represent a diffuse set of interests (e.g., environmental issues). In such cases, a group of individuals (directors) is formed, often termed a “Board”, with ultimate authority to speak for the organization.
The principal-agent problem can be seen at a smaller scale within the organization. Any manager encounters it to some degree, in specifying activities or outcomes for subordinates. But this does not mean that the manager is doing “governance”, as governance is by definition an organization-level concern.
The fundamental purpose of a Board of Directors and similar bodies is to take the side of the principal. This is easier said than done; Boards can become overly close to an organization’s senior management — the senior managers are real people, while the “principal” may be an amorphous, distant body of shareholders and/or stakeholders.
Because governance is the principal’s concern, and because the directors represent the principal, governance, including IT governance, is a Board-level concern.
There are various principles of corporate governance we will not go into here, such as shareholder rights, stakeholder interests, transparency, and so forth. However, as we turn to our focus on digital and IT-related governance, there are a few final insights from the principal-agent theory that are helpful to understanding governance. Consider:
the heart of principal-agent theory is the trade-off between (a) the cost of measuring behavior and (b) the cost of measuring outcomes and transferring risk to the agent. [93]
What does this mean? Suppose the shopkeeper tells the manager, “I will pay you a salary of $50,000 while I am gone, assuming you can show me you have faithfully executed your daily duties.”
The daily duties are specified in a number of checklists, and the manager is expected to fill these out daily and weekly, and for certain tasks, provide evidence they were performed (e.g., bank deposit slips, checks written to pay bills, photos of cleaning performed, etc.). That is a behavior-driven approach to governance. The manager need not worry if business falls off; they will get their money. The owner has a higher level of uncertainty; the manager might falsify records, or engage in poor customer service so that business is driven away. A fundamental conflict of interest is present; the owner wants their business sustained, while the manager just wants to put in the minimum effort to collect the $50,000. When agent responsibilities can be well specified in this manner, it is said they are highly programmable.
Now, consider the alternative. Instead of this very scripted set of expectations, the shopkeeper might tell the manager, “I will pay you 50% of the shop’s gross earnings, whatever they may be. I’ll leave you to follow my processes however you see fit. I expect no customer or vendor complaints when I get back.”
In this case, the manager’s behavior is more aligned with the owner’s goals. If they serve customers well, they will likely earn more. There are any number of hard-to-specify behaviors (less programmable) that might be highly beneficial.
For example, suppose the store manager learns of an upcoming street festival, a new one that the owner did not know of or plan for. If the agent is managed in terms of their behavior, they may do nothing — it’s just extra work. If they are measured in terms of their outcomes, however, they may well make the extra effort to order merchandise desirable to the street fair participants, and perhaps hire a temporary cashier to staff an outdoor booth, as this will boost store revenue and therefore their pay.
(Note that we have considered similar themes in our discussion of Agile and contract management, in terms of risk sharing.)
In general, it may seem that an outcome-based relationship would always be preferable. There is, however, an important downside. It transfers risk to the agent (e.g., the manager). And because the agent is assuming more risk, they will (in a fair market) demand more compensation. The owner may find themselves paying $60,000 for the manager’s services, for the same level of sales, because the manager also had to “price in” the possibility of poor sales and the risk that they would only make $35,000.
Finally, there is a way to align interests around outcomes without going fully to performance-based pay. If the manager for cultural reasons sees their interests as aligned, this may mitigate the principal-agent problem. In our example, suppose the store is in a small, tight-knit community with a strong sense of civic pride and familial ties.
Even if the manager is being managed in terms of their behavior, their cultural ties to the community or clan may lead them to see their interests as well aligned with those of the principal. As noted in [93], “Clan control implies goal congruence between people and, therefore, the reduced need to monitor behavior or outcomes. Motivation issues disappear.” We have discussed this kind of motivation in Section 6.3.1, “Coordination and Process”, especially in our discussion of control culture and insights drawn from the military.
Internal control is a process, effected by an entity’s Board of Directors, management, and other personnel, designed to provide reasonable assurance regarding the achievement of objectives relating to operations, reporting, and compliance.
Internal Control — Integrated Framework
An important discussion of governance is found in the statements of COSO on the general topic of "control".
Control is a term with broader and narrower meanings in the context of governance. In the area of risk management, “controls” are specific approaches to mitigating risk. However, “control” is also used by COSO in a more general sense to clarify governance.
Control activities, according to COSO, are:
the actions established through policies and procedures that help ensure that management’s directives to mitigate risks to the achievement of objectives are carried out. Control activities are performed at all levels of the entity, at various stages within business processes, and over the technology environment. They may be preventive or detective in nature and may encompass a range of manual and automated activities such as authorizations and approvals, verifications, reconciliations, and business performance reviews.
… Ongoing evaluations, built into business processes at different levels of the entity, provide timely information. Separate evaluations, conducted periodically, will vary in scope and frequency depending on assessment of risks, effectiveness of ongoing evaluations, and other management considerations. Findings are evaluated against criteria established by regulators, recognized standard-setting bodies or management, and the Board of Directors, and deficiencies are communicated to management and the Board of Directors as appropriate. [76]
6.4.1.1.2. Analyzing Governance
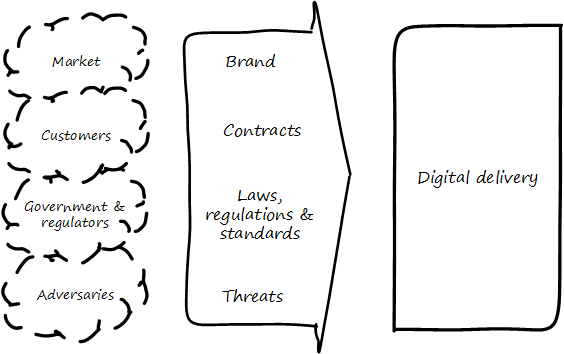
Governance is also a practical concern for you because, at your scale, you have a complex set of environmental forces to cope with (see Figure 113, “Governance in Context”). You started with a focus on the customer, and the market they represented. Sooner or later, you encountered regulators and adversaries: competitors and cybercriminals.
These external parties intersect with your reality via various channels:
-
Your brand, which represents a sort of general promise to the market (see [272], p.16)
-
Contracts, which represent more specific promises to suppliers and customers
-
Laws, regulations, and standards, which can be seen as promises you must make and keep in order to function in civil society, or in order to obtain certain contracts
-
Threats, which may be of various kinds:
-
Legal
-
Operational
-
Intentional
-
Unintentional
-
Illegal
-
Environmental
-
We will return to the role of external forces in our discussion of assurance. For now, we will turn to how digital governance, within an overall system of digital delivery, reflects our emergence model.
In terms of our emergence model, one of the most important distinctions between a “team of teams” and an “enterprise” is the existence of formalized organizational governance.
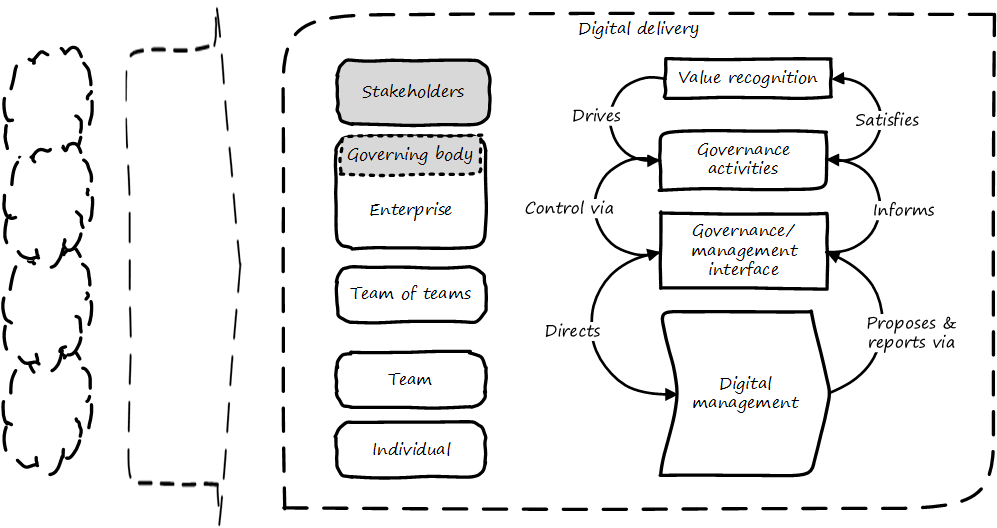
As illustrated in Figure 114, “Governance Emerges at the Enterprise Level”, formalized governance is represented by the establishment of a governing body, responsive to some stakeholders who seek to recognize value from the organization or “entity” — in this case, a digital delivery organization.
Corporate governance is a broad and deep topic, essential to the functioning of society and its organized participants. These include for-profit, non-profit, and even governmental organizations. Any legally organized entity of significant scope has governance needs.
One well-known structure for organizational governance is seen in the regulated, publicly owned company (such as those listed on stock exchanges) . In this model, shareholders elect a governing body (usually termed the Board of Directors), and this group provides the essential direction for the enterprise as a whole.
However, organizational governance takes other forms. Public institutions of higher education may have a Board of Regents or Board of Governors, perhaps appointed by elected officials. Non-profits and incorporated private companies still require some form of governance, as well. One of the less well-known but very influential forms of governance is the venture capital portfolio approach, very different from a public, mission-driven company. We will talk more about this in the digital governance section.
These are well-known topics in law, finance, and social organization, and there are many sources you can turn to if you have further interest. If you are taking any courses in Finance or Accounting, you will likely cover governance objectives and processes.
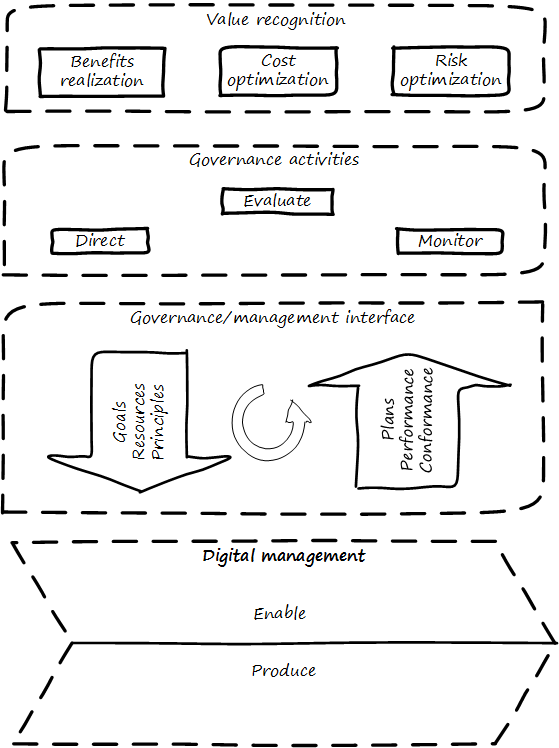
Illustrated in Figure 115, “Governance and Management with Interface”[10] is a more detailed visual representation of the relationship between governance and management in a digital context. Reading from the top down:
Value recognition is the fundamental objective of the stakeholder. We discussed in Section 6.2.1, “Product Management” the value objectives of effectiveness, efficiency, and risk (aka top line, bottom line, and risk). These are useful final targets for impact mapping, to demonstrate that lower-level perhaps more “technical” product capabilities do ultimately contribute to organization outcomes.
|
Note
|
The term “value recognition” as the stakeholder goal is chosen over “value creation” as “creation” requires the entire system. Stakeholders do not “create” without the assistance of management, delivery teams, and the individual. |
Here, we see them from the stakeholder perspective of:
-
Benefits realization
-
Cost optimization
-
Risk optimization
(Adapted from [146 p. 23])
Both ISO 38500 [155] as well as COBIT [146, 152] specify that the fundamental governance activities of governance are:
-
Direct
-
Evaluate
-
Monitor
Evaluation is the analysis of current state, including current proposals and plans. Directing is the establishment of organizational intent as well as the authorization of resources. Monitoring is the ongoing attention to organizational status, as an input to evaluation and direction.
Direct, Evaluate, and Monitor may also be ordered as Evaluate, Direct, and Monitor (EDM). These are highly general concepts that in reality are performed simultaneously, not as any sort of strict sequence.
The governance/management interface is an essential component. The information flows across this interface are typically some form of the following:
From the governing side
-
Goals (e.g., product and go-to-market strategies)
-
Resource authorizations (e.g., organizational budget approvals)
-
Principles and policies (e.g., personnel and expense policies)
From the governed side
-
Plans and proposals (at a high level; e.g., budget requests)
-
Performance reports (e.g., sales figures)
-
Conformance/compliance indicators (e.g., via audit and assurance)
Notice also the circular arrow at the center of the governance/management interface. Governance is not a one-way street. Its principles may be stable, but approaches, tools, practices, processes, and so forth (what we will discuss below as "governance elements") are variable and require ongoing evolution.
We often hear of “bureaucratic” governance processes. But the problem may not be “governance” per se. It is more often the failure to correctly manage the governance/management interface. Of course, if the Board is micro-managing, demanding many different kinds of information and intervening in operations, then governance and its management response is all much the same thing. In reality, however, burdensome organizational “governance” processes may be an overdone, bottom-up management response to perceived Board-level mandates.
Or they may be point-in-time requirements no longer needed. The policies of 1960 are unsuited to the realities of 2020. But if policies are always dictated top-down, they may not be promptly corrected or retired when no longer applicable. Hence, the scope and approach of governance in terms of its elements must always be a topic of ongoing, iterative negotiation between the governed and the governing.
Finally the lowermost digital delivery chevron — aka value chain, represents most of what we have discussed in Contexts I, II, and III:
-
The individual working to create value using digital infrastructure and lifecycle pipelines
-
The team collaborating to discover and deliver valuable digital products
-
The team of teams coordinating to deliver higher-order value while balancing effectiveness with efficiency and consistency
Ultimately, governance is about managing results and risk. It is about objectives and outcomes. It is about “what”, not “how”. In terms of practical usage, it is advisable to limit the “governance” domain — including the use of the term — to a narrow scope of the Board or Director-level concerns, and the existence of certain capabilities, including:
-
Organizational policy management
-
External and internal assurance and audit
-
Risk management, including security aspects
-
Compliance
We turn to a more in depth conversation of how governance plays out across its boundary with management.
Evidence of Notability
Corporate governance is a central concern for organizations as they start to scale. Understanding its fundamentals, and especially distinguishing it from management, is critical. There is substantial evidence for this, including the very existence of ISACA as well as COSO and related organizations.
Limitations
Governance is an abstract and difficult to understand concept for people in earlier career stages. The tendency is to either lump it in with "management" in general, or equate it just with "security".
Related Topics
6.4.1.2. Implementing Governance
To govern, organizations must rely on a variety of mechanisms, which are documented in this competency category.
6.4.1.2.1. Elements of a governance structure
Organizations leverage a variety of mechanisms to implement governance. The following draws on COBIT 2019 and other sources [147, 152]:
-
Mission, Principles, Policies, and Frameworks
-
Organizational Structures
-
Culture, Ethics, and Behavior
-
People, Skills, and Competencies
-
Processes and Procedures
-
Information
-
Services, Infrastructure, and Applications
|
Note
|
COBIT terminology has changed over the years, from "control objectives" (v4 and before) to "enablers" (v5) to the current choice of "components". This document uses the term "elements", and retains frameworks as a key governance element (COBIT 2019 dropped). |
In Figure 116, “Elements Across the Governance Interface” varying lengths of the elements are deliberate. The further upward the bar extends, the more they are direct concerns for governance. All of the elements are discussed elsewhere in the book.
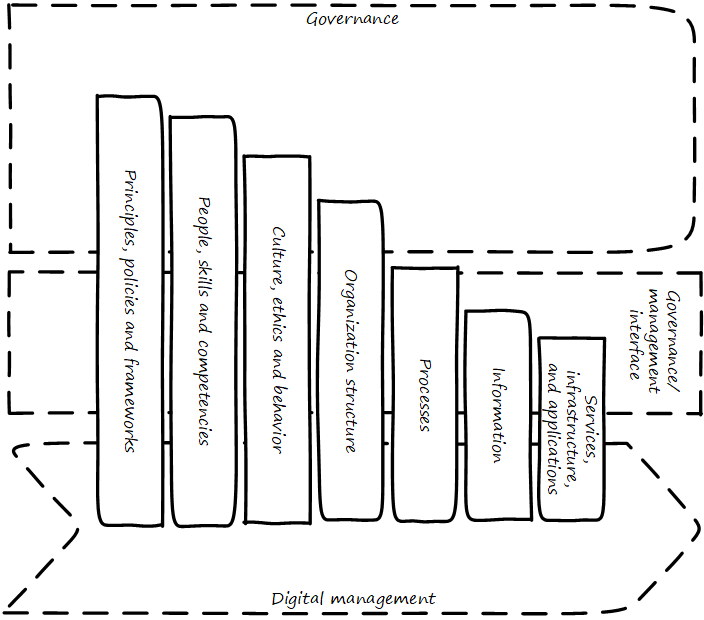
| Element | Covered |
|---|---|
Principles, Policies, and Procedures |
Principles & policies covered in this Competency Category. Frameworks covered in (PMBOK), (CMMI, ITIL, COBIT, TOGAF), (DMBOK). |
Processes |
|
Organizational Structures |
|
Culture, Ethics, and Behavior |
|
Information |
|
Services, Infrastructure, and Applications |
|
People, Skills, and Competencies |
Here, we are concerned with their aspect as presented to the governance interface. Some notes follow.
6.4.1.2.2. Mission, Principles, Policies, and Frameworks
Carefully drafted and standardized policies and procedures save the company countless hours of management time. The consistent use and interpretation of such policies, in an evenhanded and fair manner, reduces management’s concern about legal issues becoming legal problems.
“How To Write a Policy Manual"
Principles are the most general statement of organizational vision and values. Policies will be discussed in detail in the next section. In general, they are binding organization mandates or regulations, sometimes grounded in external laws. Frameworks were defined in Section 6.3.3.4, “Industry Frameworks”. We discuss all of these further in this Competency Category.
|
Note
|
Some companies may need to institute formal policies quite early. Even a startup may need written policies if it is concerned with regulations such as HIPAA. However, this may be done on an ad hoc basis, perhaps outsourced to a consultant. (A startup cannot afford a dedicated VP of Policy and Compliance.) This topic is covered in detail in this section because, at enterprise scale, ongoing policy management and compliance must be formalized. Recall that formalization is the basis of our emergence model. |
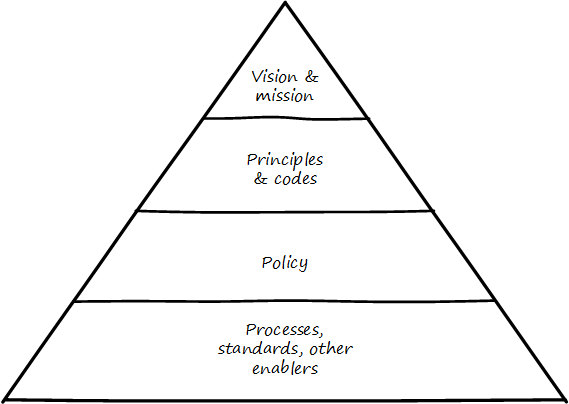
Illustrated in Figure 117, “Vision/Mission/Policy Hierarchy” is one way to think about policy in the context of our overall governance objective of value recognition.
The organization’s vision and mission should be terse and high level, perhaps something that could fit on a business card. It should express the organization’s reason for being in straightforward terms. Mission is the reason for being; vision is a “picture” of the future, preferably inspirational.
The principles and codes should also be brief. (“Codes” can include codes of ethics or codes of conduct.) For example, Nordstrom’s is about 8,000 words, perhaps about ten pages.
Policies are more extensive. There are various kinds of policies:
In a non-IT example, a compliance policy might identify the Foreign Corrupt Practices Act and make it clear that bribery of foreign officials is unacceptable. Similarly, a human resources policy might spell out acceptable and unacceptable side jobs (e.g., someone in the banking industry might be forbidden from also being a mortgage broker on their own account).
Policies are often independently maintained documents, perhaps organized along lines similar to:
-
Employment and human resources policies
-
Whistleblower policy (non-retaliation)
-
Records retention
-
Privacy
-
Workplace guidelines
-
Travel and expense
-
Purchasing and vendor relationships
-
Use of enterprise resources
-
Information security
-
Conflicts of interest
-
Regulatory
(This is not a comprehensive list.)
Policies, even though more detailed than codes of ethics/conduct, still should be written fairly broadly. In many organizations, they must be approved by the Board of Directors. They should, therefore, be independent of technology specifics. An information security policy may state that the hardening guidelines must be followed, but the hardening guidelines (stipulating, for example, what services and open ports are allowable on Debian® Linux) are not policy. There may be various levels or classes of policy.
Finally, policies reference standards and processes and other governance elements as appropriate. This is the management level, where documentation is specific and actionable. Guidance here may include:
-
Standards
-
Baselines
-
Guidelines
-
Processes and procedures
These concepts may vary according to organization, and can become quite detailed. Greater detail is achieved in hardening guidelines. A behavioral baseline might be “Guests are expected to sign in and be accompanied when on the data center floor.” We will discuss technical baselines further in the Competency Category on security, and also in our discussion of the technology product lifecycle in Section 6.4.3, “Architecture”. See also Shon Harris' excellent CISSP Exam Guide [124] for much more detail on these topics.
The ideal end state is a policy that is completely traceable to various automation characteristics, such as approved “Infrastructure as Code” settings applied automatically by configuration management software (as discussed in “The DevOps Audit Toolkit,” [85] — more on this to come). However, there will always be organizational concerns that cannot be fully automated in such manners.
Policies (and their implementation as processes, standards, and the like) must be enforced. As Steve Schlarman notes “Policy without a corresponding compliance measurement and monitoring strategy will be looked at as unrealistic, ignored dogma.” [247]
Policies and their derivative guidance are developed, just like systems, via a lifecycle. They require some initial vision and an understanding of what the requirements are. Again, Schlarman: “policy must define the why, what, who, where, and how of the IT process” [247]. User stories have been used effectively to understand policy needs.
Finally, an important point to bear in mind:
Company policies can breed and multiply to a point where they can hinder innovation and risk-taking. Things can get out of hand as people generate policies to respond to one-time infractions or out of the ordinary situations [116 p. 17].
It is advisable to institute sunset dates or some other mechanism that forces their periodic review, with the understanding that any such approach generates demand on the organization that must be funded. We will discuss this more in the Competency Category on digital governance.
We used the term “standards” above without fully defining it. We have discussed a variety of industry influences throughout this document: PMBOK, ITIL, COBIT, Scrum, Kanban, ISO/IEC 38500, and so on. We need to clarify their roles and positioning further. All of these can be considered various forms of “guidance” and as such may serve as governance elements. However, their origins, stakeholders, format, content, and usage vary greatly.
First, the term "standard” especially has multiple meanings. A “standard” in the policy sense may be a set of compulsory rules. Also, “standard” or “baseline” may refer to some intended or documented state the organization uses as a reference point. An example might be “we run Debian Linux 16_10 as a standard unless there is a compelling business reason to do otherwise”.
This last usage shades into a third meaning of uniform, de jure standards such as are produced by the IEEE, IETF, and ISO/IEC.
-
ISO/IEC: International Standards Organization/International Electrotechnical Commission
-
IETF: Internet Engineering Task Force
-
IEEE: Institute of Electrical and Electronics Engineers
The International Standards Organization, or ISO, occupies a central place in this ecosystem. It possesses “general consultative status” with the United Nations, and has over 250 technical committees that develop the actual standards.
The IEEE standardizes such matters as wireless networking (e.g., WiFi). The IETF (Internet Engineering Task Force) standardizes lower-level Internet protocols such as TCP/IP and HTTP. The W3C (World Wide Web Consortium) standardizes higher-level Internet protocols such as HTML. Sometimes standards are first developed by a group such as the IEEE and then given further authority though publication by ISO/IEC. The ISO/IEC in particular, in addition to its technical standards, also develops higher-order management/"best practice” standards. One well-known example of such an ISO standard is the ISO 9000 series on quality management.
Some of these standards may have a great effect on the digital organization. We will discuss this further in the Competency Category on compliance.
Frameworks were discussed in Section 6.3.3.4, “Industry Frameworks”. Frameworks have two major meanings. First, software frameworks are created to make software development easier. Examples include Struts, AngularJS, and many others. This is a highly volatile area of technology, with new frameworks appearing every year and older ones gradually losing favor.
In general, we are not concerned with these kinds of specific frameworks in this document, except governing them as part of the technology product lifecycle. We are concerned with “process” frameworks such as ITIL, PMBOK, COBIT, CMMI, and the TOGAF framework. These frameworks are not “standards” in and of themselves. However, they often have corresponding ISO standards:
| Framework | Standard |
|---|---|
ITIL |
ISO/IEC 20000 |
COBIT |
ISO/IEC 38500 |
PMBOK |
ISO/IEC 21500 |
CMMI |
ISO/IEC 15504 |
TOGAF |
ISO/IEC 42010 |
Frameworks tend to be lengthy and verbose. The ISO/IEC standards are brief by comparison, perhaps on average 10% of the corresponding framework. Methods (aka methodologies) in general are more action-oriented and prescriptive. Scrum and XP are methods. It is at least arguable that PMBOK is a method as well as a framework.
|
Note
|
There is little industry consensus on some of these definitional issues, and the student is advised not to be overly concerned about such abstract debates. If you need to comply with something to win a contract, it doesn’t matter whether it’s a “standard”, “framework”, “guidance”, “method”, or whatever. |
Finally, there are terms that indicate technology cycles, movements, communities of interest, or cultural trends: Agile and DevOps being two of the most current and notable. These are neither frameworks, standards, nor methods. However, commercial interests often attempt to build frameworks and methods representing these organic trends. Examples include SAFe, Disciplined Agile Delivery, the DevOps Institute, the DevOps Agile Skills Association, and many others.
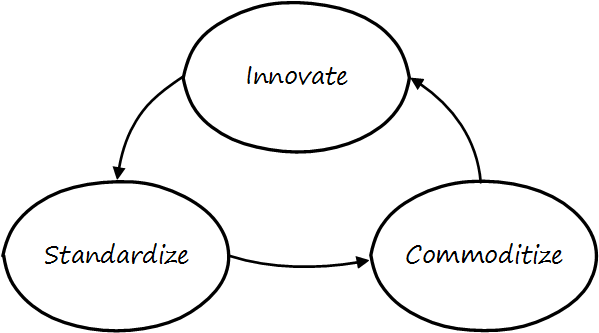
Figure: Figure 118, “Innovation Cycle” illustrates the innovation cycle. Innovations produce value, but innovation presents change management challenges, such as cost and complexity. The natural response is to standardize for efficiency, and standardization taken to its end state results in commodification, where costs are optimized as far as possible, and the remaining concern is managing the risk of the commodity (as either consumer or producer). While efficient, commoditized environments offer little competitive value, and so the innovation cycle starts again.
Note that the innovation cycle corresponds to the elements of value recognition:
-
Innovation corresponds to Benefits Realization
-
Standardization corresponds to Cost Optimization
-
Commoditization corresponds to Risk Optimization
We discussed basic organizational structure in Section 6.3.3, “Organization and Culture”. However, governance also may make use of some of the scaling approaches discussed in Section 6.3.3.2, “IT Human Resources Management”. Cross-organization coordination techniques (similar to those discussed in Boundary Spanning) are frequently used in governance (e.g., cross-organizational coordinating committees, such as an enterprise security council).
People and their skills and competencies (covered in Section 6.3.3.2, “IT Human Resources Management”) are governance elements upon in which all the others rest. “People are our #1 asset” may seem to be a cliche, but it is ultimately true. Formal approaches to understanding and managing this base of skills are therefore needed. A basic “human resources” capability is a start, but sophisticated and ambitious organizations institute formal organizational learning capabilities to ensure that talent remains a critical focus.
Process is defined in Chapter 2, Definitions. We will discuss processes as controls in the upcoming Competency Category on risk management. A control is a role that a governance element may play. Processes are the primary form of governance element used in this sense.
Information is a general term; in the sense of a governance element, it is based on data in its various forms, with overlays of concepts (such as syntax and semantics) that transform raw “data” into a resource that is useful and valuable for given purposes. From a governance perspective, information carries governance direction to the governed system, and the fed back monitoring is also transmitted as information. Information resource management and related topics such as data governance and data quality are covered in Section 6.4.2, “Information Management”; it is helpful to understand governance at an overall level before going into these more specific domains.
Services, infrastructure, and applications of course are the critical foundation of digital value. These fundamental topics were covered in Context I. In the sense of governance elements, they have a recursive or self-reflexive quality. Digital technology automates business objectives; at scale, a digital pipeline becomes a non-trivial business concern in and of itself, requiring considerable automation [31], [278]. Applications that serve as digital governance elements might include:
-
Source control
-
Build management
-
Package management
-
Deployment and configuration management
-
Monitoring
-
Portfolio management
Evidence of Notability
Governance requires mechanisms in order to function.
Limitations
Elaborate structures of governance elements (especially processes) can slow down digital delivery and, ironically, contribute greater risk than they reduce.
Related Topics
6.4.1.3. Risk and Compliance Management
Description
Risk and compliance are grouped together in this Competency Category as they are often managed by unified functional areas or capabilities (e.g., "Corporate Risk and Compliance"). Note, however, that they are two distinct concerns, to be outlined below.
6.4.1.3.1. Risk Management Fundamentals
Risk is defined as the possibility that an event will occur and adversely affect the achievement of objectives.
Internal Control — Integrated Framework
Risk is a fundamental concern of governance. Management (as we have defined it in this Competency Category) may focus on effectiveness and efficiency well enough, but too often disregards risk.
As we noted above, the shop manager may have incentives to maximize income but, usually, does not stand to lose their life savings. The owner, however, does. Fire, theft, disaster — without risk management, the owner does not sleep well.
For this reason, risk management is a large element of governance, as indicated by the popular GRC acronym: Governance, Risk Management, and Compliance.
Risk management can be seen as both a function and a process (see Figure 119, “Risk Management Context”). As a function, it may be managed by a dedicated organization (perhaps called Enterprise Risk Management or Operational Risk Management). As a process, it conducts the following activities:
-
Identifying risks
-
Assessing and prioritizing them
-
Coordinating effective responses to risks
-
Ongoing monitoring and reporting of risk management
Risk impacts some asset. Examples in the digital and IT context would include:
-
Operational IT systems
-
Hardware (e.g., computers) and facilities (e.g., data centers)
-
Information (customer or patient records)
It is commonly said that organizations have an “appetite” for risk [149 p. 79], in terms of the amount of risk the organization is willing to accept. This is a strategic decision, usually reserved for organizational governance.
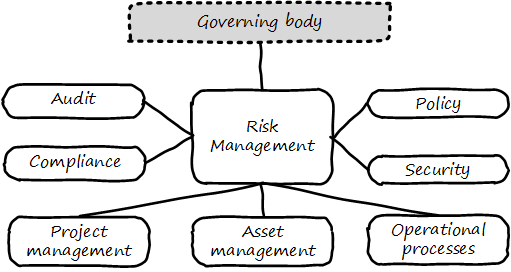
Risk management typically has strong relationships with the following organizational capabilities:
-
Enterprise governance (e.g., Board-level committees)
-
Security
-
Compliance
-
Audit
-
Policy management
For example, security requires risk assessment as an input, so that security resources focus on the correct priorities. Risk additionally may interact with:
-
Project management
-
Asset management
-
Processes such as change management
and other digital activities. More detail on core risk management activities follows, largely adopted from the COBIT for Risk publication [149].
There are a wide variety of potential risks, and many accounts and anecdotes are constantly circulating. It is critical that risk identification begins with a firm understanding of the organization’s objectives and context.
Risk identification can occur both in a “top-down” and “bottom-up” manner. Industry guidance can assist the operational risk management function in identifying typical risks. For example, the COBIT for Risk publication includes a useful eight-page “Generic Risk Scenarios” section [149 pp. 67-74] identifying risks such as:
-
“Wrong programs are selected for implementation and are misaligned with corporate strategy and priorities”
-
“There is an earthquake”
-
“Sensitive data is lost/disclosed through logical attacks”
These are only three of dozens of scenarios. Risks, of course, extend over a wide variety of areas:
-
Investment
-
Sourcing
-
Operations
-
Availability
-
Continuity
-
Security
and so forth. The same guidance also strongly cautions against over-reliance on these generic scenarios.
Risk management has a variety of concepts and techniques both qualitative and quantitative. Risk is often assumed to be the product of probability times impact. For example, if the chance of a fire in a facility is 5% over a given year, and the damage of the fire is estimated at $100,000, the annual risk is $5,000. An enterprise risk management function may attempt to quantify all such risks into an overall portfolio.
Where quantitative approaches are perceived to be difficult, risk may be assessed using simple ordinal scales (e.g., 1 to 5, where 1 is low risk, and 5 is high risk). COBIT for Risk expresses concern regarding “the use of ordinal scales for expressing risk in different categories, and the mathematical difficulties or dangers of using these numbers to do any sort of calculation” [149 p. 75]. Such approaches are criticized by Doug Hubbard in The Failure of Risk Management as misleading and potentially more harmful than not managing risk at all [133].
Hubbard instead suggests that quantitative techniques such as Monte Carlo analysis are rarely infeasible, and recommends their application instead of subjective scales.
The enterprise can also consider evaluating scenarios that have a chance of occurring simultaneously. This is frequently referred to as "stress" testing.
He who fights and runs away lives to fight another day.
342 BC — 291 BC
Risk response includes several approaches:
-
Avoidance
-
Acceptance
-
Transference
-
Mitigation
Avoidance means ending the activities or conditions causing the risk; e.g., not engaging in a given initiative or moving operations away from risk factors.
Acceptance means no action is taken. Typically, such “acceptance” must reside with an executive.
Transference means that some sharing arrangement, usually involving financial consideration, is established. Common transfer mechanisms include outsourcing and insurance. (Recall our discussion of Agile approaches to contract management and risk sharing.)
Mitigation means that some compensating mechanism — one or more “controls” is established. This topic is covered in the next section and comprises the remainder of the material on risk management.
(The above discussion was largely derived from the ISACA COBIT 5 framework for Risk [150]).
The term "control objective" is no longer a mainstream term used in COBIT 5, and the word "control" is used only rarely. Instead, COBIT 5 uses the concepts of process practices and process activities.
COBIT 5 for Assurance
The term “control” is problematic.
It has distasteful connotations to those who casually encounter it, evoking images of "command and control” management, or “controlling” personalities. COBIT, which once stood for Control Objectives for IT, now deprecates the term control (see the above quote). Yet it retains a prominent role in many discussions of enterprise governance and risk management, as we saw at the start of this Competency Category in the discussion of COSO’s general concept of control. Also (as discussed in our coverage of Scrum’s origins) it is a technical term of art in systems engineering. As such it represents principles essential to understanding large-scale digital organizations.
In this section, we are concerned with controls in a narrower sense, as risk mitigators. Governance elements such as policies, procedures, organizational structures, and the rest are used and intended to ensure that:
-
Investments achieve their intended outcomes
-
Resources are used responsibly, and protected from fraud, theft, abuse, waste, and mismanagement
-
Laws and regulations are adhered to
-
Timely and reliable information is employed for decision-making
But what are examples of “controls"? Take a risk, such as the risk of a service (e.g., e-commerce website) outage resulting in loss of critical revenues. There are a number of ways we might attempt to mitigate this risk:
-
Configuration management (a preventative control)
-
Effective monitoring of system alerts (a detective control)
-
Documented operational responses to detected issues (a corrective control)
-
Clear recovery protocols that are practiced and well understood (a recovery control)
-
System redundancy of key components where appropriate (a compensating control)
and so forth. Another kind of control appropriate to other risks is deterrent (e.g., an armed guard at a bank).
Other types of frequently seen controls include:
-
Separation of duties
-
Audit trails
-
Documentation
-
Standards and guidelines
A control type such as "separation of duties” is very general and might be specified by activity type; for example:
-
Purchasing
-
System development and release
-
Sales revenue recognition
Each of these would require distinct approaches to separation of duties. Some of this may be explicitly defined; if there is no policy or control specific to a given activity, an auditor may identify this as a deficiency.
Policies and processes in their aspect as controls are often what auditors test. In the case of the website above, an auditor might test the configuration management approach, the operational processes, inspect the system redundancy, and so forth. And risk management would maintain an ongoing interest in the system in between audits.
As with most topics in this document, risk management (in and of itself, as well as applied to IT and digital) is an extensive and complex domain, and this discussion was necessarily brief.
Business continuity is an applied domain of digital and IT risk, like security. Continuity is concerned with large-scale disruptions to organizational operations, such as:
-
Floods
-
Earthquakes
-
Tornadoes
-
Terrorism
-
Hurricanes
-
Industrial catastrophes (e.g., large-scale chemical spills)
A distinction is commonly made between:
-
Business continuity planning
-
Disaster recovery
Disaster recovery is more tactical, including the specific actions taken during the disaster to mitigate damage and restore operations, and often with an IT-specific emphasis.
Continuity planning takes a longer-term view of matters such as long-term availability of replacement space and computing capacity.
There are a variety of standards covering business continuity planning, including:
-
NIST Special Publication 800-34
-
ISO/IEC 27031:2011
-
ISO 22301
In general, continuity planning starts with understanding the business impact of various disaster scenarios and developing plans to counter them. Traditional guidance suggests that this should be achieved in a centralized fashion; however, large, centralized efforts of this nature tend to struggle for funding.
While automation alone cannot solve problems such as “where do we put the people if our main call center is destroyed”, it can help considerably in terms of recovering from disasters. If a company has been diligent in applying Infrastructure as Code techniques, and loses its data center, it can theoretically re-establish its system configurations readily, which can otherwise be a very challenging process, especially under time constraints. (Data still needs to have been backed up to multiple locations.)
6.4.1.3.2. Compliance
Compliance is a very general term meaning conformity or adherence to:
-
Laws
-
Regulations
-
Policies
-
Contracts
-
Standards
and the like. Corporate compliance functions may first be attentive to legal and regulatory compliance, but the other forms of compliance are matters of concern as well.
A corporate compliance office may be responsible for the maintenance of organizational policies and related training and education, perhaps in partnership with the human resources department. They also may monitor and report on the state of organizational compliance. Compliance offices may also be responsible for codes of ethics. Finally, they may manage channels for anonymous reporting of ethics and policy violations by whistleblowers (individuals who become aware of and wish to report violations while receiving guarantees of protection from retaliation).
Compliance uses techniques similar to risk management and, in fact, non-compliance can be managed as a form of risk, and prioritized and handled much the same way. However, compliance is an information problem as well as a risk problem. There is an ongoing stream of regulations to track, which keeps compliance professionals very busy. In the US alone, these include:
-
HIPAA
-
SOX
-
FERPA
-
PCI DSS
-
GLBA PII
and in the European Union, the GDPR (Global Data Protection Regulation) and various data sovereignty regulations (e.g., German human resources data must remain in Germany).
Some of these regulations specifically call for policy management, and therefore companies that are subject to them may need to institute formal governance earlier than other companies, in terms of the emergence model. Many of them provide penalties for the mismanagement of data, which we will discuss further in this Competency Area and in Competency Area 11. Compliance also includes compliance with the courts (e.g., civil and criminal actions). This will be discussed in the Section 6.4.2, “Information Management” section on cyberlaw.
Evidence of Notability
Risk is a fundamental business concern, along with sales and net profits. The entire insurance industry is founded on the premise of risk management. Digital systems are subject to certain risks, and in turn present risks to the organizations that depend on them.
Limitations
Risk is difficult - not impossible - to quantify. When risk is not correctly quantified, it can lead to dysfunctional organizational behavior; e.g., spending disproportionate resources to mitigate a given risk. The irony (poorly understood by many risk professionals) is that overly elaborate risk mitigation approaches can themselves be a source of risk, in their imposition of delays and other burdens on the delivery of value.
Related Topics
6.4.1.4. Assurance and Audit
6.4.1.4.1. Assurance
Trust, but verify.
Assurance is a broad term. In this document, it is associated with governance. It represents a form of additional confirmation that management is performing its tasks adequately. Go back to the example that started this Competency Area, of the shop owner hiring a manager. Suppose that this relationship has continued for some time, and while things seem to be working well, the owner has doubts about the arrangement. Over time, things have gone well enough that the owner does not worry about the shop being opened on time, having sufficient stock, or paying suppliers. But there are any number of doubts the owner might retain:
-
Is money being accounted for honestly and accurately?
-
Is the shop clean? Is it following local regulations? For example, fire, health and safety codes?
-
If the manager selects a new supplier, are they trustworthy? Or is the shop at risk of selling counterfeit or tainted merchandise?
-
Are the shop’s prices competitive? Is it still well regarded in the community? Or has its reputation declined with the new manager?
-
Is the shop protected from theft and disaster?
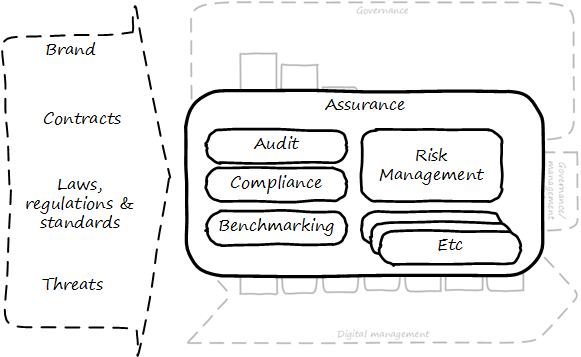
These kinds of concerns remain with the owner, by and large, even with a reliable and trustworthy manager. If not handled correctly, the owner’s entire investment is at risk. The manager may only have a salary (and perhaps a profit share) to worry about, but if the shop is closed due to violations, or lawsuit, or lost to a fire, the owner’s entire life investment may be lost. These concerns give rise to the general concept of assurance, which applies to digital business just as it does to small retail shops. The following diagram, derived from previous illustrations, shows how this document views assurance: as a set of practices overlaid across governance elements, and in particular concerned with external forces (see Figure 120, “Assurance in Context”).
In terms of the governance-management interface, assurance is fundamentally distinct from the information provided by management and must travel through distinct communication channels. This is why auditors (for example) forward their reports directly to the Audit Committee and do not route them through the executives who have been audited.
Technologists, especially those with a background in networking, may have heard of the concept of “out-of-band control”. With regard to out-of-band management or control of IT resources, the channel over which management commands travel is distinct from the channel over which the system provides its services. This channel separation is done to increase security, confidence, and reliability, and is analogous to assurance.
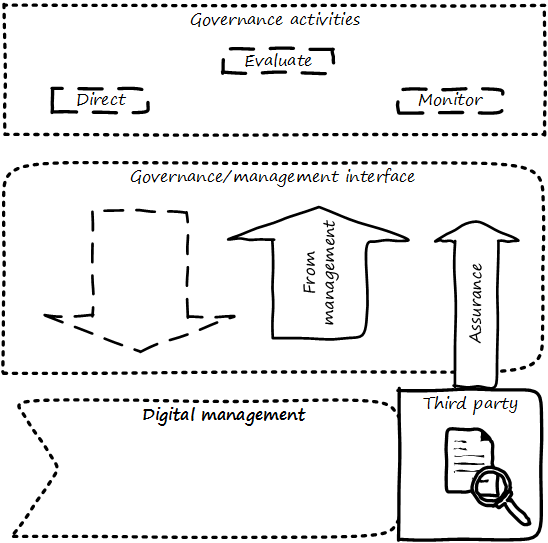
As ISACA stipulates:
The information systems audit and assurance function shall be independent of the area or activity being reviewed to permit objective completion of the audit and assurance engagement. [151 p. 9]. Assurance can be seen as an external, additional mechanism of control and feedback. This independent, out-of-band aspect is essential to the concept of assurance (see Figure 121, “Assurance is an Objective, External Mechanism”).
Assurance means that pursuant to an accountability relationship between two or more parties, an IT audit and assurance professional may be engaged to issue a written communication expressing a conclusion about the subject matters to the accountable party.
There are broader and narrower definitions of assurance. But all reflect some kind of three-party arrangement (see Figure 122, “Assurance is Based on a Three-Party Model”, reflects concepts from [148, 142]).
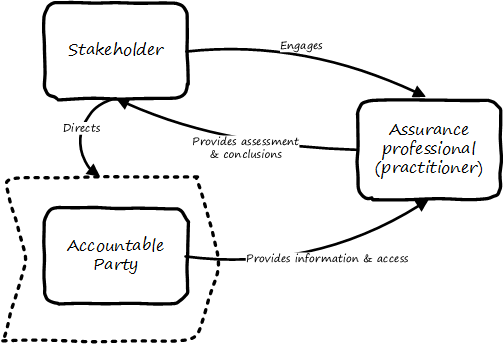
The above diagram is one common scenario:
-
The stakeholder (e.g., the Audit Committee of the Board of Directors) engages an assurance professional (e.g., an audit firm) - the scope and approach of this are determined by the engaging party, although the accountable party in practice often has input as well
-
The accountable party, at the direction, responds to the assurance professional’s inquiries on the audit topic
-
The assurance professional provides the assessment back to the engaging party, and/or other users of the report (potentially including the accountable party)
This is a simplified view of what can be a more complex process and set of relationships. The ISAE3000 standard states that there must be at least three parties to any assurance engagement:
-
The responsible (accountable) party
-
The practitioner
-
The intended users (of the assurance report)
But there may be additional parties:
-
The engaging party
-
The measuring/evaluating party (sometimes not the practitioner, who may be called on to render an opinion on someone else’s measurement)
ISAE3000 goes on to stipulate a complex set of business rules for the allowable relationships between these parties [142 pp. 95-96]. Perhaps the most important rule is that the practitioner cannot be the same as either the responsible party or the intended users. There must be some level of professional objectivity.
What’s the difference between assurance and simple consulting? There are two major factors:
-
Consulting can be simply a two-party relationship — a manager hires someone for advice
-
Consultants do not necessarily apply strong assessment criteria
-
Indeed, with complex problems, there may not be any such criteria. Assurance, in general, presupposes some existing standard of practice, or at least some benchmark external to the organization being assessed.
-
Finally, the concept of assurance criteria is key. Some assurance is executed against the responsible party’s own criteria. In this form of assurance, the primary questions are “are you documenting what you do, and doing what you document?”. That is, for example, do you have formal process management documentation? And are you following it?
Other forms of assurance use external criteria. A good example is the Uptime Institute's data center tier certification criteria, discussed below. If criteria are weak or non-existent, the assurance engagement may be more correctly termed an advisory effort. Assurance requires clarity on this topic.
Exercise caution in your business affairs; for the world is full of trickery.
“Desiderata"
The general topic of “assurance” implies a spectrum of activities. In the strictest definitions, assurance is provided by licensed professionals under highly formalized arrangements. However, while all audit is assurance, not all assurance is audit. As noted in COBIT for Assurance, “assurance also covers evaluation activities not governed by internal and/or external audit standards” [150 p. 15].
This is a blurry boundary in practice, as an assurance engagement may be undertaken by auditors, and then might be casually called an “audit” by the parties involved. And there is a spectrum of organizational activities that seem at least to be related to formal assurance:
-
Brand assurance
-
Quality assurance
-
Vendor assurance
-
Capability assessments
-
Attestation services
-
Certification services
-
Compliance
-
Risk management
-
Benchmarking
-
Other forms of “due diligence”
Some of these activities may be managed primarily internally, but even in the case of internally managed activities, there is usually some sense of governance, some desire for objectivity.
From a purist perspective, internally directed assurance is a contradiction in terms. There is a conflict of interest in that in terms of the three-party model above, the accountable party is the practitioner.
However, it may well be less expensive for an organization to fund and sustain internal assurance capabilities and get much of the same benefits as from external parties. This requires sufficient organizational safeguards to be instituted. Internal auditors typically report directly to the Board-level Audit Committee and, generally, are not seen as having a conflict of interest.
In another example, an internal compliance function might report to the corporate general counsel (chief lawyer), and not to any executive whose performance is judged based on their organization’s compliance — this would be a conflict of interest. However, because the internal compliance function is ultimately under the CEO, their concerns can be overruled.
The various ways that internal and external assurance arrangements can work, and can go wrong, is a long history. If you are interested in the topic, review the histories of Enron, Worldcom, the 2008 mortgage crisis, and other such failures.
Risk management (discussed in the previous section) may be seen as part of a broader assurance ecosystem. For evidence of this, consider that the Institute of Internal Auditors offers a certificate in Risk Management Assurance; The Open Group also operates the Open FAIR™ Certification Program. Assurance in practice may seem to be biased towards risk management, but (as with governance in general) assurance as a whole relates to all aspects of IT and digital governance, including effectiveness and efficiency.
Audit practices may be informed of known risks and particularly concerned with their mitigation, but risk management remains a distinct practice. Audits may have scope beyond risks, and audits are only one tool used by risk management (see Figure 123, “Assurance and Risk Management”).
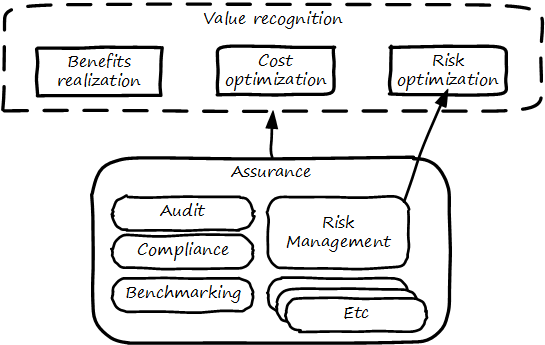
In short, and as shown in the above diagram, assurance plays a role across value recognition, while risk management specifically targets the value recognition objective of risk optimization.
Businesses must find a level of trust between each other … third-party reports provide that confidence. Those issuing the reports stake their name and liability with each issuance.
“Successfully Establishing and Representing DevOps in an Audit"
Before we turn to a more detailed discussion of the audit, we will discuss some specifically non-audit examples of assurance seen in IT and digital management.
Example 1: Due Diligence on a Cloud Provider
Your company is considering a major move to cloud infrastructure for its systems. The agility value proposition — the ability to minimize cost of delay — is compelling, and there may be some cost structure advantages as well.
But you are aware of some cloud failures:
-
In 2013, UK cloud provider 2e2 went bankrupt, and customers were given “24 to 48 hours to get … data and systems out and into a new environment” [90]; subsequently, the provider demanded nearly 1 million pounds (roughly $1.5 million) from its customers in order for their uninterrupted access to services (i.e., their data) [292]
-
Also in 2013, cloud storage provider Nirvanix went bankrupt, and its customers also had a limited time to remove their data; MegaCloud went out of business with no warning two months later, and all customers lost all data [51], [52]
-
In mid-2014, online source code repository Cloud Spaces (an early Github competitor) was taken over by hackers and destroyed; all data was lost [291], [188]
The question is, how do you manage the risks of trusting your data and organizational operations to a cloud provider? This is not a new question, as computing has been outsourced to specialist firms for many years. You want to be sure that their operations meet certain standards such as:
-
Financial standards
-
Operational standards
-
Security standards
Data center evaluations of cloud providers are a form of assurance. Two well-known approaches are:
-
The Uptime Institute’s Tier Certification
-
The American Institute of Certified Public Accountants' (AICPA) SOC 3 “Trust Services Report” certifying “Service Organizations” (based in turn on the SSAE-18 standard)
The Uptime Institute provides the well-known “Tier” concept for certifying data centers, from Tier I to Tier IV. In their words: “certification provides assurances that there are not shortfalls or weak links anywhere in the data center infrastructure” [290]. The Tiers progress as follows [289]:
-
Tier I: Basic Capacity
-
Tier II: Redundant Capacity Components
-
Tier III: Concurrently Maintainable
-
Tier IV: Fault Tolerance
Uptime Institute certification is a generic form of assurance in terms of the three-party model; the data center operator must work with the Uptime Institute who provides an independent opinion based on their criteria as to the data center’s tier (and therefore effectiveness).
The SOC 3 report is considered an “assurance” standard as well. However, as mentioned above, this is the kind of “assurance” done in general by licensed auditors, and which might casually be called an “audit” by the participants. A qualified professional, again in the three-party model, examines the data center in terms of the SSAE 18 reporting standard.
Your internal risk management organization might look to both Uptime Institute and SOC 3 certification as indicators that your cloud provider risk is mitigated. (More on this in Competency Category on Risk Management.)
Example 2: Internal Process Assessment
You may also have concerns about your internal operations. Perhaps your process for selecting technology vendors is unsatisfactory in general; it takes too long and yet vendors with critical weaknesses have been selected. More generally, the actual practices of various areas in your organization may be assessed by external consultants using the related guidance:
-
Enterprise Architecture with the TOGAF Architecture Development Method (ADM)
-
Project Management with PMBOK
-
IT processes such as incident management, change management, and release management with ITIL or CMMI-SVC
These assessments may be performed through using a maturity scale; e.g., CMM-derived. The CMM-influenced ISO/IEC 15504 standard may be used as a general process assessment framework. (Remember that we have discussed the problems with the fundamental CMM assumptions on which such assessments are based.)
According to [28]: “In our own experience, we have seen that the maturity models have their limitations.”. They warn that maturity assessments of Enterprise Architecture at least are prone to being:
-
Subjective
-
Academic
-
Easily manipulated
-
Bureaucratic
-
Superfluous
-
Misleading
Those issues may well apply to all forms of maturity assessments. Let the buyer beware. At least, the concept of maturity should be very carefully defined in a manner relevant to the organization being assessed.
Example 3: Competitive Benchmarking
Finally, you may wonder, “how does my digital operation compare to other companies?” Now, it is difficult to go to a competitor and ask this. It is also not especially practical to go and find some non-competing company in a different industry you don’t understand well. An entire industry has emerged to assist with this question.
We talked about the role of industry analysts in Section 6.3.2, “Investment and Portfolio”. Benchmarking firms play a similar role and, in fact, some analyst firms provide benchmarking services.
There are a variety of ways benchmarking is conducted, but it is similar to assurance in that it often follows the three-party model. Some stakeholder directs an accountable party to be benchmarked within some defined scope. For example, the number of staff required to managed a given quantity of servers (aka admin:server) has been a popular benchmark. (Note that with cloud, virtualization, and containers, the usefulness of this metric is increasingly in question.)
An independent authority is retained. The benchmarker collects, or has collected, information on similar operations; for example, they may have collected data from 50 organizations of similar size on admin:server ratios. This data is aggregated and/or anonymized so that competitive concerns are reduced. Wells Fargo will not be told: “JP Morgan Chase has an overall ratio of 1:300”; they will be told: “The average for financial services is 1:250.”.
In terms of formal assurance principles, the benchmark data becomes the assessment criteria. A single engagement might consider dozens of different metrics, and where simple quantitative ratios do not apply, the benchmarker may have a continuously maintained library of case studies for more qualitative analysis. This starts to shade into the kind of work also performed by industry analysts. As the work becomes more qualitative, it also becomes more advisory and less about “assurance” per se.
6.4.1.4.2. Audit
The Committee, therefore, recommends that all listed companies should establish an Audit Committee.
Agile or not, a team ultimately has to meet legal and essential organizational needs and audits help to ensure this.
Disciplined Agile Delivery
If you look up “audit” online or in a dictionary, you will see it mainly defined in terms of finance: an audit is a formal examination of an organization’s finances (sometimes termed “books”). Auditors look for fraud and error so that investors (like our shop owner) have confidence that accountable parties (e.g., the shop manager) are conducting business honestly and accurately.
Audit is critically important to the functioning of the modern economy because there are great incentives for theft and fraud, and owners (in the form of shareholders) are remote from the business operations.
But what does all this have to do with IT and Digital Transformation?
Digital organizations, of course, have budgets and must account for how they spend money. Since financial accounting and its associated audit practices are a well-established practice, we won’t discuss it here. (We discussed IT financial management and service accounting in Section 6.3.2.1, “Financial Management of Digital and IT”.)
Money represents a form of information - that of value. Money once was stored as a precious metal. When carrying large amounts of precious metal became impossible, it was stored in banks and managed through paper record-keeping. Paper record-keeping migrated onto computing machines, which now represent the value once associated with gold and silver. Bank deposits (our digital user’s bank account balance from Section 6.1.1, “Digital Fundamentals”) are now no more than a computer record — digital bits in memory — made meaningful by tradition and law, and secured through multiple layers of protection and assurance.
Because of the increasing importance of computers to financial fundamentals, auditors became increasingly interested in IT. Clearly, these new electronic computers could be used to commit fraud in new and powerful ways. Auditors had to start asking: “How do you know the data in the computer is correct?”. This led to the formation in 1967 of the Electronic Data Processing Auditors Association (EDPAA), which eventually became ISACA (developer of COBIT).
It also became clear that computers and their associated operation were a notable source of cost and risk for the organization, even if they were not directly used for financial accounting. This has led to the direct auditing of IT practices and processes, as part of the broader assurance ecosystem we are discussing in this Competency Category.
A wide variety of IT practices and processes may be audited. Auditors may take a general interest in whether the IT organization is “documenting what it does and doing what it documents” and therefore nearly every IT process has been seen to be audited.
IT auditors may audit projects, checking that the expected project methodology is being followed. They may audit IT performance reporting, such as claims of meeting SLAs. And they audit the organization’s security approach — both its definition of security policies and controls, as well as their effectiveness.
IT processes supporting the applications used by financially-relevant systems, in general, will be under the spotlight from an auditor. This is where Information Technology General Controls (ITGCs) play a key role to assure that the data is secured and is reliable [153] for financial reporting. The IT Governance Institute [158] further articulates how IT controls and the technology environment’s relationship between the Public Company Accounting Oversight Board (PCAOB) and COBIT is built.
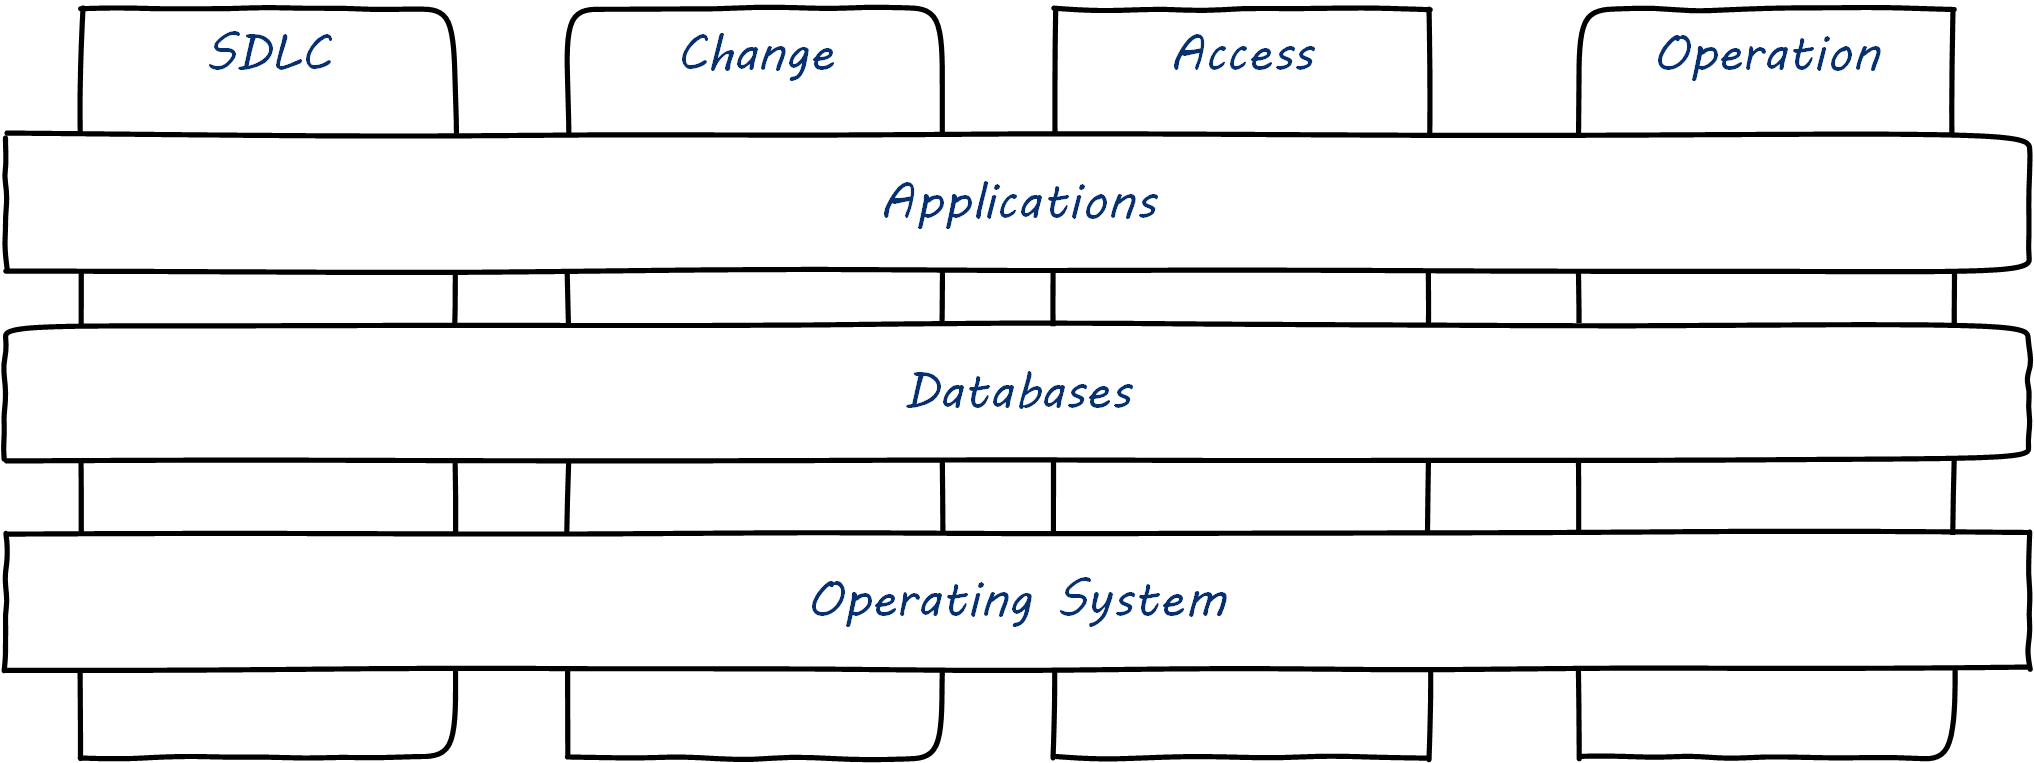
Adapted from IT Control environment [158 p. 11], Figure 1.
Logical access to data, changes to applications, development of application, and computer operations will be the key areas of focus. Each of these areas are further divided into sub-areas for controlling the environment effectively.
Areas of control, generally, fall into these categories: SDLC, change management, logical access, and operations. A brief note on each of these controls follows.
SDLC If changes done to applications involve data conversion, management approval should be documented before moving the code to production, irrespective of the development methodology chosen. Controls could be called:
-
Data conversion testing
-
Go-live approval
Change Management Changes to the applications need to be tested with the appropriate level of documentation and approved through a Change Control Board. Management need to ensure that developers do not have privileged access to the production environment, including code migration privileges. Controls could be called:
-
Change testing
-
Change approval
-
Developer no privileged production access
-
Developer/migrator access
Logical Access Access to the applications need to be controlled through a variety of controls, such as provisioning and deprovisioning of access; password complexity and generic identity; password management; and access review of privileged/generic accounts and user accesses. Though not an extensive list, management oversight across the board is needed when users are involved to ensure the appropriate level of access is given and monitored. Controls could be called:
-
Password settings
-
User access reviews
-
Role reviews
-
Generic account password changes
-
Access review – privileged account
-
Access review – generic accounts
-
Access provisioning
-
Access removal
Operations In IT organizations, another key activity is to maintain and manage the infrastructure supporting the data. Who has access to the data center, how we schedule jobs, and what we do when jobs fail, and how we take backups and restore from backups, when needed, form key sub-areas to manage. Controls could be called:
-
Data center access
-
Job scheduling and resolution
-
Data backups
-
Data restoration
Controls driven through policies and processes target the application landscape, which helps financial reporting. Care needs to be taken to ensure that the prevention or detection controls are executed in a timely manner. As an example, Logical Access – Access Provisioning is deemed a preventative control; i.e., preventing unnecessary access to data, and Logical Access – User Access Review is deemed a detective control; i.e., detecting access provisioned is still relevant. Each control needs to be evaluated on its merit and ensure that there are mitigating controls.
If you are in a public company, IT controls relate directly to the SEC 10K report – an annual filing of the company’s financial status. The formation of this report is a culmination of the various audits conducted by internal and external auditors. Internal control over financial reporting by the Public Company Accounting Oversight Board [218] clearly notes the implications of the control environment.
|
Note
|
Controls failure is an ongoing theme in The Phoenix Project, the novelization that helped launch DevOps as a movement [165]. |
If the controls start to fail, the scale of control failure ranges from an individual application failing any of the control to system design failure or the operational failure of the control [218] standard notes that the severity of the failure as a control is deficient - a combination of deficiencies leading to significant deficiency and a combination of deficiencies with potential for misstatement of financial reporting leading to material weakness. There should be enough management attention for each of these control failures and it may include application owner, control owner, and CIO including the Audit Committee of the Board of Directors.
Organizations need to survive in the digital economy by making choices with the limited pool of budget available. If the IT organization cannot control the environment, the cost of compliance significantly increases, thereby reducing the investment available for innovation.
It is better to be compliant to innovate more!
There are two major kinds of auditors of interest to us:
-
External auditors
-
Internal auditors
Here is a definition of external auditor:
An external auditor is chartered by a regulatory authority to visit an enterprise or entity and to review and independently report the results of that review. [198 p. 319].
Many accounting firms offer external audit services, and the largest accounting firms (such as PriceWaterhouse Coopers and Ernst & Young) provide audit services to the largest organizations (corporations, non-profits, and governmental entities). External auditors are usually certified public accountants, licensed by their state, and following industry standards (e.g., from the American Institute of Certified Public Accountants).
By contrast, internal auditing is housed internally to the organization, as defined by the Institute of Internal Auditors:
Internal auditing is an independent appraisal function established within an organization to examine and evaluate its activities as a service to the organization. [198], p.320.
Internal audit is considered a distinct but complementary function to external audit [70], 4_39. The internal audit function usually reports to the Audit Committee. As with assurance in general, independence is critical — auditors must have organizational distance from those they are auditing, and must not be restricted in any way that could limit the effectiveness of their findings.
As with other forms of assurance, audit follows the three-party model. There is a stakeholder, an accountable party, and an independent practitioner. The typical internal audit lifecycle consists of (derived from [150]):
-
Planning/scoping
-
Performing
-
Communicating
In the scoping phase, the parties are identified (e.g., the Board Audit Committee, the accountable and responsible parties, the auditors, and other stakeholders).
The scope of the audit is very specifically established, including objectives, controls, and various governance elements (e.g., processes) to be tested. Appropriate frameworks may be utilized as a basis for the audit, and/or the organization’s own process documentation.
The audit is then performed. A variety of techniques may be used by the auditors:
-
Performance of processes or their steps
-
Inspection of previous process cycles and their evidence (e.g., documents, recorded transactions, reports, logs, etc.)
-
Interviews with staff
-
Physical inspection or walkthroughs of facilities
-
Direct inspection of system configurations and validation against expected guidelines
-
Attempting what should be prevented (e.g., trying to access a secured system or view data over the authorization level)
A fundamental principle is “expected versus actual”. There must be some expected result to a process step, calculation, etc., to which the actual result can be compared.
Finally, the audit results are reported to the agreed users (often with a preliminary “heads up” cycle so that people are not surprised by the results). Deficiencies are identified in various ways and typically are taken into system and process improvement projects.
Evidence of Notability
Assurance as a broad topic, and audit as a narrower instance, like governance itself are fundamental to the functioning of the economy. ISACA has published significant guidance on both topics, as have other, broader organizations such as the International Auditing and Assurance Standards Board, or IAASB.
Limitations
Assurance and audit in general require some clear standard or expectation against which to assess. In terms of process, they are suitable for lower-variability problem domains. They are less applicable to complex or chaotic domains. However, even within a chaotic situation, there will still be basic assumptions around (for example) how money and security are to be handled. Audit, in the IT systems context, has been important enough to drive the creation of one of the major IT/Digital Practitioner organizations, the IS Audit and Control Association (founded in 1967 as the Electronic Data Processing Auditors Association, or EDPAA).
Related Topics
6.4.1.5. Security
Description
A measure of a system’s ability to resist unauthorized attempts at usage or behavior modification, while still providing service to legitimate users.
Enernex
You have been practicing security since you first selected your initial choice of infrastructure and platform in Digital Infrastructure. But by now, your security capability is a well-established organization with processes spanning the enterprise, and a cross-functional steering committee composed of senior executives and with direct access to Board governance channels.
Security is a significant and well-known domain in and of itself. Ultimately, however, security is an application of the governance and risk management principles discussed in the previous sections. Deriving ultimately from the stakeholder’s desire to sustain and protect the enterprise (see Figure 125, “Security Context”), security relies on:
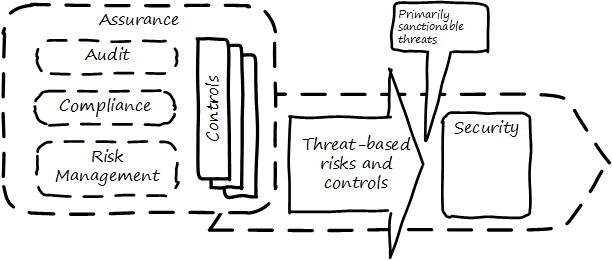
So what distinguishes security from more general concepts of risk? The definition at the top of this section is a good start, with its mention of “unauthorized attempts” to access or modify systems. The figure Figure 125, “Security Context” uses the term “sanctionable”, meaning violations might lead to legal or at least organizational penalties.
Many risks might involve carelessness, or incompetence, or random technical failure, or accidents of nature. Such concerns are sometimes termed "safety" to distinguish them from security. Security focuses on violations (primarily intentional, but also unintentional) of policies protecting organizational assets. In fact, "assets protection” is a common alternate name for corporate security.
“Authorization” is a key concept. Given some valuable resource, is access restricted to those who ought to have it? Are they who they say they are? Do they have the right to access what they claim is theirs? Are they conducting themselves in an expected and approved manner?
The security mentality is very different from the mentality found in a startup. A military analogy might be helpful. Being in a startup is like engaging in offensive missions: search, extract, destroy, etc. It involves travelling to a destination and operating with a single-point focus on completion.
Security, on the other hand, is like defending a perimeter. You have to think broadly across a large area, assessing weaknesses and distributing limited resources where they will have the greatest effect.
6.4.1.5.1. Security Taxonomy
An accepted set of terminology is key. The CISSP (Certified Information Systems Security Professional) Guide proposes the following taxonomy:
-
Vulnerability
-
Threat agent
-
Threat
-
Risk
-
Control
-
Exposure
-
Safeguard (e.g., control)
These terms are best understood in terms of their relationships, which are graphically illustrated in Figure 126, “Security Taxonomy” (similar to CISSP, [124]).
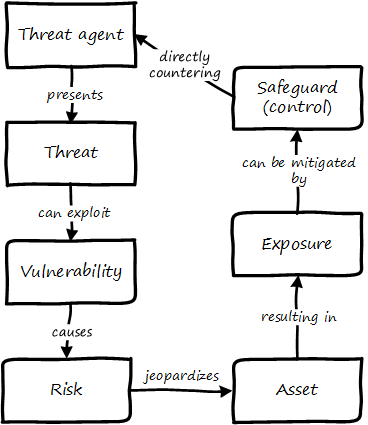
In implementing controls, the primary principles are:
-
Availability: the asset must be accessible to those entitled to it
-
Integrity: the asset must be protected from destruction or corruption
-
Confidentiality: the asset must not be accessible to those not entitled to it
6.4.1.5.2. Information Classification
At a time when the significance of information and related technologies is increasing in every aspect of business and public life, the need to mitigate information risk, which includes protecting information and related IT assets from ever-changing threats is constantly intensifying.
COBIT 5 for Security
Before we turn to security engineering and security operations, we need to understand the business context of security. The assets at risk are an important factor, and risk management gives us a good general framework. One additional technique associated with security is information classification. A basic hierarchy is often used, such as:
-
Public
-
Internal
-
Confidential
-
Restricted
The military uses the well-known levels of:
-
Unclassified
-
Confidential
-
Secret
-
Top Secret
These classifications assist in establishing the security risk and necessary controls for a given digital system and/or process.
Information also can be categorized by subject area. This becomes important from a compliance point of view. This will be discussed in Competency Area 11, in the section on records management.
6.4.1.5.3. Security Engineering
For the next two sections, we will adopt a “dual-axis” view, first proposed in [31].
In this model, the systems lifecycle is considered along the horizontal access, and the user experience is considered along the vertical access (which also maps to the “stack”). In the following picture, we see the distinct concerns of the various stakeholders in the dual-axis model (see Figure 127, “Security and the Dual-Axis Value Chain”).
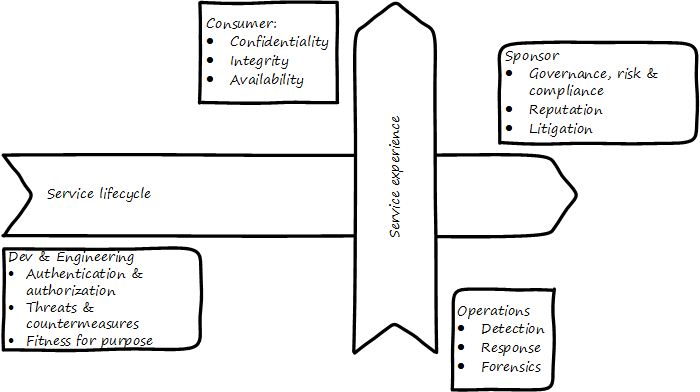
The consumer of the digital service has different concerns from the sponsor/customer (in our three-party model). The consumer (our woman checking her bank balance) is concerned with immediate aspects of confidentiality, integrity, and availability:
-
Is this communication private?
-
Is my money secure?
-
Can I view my balance and do other operations with it (e.g., transfer it) confident of no interference?
The sponsor, on the other hand, has derivative concerns:
-
Are we safe from the bad publicity that would result from a breach?
-
Are we compliant with laws and regulations or are we risking penalties for non-compliance (as well as risking security issues)?
-
Are our security activities as cost-efficient as possible, given our risk appetite?
Security engineering is concerned with the fundamental security capabilities of the system, as well as ensuring that any initial principles established for the system are adhered to as development proceeds, and/or as vendors are selected and perhaps replaced over time.
There are multitudes of books written on security from an engineering, architecture, and development perspective. The tools, techniques, and capabilities evolve quickly every year, which is why having a fundamental business understanding based on a stable framework of risk and control is essential.
This is a book on management, so we are not covering technical security practices and principles, just as we are not covering specific programming languages or distributed systems engineering specifics. Studying for the CISSP exam will provide both an understanding of security management, as well as current technical topics. A glance at the CISSP Guide shows how involved such topics can be:
-
The Harrison-Rizzo-Ullman security model
-
The Diffie-Hellman Asymmetrical Encryption Algorithm
-
Functions and Protocols in the OSI Model
Again, the issue is mapping such technical topics to the fundamentals of risk and control. Key topics we note here include:
-
Authentication and authorization
-
Network security
-
Cryptography
Authentication and authorization are the cornerstones of access; i.e., the gateway to the asset. Authentication confirms that a person is who they say they are. Authorization is the management of their access rights (can they see the payroll? reset others' passwords?).
Network security is a complex sub-domain in and of itself. Because attacks typically transpire over the Internet and/or internal organizational networks, the structure and capabilities of networks are of critical concern, including topics such as:
-
Routing
-
Firewalls
-
The Domain Name Service
Finally, cryptography is the “storage and transmission of data in a form that only those it is intended for can read and process” [124].
All of these topics require in-depth study and staff development. As of the time of writing, there is a notable shortage of skilled security professionals. Therefore, a critical risk is that your organization might not be able to hire people with the needed skills (consider our section on resource management).
Security is a concern throughout the systems lifecycle. You already know this. Otherwise, you would not have reached enterprise scale. But now you need to formalize it with some consistency, as that is what regulators and auditors expect, and it also makes it easier for your staff to work on various systems.
Security should be considered throughout the SDLC, including systems design, but this is easier said than done. Organizations will always be more interested in a system’s functionality than its security. However, a security breach can ruin a company.
The CISSP recommends (among other topics) consideration of the following throughout the systems lifecycle:
-
The role of environmental (e.g., OS-level) safeguards versus internal application controls
-
The challenges of testing security functionality
-
Default implementation issues
-
Ongoing monitoring
Increasingly important controls during the construction process in particular are:
-
Code reviews
-
Automated code analysis
Finally, we previously discussed the Netflix Simian Army, which can serve as a form of security control.
Vendors come and go in the digital marketplace, offering thousands of software-based products across every domain of interest (we call this the technology product lifecycle). Inevitably, these products have security errors. A vendor may issue a “patch” for such an error, which must be applied to all instances of the running software. Such patches are not without risk, and may break existing systems; they, therefore, require testing under conditions of urgency.
Increasingly, software is offered as a service, in which case it is the vendor responsibility to patch their own code. But what if they are slow to do this? Any customer relying on their service is running a risk, and other controls may be required to mitigate the exposure.
One important source of vulnerabilities is the National Vulnerability Database supported by the NIST. In this database, you can look up various products and see if they have known security holes. Using the National Vulnerability Database (NVD) is complex and not something that can be simply and easily “implemented” in a given environment, but it does represent an important, free, taxpayer-supported resource of use to security managers.
An important type of vulnerability is the “zero-day” vulnerability. With this kind of vulnerability, knowledge of a security “hole” becomes widespread before any patches are available (i.e., the software’s author and users have “zero days” to create and deploy a fix). Zero-day exploits require the fast and aggressive application of alternate controls, which leads us to the topic of security operations.
6.4.1.5.4. Integration of Security and Safety
The digital enterprise is becoming increasingly complex. Technological artifacts are embedded into organizations and social systems to form complex socio-technical systems. Unanticipated combinations of events can create losses that can become catastrophic. For example, autonomous vehicles are involved in deadly accidents, the power grid is threatened by viruses, or cybercriminals take hospitals hostage.
Traditional safety and security analysis techniques are increasingly less effective because they were created for a simpler world where linear event chains and statistical tools were sufficient. New safety and security analysis techniques that are based on systems theory are a better fit to address the digital enterprise challenges.
In a digital world we recommend modeling the enterprise as a complex socio-technical system and use an integrated approach to both security and safety. Young and Leveson [311] advocate this approach.
The integrated approach addresses losses due to intentional and unintentional actions: “Safety experts see their role as preventing losses due to unintentional actions by benevolent actors. Security experts see their role as preventing losses due to intentional actions by malevolent actors. The key difference is the intent of the actor that produced the loss event.”
This approach makes a more efficient use of resources. It also provides a high-level strategic analysis that prevents being stuck too early into tactical problems before the big picture is established. The Systems Theoretic Process Analysis (STPA) Handbook (published in March 2018), authored by Nancy G. Leveson and John P. Thomas, develops a systemic and integrated method to manage safety and security hazards.
STPA advocates the modeling of a controller to enforce constraints on the behavior of the system. Controls are not limited to the technology or process sphere; they can also include social controls.
6.4.1.5.5. Security Operations
Networks and computing environments are evolving entities; just because they are secure one week does not mean they are secure three weeks later.
Guide to the CISSP
Security requires ongoing operational attention. Security operations is first and foremost a form of operations, as discussed in Section 6.2.3, “Operations Management”. It requires on-duty and on-call personnel, and some physical or virtual point of shared awareness (for example, a physical Security Operations Center, perhaps co-located with a Network Operations Center). Beyond the visible presence of a Security Operations Center, various activities must be sustained. These can be categorized into four major areas:
-
Prevention
-
Detection
-
Response
-
Forensics
An organization’s understanding of what constitutes a “secure” system is continually evolving. New threats continually emerge, and the alert security administrator has an ongoing firehose of bulletins, alerts, patch notifications, and the like to keep abreast of.
These inputs must be synthesized by an organization’s security team into a set of security standards for what constitutes a satisfactorily configured (“hardened”) system. Ideally, such standards are automated into policy-driven systems configuration approaches; in less ideal situations, manual configuration — and double-checking — is required.
Prevention activities include:
-
Maintaining signatures for intrusion detection and anti-virus systems
-
Software patching (e.g., driven by the technology product lifecycle and updates to the National Vulnerability Database)
-
Ongoing maintenance of user authorizations and authentication levels
-
Ongoing testing of security controls (e.g., firewalls, configurations, etc.)
-
Updating security controls appropriately for new or changed systems
There are many kinds of events that might indicate some security issue; systems exposed to the open Internet are continually scanned by a wide variety of often-hostile actors. Internal events, such as unscheduled/unexplained system restarts, may also indicate security issues. The challenge with security monitoring is identifying patterns indicating more advanced or persistent threats. When formalized, such patterns are called “signatures”.
One particular form of event that can be identified for systems under management is configuration state change.
For example, if a core OS file — one that is well known and not expected to change — changes in size one day with no explanation, this might be indicative of a security exploit. Perhaps an attacker has substituted this file with one containing a “backdoor” allowing access. Tools such as Tripwire are deployed to scan and inventory such files and key information about them (“metadata”) and raise alerts if unexpected changes occur. Infrastructure managers such as Chef and Puppet may also serve as inputs into security event management systems; for example, they may detect attempts to alter critical configuration files and, in their re-converging the managed resource back to its desired state can be a source of valuable information about potential exploits. Such tools also may be cited as controls for various kinds of security risks.
We have discussed the importance of configuration management in both Digital Infrastructure and Section 6.2.3, “Operations Management”. In Digital Infrastructure, we discussed the important concept of Infrastructure as Code and policy-driven configuration management; we revisited the importance of configuration management from an operational perspective in Section 6.2.3.1.3, “State and Configuration”. Configuration management also will re-appear in Section 6.4.2, “Information Management” and Section 6.4.3, “Architecture”.
|
Important
|
It should be clear by now that configuration management is one of the most critical enabling capabilities for digital management, regardless of whether you look to traditional ITSM practices or modern DevOps approaches. |
Detection activities include:
-
Monitoring events and alerts from intrusion detection and related operational systems
-
Analyzing logs and other artifacts for evidence of exploits
Security incidents require responses. Activities include:
-
Declaring security incidents
-
Marshaling resources (staff, consultants, law enforcement) to combat
-
Developing immediate tactical understanding of the situation
-
Developing a response plan, under time constraints
-
Executing the plan, including ongoing monitoring of effectiveness and tactical correction as needed
-
Keeping stakeholders informed as to situation
Finally, security incidents require careful after-the-fact analysis:
-
Analyzing logs and other artifacts for evidence of exploits
-
Researching security incidents to establish causal factors and develop new preventative approaches (thus closing the loop)
As with operations as a whole, there is ongoing monitoring and reporting to various stakeholders, and interaction with other processes.
One of the most important operational processes from a security perspective is change management. Configuration state changes (potentially indicating an exploit in progress) should be reconciled first to change management records. Security response may also require emergency change processes. ITSM event and incident management may be leveraged as well.
|
Note
|
The particular concerns of security may interfere with cross-process coordination. This is a topic beyond the scope of this document. |
6.4.1.5.6. Security and Assurance
Quis custodiet ipsos custodes?
Given the critical importance of security in digital organizations, it is an essential matter for governance attention at the highest levels.
Security management professionals are accountable to governance concerns just as any other manager in the digital organization. Security policies, processes, and standards are frequently audited, by both internal auditors as well as external assurance professionals (not only auditors but other forms of assurance as well).
The idea that an “assets protection” group might itself be audited may be hard to understand, but security organizations such as police organizations have Internal Affairs units for just such purposes.
Security auditors might review the security processes mentioned above, or system configuration baselines, or log files, or any number of other artifacts, depending on the goals and scope of a security audit. Actual penetration testing is a frequently used approach: the hiring of skilled “white-hat” hackers to probe an organization’s defenses. Such hackers might be given license to probe as far as they possibly can and return with comprehensive evidence of what they were able to access (customer records, payrolls, account numbers, and balances, etc.).
6.4.1.5.7. Emerging Topics
As AI plays an increasing role in the digital enterprise, it creates new hazards and can at the same time help fight security threats. Forbes warned its readers that good bots can go bad and articles raise chatbot security concerns.
At the same time, Machine Learning techniques applied to cybersecurity are developed; for example, “Machine Learning and Security: Protecting Systems with Data and Algorithms" published by O’reilly Media, February 16, 2018.
Will this end the cat-and-mouse game between attackers and defenders? Or fuel a new security arm race? The jury is still out. That is why an holistic approach to security and safety problems is required. It provides the context and guidance to better control a digital world where automation and AI changes the game.
Evidence of Notability
Securing valuable assets and capabilities from unintentional and intentional harm has been a concern of the human race since time immemorial. Digital systems provide attractive targets and their security has been of interest since their first uses.
Limitations
Like risk more broadly, security must balance against value at risk, or otherwise it can degenerate into theater.
Related Topics
6.4.1.6. Digital Governance
Description
The legacy of IT governance is wide, deep, and often wasteful. Approaches based on mis-applied Taylorism and misguided, CMM-inspired statistical process control have resulted in the creation of ineffective, large-scale IT bureaucracies whose sole mission seems to be the creation and exchange of non-value-add secondary artifacts, while lacking any clear concept of an execution model.
What is to be done? Governance will not disappear any time soon. Simply arguing against governance is unlikely to succeed. Instead, this document argues the most effective answer lies in a re-examination of the true concerns of governance:
-
Sustaining innovation and effective value delivery
-
Maintaining efficiency
-
Optimizing risk
These fundamental principles (“top-line”, “bottom-line”, “risk”) define value for organizations around the world, whether for-profit, non-profit, or governmental. After considering the failings of IT governance, we will re-examine it in light of these objectives and come up with some new answers for the digital era.
From the perspective of Digital Transformation, there are many issues with traditional IT governance and the assumptions and practices characterizing it.
6.4.1.6.1. The New Digital Operating Model
Consider the idea of “programmability” mentioned at the start of this Competency Category. A highly “programmable” position is one where the responsibilities can be specified in terms of their activities. And what is the fundamental reality of Digital Transformation? It is no accident that such positions are called “programmable”. In fact, they are being “programmed away” or “eaten by software" — leaving only higher-skill positions that are best managed by objective, and which are more sensitive to cultural dynamics.
Preoccupation with “efficiency” fades as a result of the decreasingly “programmable” component of work. The term “efficiency” signals a process that has been well defined (is “programmable”) to the point where it is repeatable and scalable. Such processes are ripe for automation, commoditization, and outsourcing, and this is in fact happening.
If the repetitive process is retained within an organization, the drive for efficiency leads to automation and, eventually, efficiency is expressed through concerns for capacity management and the consumption of computing resources. And when such repetitive concerns are not retained by the organization, but instead become a matter of sourcing rather than execution, the emphasis shifts to risk management and governance of the supplier.
The remaining uncertain and creative processes should not just be managed for “efficiency" and need to be managed for effectiveness, including fast feedback, collaboration, culture, and so forth.
6.4.1.6.2. Project versus Operations as Operating Model
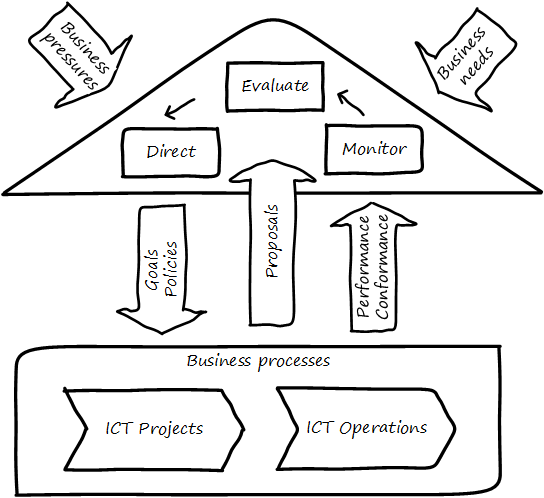
As we can see illustrated in Figure 128, “Governance Based on Project versus Operations” (similar to [155]), ISO/IEC 38500 assumes a specific IT operating model, one in which projects are distinct from operations. We have discussed the growing influence of product-centric digital management throughout this document, but as of the time of writing the major IT governance standard still does not recognize it. The ripple effects are seen throughout other guidance and commentary. In particular, the project-centric mindset is closely aligned with the idea of IT and the CIO as primarily order-takers.
6.4.1.6.3. CIO as Order-Taker
Throughout much of the IT governance guidance, certain assumptions become evident:
-
There is an entity that can be called “the Business”
-
There is a distinct entity called “IT” (for “Information Technology”)
-
It is the job of “IT” to take direction (i.e., orders) from “the Business” and to fulfill them
-
There is a significant risk that “IT” activities (and by extension, dollars spent on them) may not be correctly allocated to the preferred priorities of “the Business”; IT may spend money unwisely, on technology for its own sake, and this risk needs to be controlled
-
The needs of “the Business” can be precisely defined and it is possible for “IT” to support those needs with a high degree of predictability as to time and cost; this predictability is assumed even when those activities imply multi-million dollar investments and months or years of complex implementation activities
-
When such activities do not proceed according to initial assumptions, this is labeled an "IT failure”; it is assumed that the failure could have been prevented through more competent management, “rigorous” process, or diligent governance, especially on the IT side
There may be organizations where these are reasonable assumptions. (This document does not claim they do not exist.) But there is substantial evidence for the existence of organizations for whom these assumptions are untrue.
6.4.1.6.4. The Fallacies of “Rigor” and Repeatability
One of the most critical yet poorly understood facts of software development and by extension complex digital system innovation is the impossibility of “rigor”. Software engineers are taught early that “completely” testing software is impossible [161], yet it seems that this simple fact (grounded in fundamentals of computer science and information theory) is not understood by many managers.
A corollary fallacy is that of repeatable processes, when complexity is involved. We may be able to understand repeatability at a higher level, through approaches like case management or the Checklist Manifesto's submittal schedules, but process control in the formal sense within complex, R&D-centric digital systems delivery is simply impossible, and the quest for it is essentially cargo cult management.
And yet IT governance discussions often call for "repeatability" (e.g., [198 p. 6]), despite the fact that value that can be delivered “repeatably”, “year after year” is for the most part commodity production, not innovative product development. Strategy is notably difficult to commoditize.
Another way to view this is in terms of the decline of traditional IT. As you review those diagrams, understand that much of IT governance has emerged from the arguably futile effort to deliver product innovation in a low-risk, “efficient” manner. This desire has led, as Ambler and Lines note at the top of this Competency Category, to the creation of layers and layers of bureaucracy and secondary artifacts.
The cynical term for this is “theater”, as in an act that is essentially unreal but presented for the entertainment and distraction of an audience.
As we noted above, a central reality of Digital Transformation is that commoditized, predictable, programmable, repeatable, “efficient” activities are being quickly automated, leaving governance to focus more on the effectiveness of innovation (e.g., product development) and management of supplier risk. Elaborate IT operating models specifying hundreds of interactions and deliverables, in a futile quest for "rigor” and “predictability”, are increasingly relics of another time.
6.4.1.6.5. Digital Effectiveness
Let’s return to the first value objective: effectiveness. We define effectiveness as “top-line” benefits: new revenues and preserved revenues. New revenues may come from product innovation, as well as successful marketing and sales of existing products to new markets (which itself is a form of innovation).
Traditionally, “back-office” IT was rarely seen as something contributing to effectiveness, innovation, and top-line revenue. Instead, the first computers were used to increase efficiency, through automating clerical work. The same processes and objectives could be executed for less money, but they were still the same back-office processes.
With Digital Transformation, product innovation and effectiveness is now a much more important driver. Yet product-centric management is still poorly addressed by traditional IT governance, with its emphasis on distinguishing projects from operations.
One tool that becomes increasingly important is a portfolio view. While PMOs may use a concept of “portfolio” to describe temporary initiatives, such project portfolios rarely extend to tracking ongoing operational benefits. Alternative approaches also should be considered such as the idea of an options approach.
6.4.1.6.6. Digital Efficiency
Efficiency is a specific, technical term, and although often inappropriately prioritized, is always an important concern. Even a digitally transforming, product-centric organization can still have governance objectives of optimizing efficiency. Here are some thoughts on how to re-interpret the concept of efficiency.
One way in which digital organizations can become more efficient is to consolidate development as much as possible into common pipelines. Traditionally, application teams have owned their own development and deployment pipelines, at the cost of great, non-value add variability. Even centralizing source control has been difficult.
This is challenging for organizations with large legacy environments, but full lifecycle pipeline automation is becoming well understood across various environments (including the mainframe).
Another way of increasing efficiency is to standardize integration protocols across internal services, as Amazon has done. This reduces the need for detailed analysis of system interaction approaches every time two systems need to exchange data. This is a form of reducing transaction costs and therefore consistent with Coase’s theory of the firm [63].
Within the boundary of a firm, a collaboration between internal services should be easier because of reduced transaction costs. It is not hard to see that this would be the case for digital organizations: security, accounting, and CRM would all be more challenging and expensive for externally-facing services.
However, since a firm is a system, a service within the boundaries of a firm will have more constraints than a service constrained only by the market. The internal service may be essential to other, larger-scoped services, and may derive its identity primarily from that context.
Because the need for the service is well understood, the engineering risk associated with the service may also be reduced. It may be more of a component than a product. See the parable of the the Flower and the Cog. Reducing service redundancy is a key efficiency goal within the bounds of a system — more to come on this in Section 6.4.3, “Architecture”.
Processes require ongoing scrutiny. The term "organizational scar tissue” is used when specific situations result in new processes and policies, that in turn increase transactional friction and reduce efficiency throughout the organization.
Processes can be consolidated, especially if specific procedural detail can be removed in favor of larger-grained case management or Checklist Manifesto concepts including the submittal schedule. As part of eventual automation and Digital Transformation, processes can be ranked as to how “heavyweight” they are. A typical hierarchy, from “heaviest” to “lightest”, might be:
-
Project
-
Release
-
Change
-
Service request
-
Automated self-service
The organization might ask itself:
-
Do we need to manage this as a project? Why not just a release?
-
Do we need to manage this as a release? Why not just a change?
-
Do we need to manage this as a change? Why not just a service request?
-
Do we need to manage this as a service request? Why is it not fully automated self-service?
There may be a good reason to retain some formality. The point is to keep asking the question. Do we really need a separate process? Or can the objectives be achieved as part of an existing process or another element?
A steam engine’s governor imposes some load, some resistance, on the engine. In the same way, governance activities and objectives, unless fully executed by the directing body (e.g., the Board), themselves impose a demand on the organization.
This points to the importance of having a clear demand/execution framework in place to manage governance demand. The organization does not have an unlimited capacity for audit response, reporting, and the like. In order to understand the organization as a system, governance demand needs to be tracked and accounted for and challenged for efficiency just as any other sort of demand.
Finally, efficiency asks: can we leverage the digital pipeline itself to achieve governance objectives? This is not a new idea. The governance/management interface must be realized by specific governance elements, such as processes. Processes can (and often should) be automated. Automation is the raison d’etre of the digital pipeline; if the process can be expressed as user stories, behavior-driven design, or other forms of requirement, it simply is one more state change moving from dev to ops.
In some cases, the governance stories must be applied to the pipeline itself. This is perhaps more challenging, but there is no reason the pipeline itself cannot be represented as code and managed using the same techniques. The automated elements then can report their status up to the monitoring activity of governance, closing the loop. Auditors should periodically re-assess their effectiveness.
6.4.1.6.7. Digital Risk Management
Finally, from an IT governance perspective, what is the role of IT risk management in the new digital world? It’s not that risk management goes away. Many risks that are well understood today will remain risks for the foreseeable future. But there are significant new classes of risk that need to be better understood and managed:
-
Unmanaged demand and disorganized execution models leading to multi-tasking, which is destructive of value and results
-
High queue wait states, resulting in uncompetitive speed to deliver value
-
Slow feedback due to large batch sizes, reducing effectiveness of product discovery
-
New forms of supplier risk, as services become complex composites spanning the Internet ecosystem
-
Toxic cultural dynamics destructive of high team performance
-
Failure to incorporate cost of delay in resource allocation and work prioritization decisions
All of these conditions can reduce or destroy revenues, erode organizational effectiveness, and worse. It is hard to see them as other than risks, yet there is little attention to such factors in the current “best practice” guidance on risk.
In today’s digital governance there must be a greater concern for outcome and effectiveness, especially in terms of time-to-market (minimizing cost of delay). Previously, concerns for efficiency might lead a company to overburden its staff, resulting in queuing gridlock, too much work-in-process, destructive multi-tasking, and ultimately failure to deliver timely results (or deliver at all).
Such failure to deliver was tolerated because it seemed to be a common problem across most IT departments. Also relevant is the fact that Digital Transformation had not taken hold yet. IT systems were often a back office, and delays in delivering them (or significant issues in their operation) were not quite as damaging.
Now, the effectiveness of delivery is essential. The interesting, and to some degree unexpected result, is that both efficiency and risk seem to be benefiting as well. Cross-functional, focused teams are both more effective and more efficient, and able to manage risk better as well. Systems are being built with both increased rapidity as well as improved stability, and the automation enabling this provides robust audit support.
We have covered culture in some depth in Section 6.3.1, “Coordination and Process”. Briefly, from a governance perspective:
The importance of organizational culture has been discussed by management thinkers since at least W. Edwards Deming. In a quote often attributed to Peter Drucker: “culture eats strategy for breakfast”. But it has been difficult at best to quantify what we mean by culture.
Quantify? Some might even say quantification is impossible. But Google and the State of DevOps research have done so. Google has established the importance of psychological safety in forming effective, high-performing teams [242]. And the State of DevOps research, applying the Westrum typology, has similarly confirmed that pathological, controlling cultures are destructive of digital value [224].
These facts should be taken seriously in digital governance discussions. So-called “toxic” leadership (an increasing concern in the military itself [293]) is destructive of organizational goals and stakeholder value. It can be measured and managed and should be a matter of attention at the highest levels of organizational governance.
We have already covered contracting in terms of software and cloud. But in terms of the emergence model, it is typical that companies enter into contracts before having a fully mature sourcing and contract management capability with input from the GRC perspective.
We have touched on the issues of cloud due diligence and sourcing and security in this Competency Area. The 2e2 case discussed is interesting; it seems that due diligence had actually been performed. Additional controls could have made a key difference, in particular business continuity planning.
There are a wide variety of supplier-side risks that must be managed in cloud contracts:
-
Access
-
Compliance
-
Data location
-
Multi-tenancy
-
Recovery
-
Investigation
-
Viability (assurance)
-
Escrow
We have emphasized throughout this document the dynamic nature of digital services. This presents a challenge for risk management of digital suppliers. This year’s audit is only a point-in-time snapshot; how to maintain assurance with a fast-evolving supplier? This leading edge of cloud sourcing is represented in discussions such as “Dynamic certification of cloud services: Trust, but verify!":
The on-demand, automated, location-independent, elastic, and multi-tenant nature of cloud computing systems is in contradiction with the static, manual, and human process-oriented evaluation and certification process designed for traditional IT systems …
Common certificates are a backward look at the fulfillment of technical and organizational measures at the time of issue and therefore represent a snapshot. This creates a gap between the common certification of one to three years and the high dynamics of the market for cloud services and providers.
The proposed dynamic certification approach adopts the common certification process to the increased flexibility and dynamics of cloud computing environments through using automation potential of security controls and continuous proof of the certification status [180].
It seems likely that such ongoing dynamic evaluation of cloud suppliers would require something akin to Simian Army techniques, discussed below.
Beyond increasing supply-side dynamism, risk management in a full Supplier Integration and Management (SIAM) sense is compounded by the complex interdependencies of the services involved. All of the cloud contracting risks need to be covered, as well as further questions such as:
-
If a given service depends on two sub-services (“underpinning contracts”), what are the risks for the failure of either or both of the underpinning services?
-
What are the controls?
6.4.1.6.8. Automating Digital Governance
One governance principle we will suggest here is to develop a governance architecture as an inherent part of the delivery system, not as an additional set of activities. We use the concept of “digital exhaust” to reinforce this.
Digital exhaust, for the purposes of this document, consists of the extraneous data, and information that can be gleaned from it, originating from the development and delivery of IT services.
Consider an automobile’s exhaust. It does not help you get to where you are going, but it is an inevitable aspect of having an internal combustion engine. Since you have it, you can monitor it and gain certain insights as to whether your engine is running efficiently and effectively. You might even be able to identify if you are at risk of an engine failure.
The term “digital exhaust” is also applied to the data generated from the IoT. This usage is conceptually aligned to our usage here, but somewhat different in emphasis.
To leverage digital exhaust, focus on the critical, always-present systems that enable digital delivery:
-
In Digital Infrastructure we introduced the concept of version control
-
In Section 6.1.3, “Application Delivery” we introduced the idea of a continuous delivery pipeline
-
In Section 6.2.3, “Operations Management” we introduced monitoring as part of operations
These systems constitute a core digital pipeline, one that can be viewed as an engine producing digital exhaust. This is in contrast to fragmented, poorly automated pipelines, or organizations with little concept of pipeline at all. Such organizations end up relying on secondary artifacts and manual processes to deliver digital value.
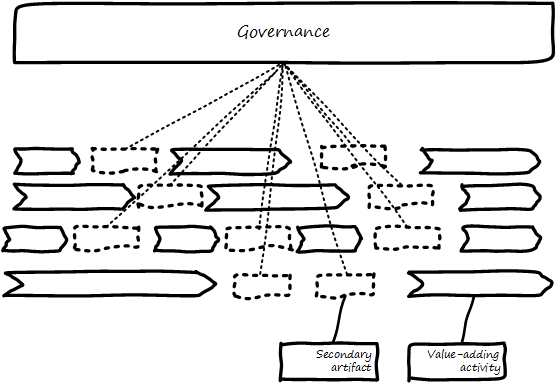
The illustration in Figure 129, “Governance Based on Activities and Artifacts” represents fragmented delivery pipelines, with many manual processes, activities, and secondary artifacts (waterfall stage approvals, designs, plans, manual ticketing, and so forth). Much IT governance assumes this model, and also assumes that governance must often rely on aggregating and monitoring the secondary artifacts.
In contrast (see Figure 130, “Governance of Digital Exhaust”), with a rationalized continuous delivery pipeline, governance increasingly can focus on monitoring the digital exhaust.
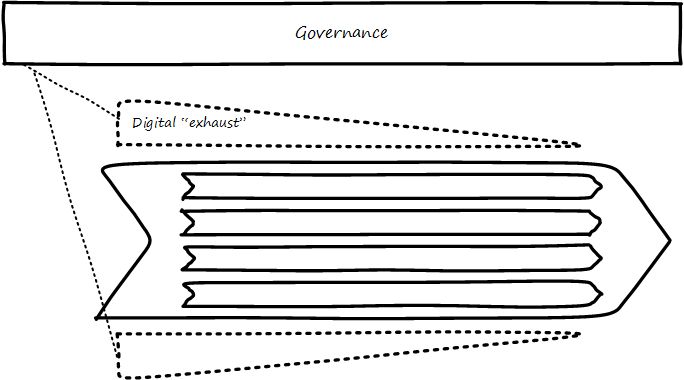
What can we monitor with digital exhaust for the purposes of governance?
-
Development team progress against backlog
-
Configuration management
-
Conformance to architectural standards (through inspection of source and package managers, code static analysis, and other techniques)
-
Complexity and technical debt
-
Performance and resource consumption of services
-
Performance of standards against automated hardening activities (e.g., Simian Army)
As noted above, certain governance objectives may require the pipeline itself to be adapted; e.g., the addition of static code analysis, or implementation of hardening tools such as Simian Army.
The DevOps Audit Toolkit provides an audit perspective on pipeline automation [85]. This report provides an important set of examples demonstrating how modern DevOps toolchain automation can fulfill audit objectives as well or better than “traditional” approaches. This includes a discussion of alternate approaches to the traditional control of “separation of duties” for building and deploying code. These approaches include automated code analysis and peer review as a required control.
There are a variety of ways the IT pipeline can be automated. Many components are seen in real-world pipelines:
-
Source repositories
-
Build managers
-
Static code analyzers
-
Automated user interface testing
-
Load testing
-
Package managers
-
More sophisticated continuous deployment infrastructure
and much more.
Additionally, there may still be a need for systems that are secondary to the core pipeline:
-
Service or product portfolio
-
Workflow and Kanban-based systems (one notable example is workflow to ensure peer review of code)
-
Document management
There may also be a risk repository if the case can’t be made to track risks using some other system. The important thing to remember when automating risk management is that risks are always with respect to some thing.
A risk repository needs to be integrated with subject inventories, such as the Service Portfolio and relevant source repositories and entries in the package manager. Otherwise, risk management will remain an inefficient, highly manual process.
What are the things that may present risks?
-
Products/services
-
Their ongoing delivery
-
Their changes and transformations (releases)
-
Their revenues
-
-
Customers and their data
-
Employees and their positions
-
Assets
-
Vendors
-
Other critical information
Evidence of Notability
There is substantial friction between classical governance concerns and new digital operating models. See Jez Humble’s Lean Enterprise for one discussion [138]. The DevOps Audit Defense Toolkit provides another window into this topic [85].
Limitations
The Lean and Agile challenge to governance arises primarily in R&D-centric environments. Classic governance practices are well suited for purely operational environments, where they have been honed over decades.
Related Topics
6.4.2. Information Management
Area Description
Information is nothing new to the scaling digital organization. Like other topics in this document in the enterprise context, the digital organization has been managing information in some way since the earliest days of your organization.
Perhaps the company started by offering a social media-oriented service. It needed to track users and their activity. Or perhaps it started off with a focus on data science and analytics; the first product was based on harvesting insights from large data sets. Just as this document does not cover the specifics of programming languages or technical architectures, it also leaves the more technical aspects of data science and analytics to other guidance.
However, it is at the largest scale that organizations require the establishment of formal governance, control, and management techniques for information as a distinct and coherent problem domain. Before, the practitioner might have been interested in “customer data” or “sales data” or “supply chain data”. Now, they are concerned with data in general, and how to manage it, wherever and whatever it is.
They are also concerned with information, knowledge, records, reports, and a wide variety of other overlapping, and often difficult to define, concepts.
Information is the lifeblood of business. Simple records are the foundation of survival: lose the customer’s order, and the business won’t be in business long. Beyond such basics, the insights that can be gained from your data are increasingly critical competitive advantage. Whether or not the company started with a focus on data science, it probably has data scientists at this level of scale.
The sheer scale of the data is starting to become unmanageable. It costs money to store, and how much is needed? Lawyers start questioning whether it is truly necessary to keep certain data indefinitely; they seem to think there is risk there.
We are also periodically confronted with seemingly wasteful duplication of data — isn’t it possible to be a bit more efficient? Quality and security concerns are also increasing. We see competitors go out of business due to cyberattacks, and pervasive data quality issues also can be a serious threat to your operations and customer relationships.
Yet, when attempts are made to manage for more efficient or better-governed uses of data, the resulting cost and bureaucracy cause concern (not to mention receiving complaints about development delays and loss of business agility). It is an ongoing challenge, and it does not seem anyone anywhere has it entirely figured out.
|
Important
|
As with other Competency Areas in this document, this Competency Area will introduce this topic “on its own terms”. It will then add additional context and critique in subsequent Competency Categories. |
6.4.2.1. Information and Value
Description
6.4.2.1.1. The Origins of Digital Information
Writing provides a way of extending human memory by imprinting information into media less fickle than the human brain.
We have talked of representation previously, in the context of task management. Common representation is essential to achieving common ground when human interactions are time or space-shifted. Understanding representation is fundamental to understanding information.
Humans have been representing information since at least the creation of writing. As early as 3000 BCE, the ancient Sumerians used cuneiform to record information. Cuneiform was created by pressing wedge-shaped sticks into wet clay. A particular impression or set of impressions corresponded to a citizen, or how much grain they grew, or how much beer they received. Certainly, the symbols shown are not the same as the beer, or the grain, or the long-dead Sumerian. This may seem obvious, but it can be tempting to confuse the representation with the reality. This is known as the reification fallacy.
6.4.2.1.2. The Measurable Value of Information
All information management can be understood as a reduction in uncertainty. And we can and should quantify the value of having the information versus the cost of capturing and maintaining it.
Doug Hubbard, in the classic How to Measure Anything [134], asks the following questions when the measurement is proposed (p.47):
-
What is the decision this measurement is supposed to support?
-
What is the definition of the thing being measured in terms of observable consequences?
-
How, exactly, does this thing matter to the decision being asked?
-
How much do you know about it now (i.e., what is your current level of uncertainty)?
-
What is the value of additional information?
As he states: “All measurements that have value must reduce the uncertainty of something that affects some decision with economic consequences.” While Hubbard is proposing these questions in the context of particular analysis initiatives, they are also excellent questions to ask of any proposal to manage information or data.
Information management, in the context of digital systems, adds value through improving efficiency, effectiveness, and optimizing risk (our three primary categories of value). Since digital systems started off primarily as efficiency aids, we will discuss efficiency first.
6.4.2.1.3. Information, Efficiency, and Effectiveness
We have periodically discussed historical aspects of computing and digital systems, but not yet covered some of the fundamental motivations for their invention and development.
As technology progressed through the late 19th and early 20th centuries, applied mathematics became increasingly important in a wide variety of areas such as:
-
Ballistics (e.g., artillery) calculations
-
Cryptography
-
Atomic weapons
-
Aeronautics
-
Stress and load calculations
Calculations were performed by “computers”. These were not automated devices, but rather people, often women, tasked with endless, repetitive operation of simple adding machines, by which they manually executed tedious calculations to compile (for example) tables of trigonometric angles.
It was apparent at least since the mid-19th century that it would be possible to automate such calculation. In fact, mathematical devices had long existed; for example, the abacus, Napiers' Bones, and the slide rule. But such devices had many limitations. The vision of automating digital calculations first came to practical realization through the work of Charles Babbage and Ada Lovelace, who took significant steps through the design and creation of the Difference and Analytical Engines.
After Babbage, the development of automated computation encountered a hiatus. Purely mechanical approaches based on gears and rods could not scale, and the manufacturing technology of Babbage’s day was inadequate to his visions — the necessary precision and power could not be achieved by implementing a general-purpose computer using his legions of gears, cams, and drive shafts. However, mathematicians continued to explore these areas, culminating in the work of Alan Turing who established both the potential and the limits of computing, initially as a by-product of investigations into certain mathematical problems of interest at the time.
Around the same time, the legendary telecommunications engineer Claude Shannon had developed essential underpinning engineering in expressing Boolean logic in terms of electronic circuits, and rigorous mathematical theory describing the fundamental characteristics and limitations of information transmission (e.g., the physical limits of copying one bit of data from one location from another) [254]. Advances in materials and manufacturing techniques resulted in the vacuum tube, ideally suited to the combination of Shannon digital logic with Turing’s theories of computation, and thus the computer was born. It is generally recognized that the first practical general-purpose computer was developed by the German Konrad Zuse.
Turing and a fast-growing cohort of peers driven by (among other things) the necessities of World War II developed both theory and the necessary practical understandings to automate digital computation. The earliest machines were used to calculate artillery trajectories. During World War II, mathematicians and physicists such as John von Neumann recognized the potential of automated computation, and so computers were soon also used to simulate nuclear explosions. This was a critical leap beyond the limits of manual “computers” pounding out calculations on adding machines.
The business world was also attentive to the development of computers. Punched cards had been used for storing data for decades preceding the invention of automated computers. Record-keeping at scale has always been challenging — the number of Sumerian clay tablets still in existence testifies to that! Industrial-era banks, insurers, and counting-houses managed massive repositories of paper journals and files, at great cost. A new form of professional emerged: the "white collar worker.
Any means of reducing the cost of this record-keeping was of keen interest. Paper files were replaced by punched cards. Laborious manual tabulation was replaced by mechanical and electro-mechanical techniques, that could, for example, calculate sums and averages across a stack of punched cards, or sort through the stack, compare it against a control card, and sort the cards accordingly.
During World War II, many business professionals found themselves in the military, and some encountered the new electronic computers being used to calculate artillery trajectories or decrypt enemy messages. Edmund Berkeley, the first secretary of the Association for Computing Machinery, was one such professional who grasped the potential of the new technology [11]. After the war, Berkeley advocated for the use of these machines to the leadership of the Prudential insurance company in the US, while others did the same with firms in the UK.
What is the legacy of Babbage and Lovelace and their successors in terms of today’s digital economy? The reality is that digital value for the first 60 years of fully automated computing systems was primarily in service of efficiency. In particular, record-keeping was a key concern. Business computing (as distinct from research computing) had one primary driver: efficiency. Existing business models were simply accelerated with the computer. 300 clerks could be replaced by a $10 million machine and a staff of 20 to run it (at least, that was what the sales representative promised). And while there were notable failures, the value proposition held up such that computer technology continued to attract the necessary R&D spending, and new generations of computers started to march forth from the laboratories of Univac, IBM, Hewlett-Packard, Control Data, Burroughs, and others.
Efficiency ultimately is only part of the business value. Digital technology relentlessly wrings out manual effort, and this process of automation is now so familiar and widespread that it is not necessarily a competitive advantage. Harvard Business Review editor Nicholas Carr became aware of this in 2003. He wrote a widely discussed article “IT Doesn’t Matter” in which he argued that: “When a resource becomes essential to competition but inconsequential to strategy, the risks its creates become more important than the advantages it provides.” [56]. Carr compared IT to electricity, noting that companies in the early 20th century had vice-presidents of electricity and predicting the same for CIOs. His article provoked much discussion at the time and remains important and insightful. Certainly, to the extent IT’s value proposition is coupled only to efficiency (e.g., automating clerical operations), IT is probably less important to strategy.
But as we have discussed throughout this document, IT is permeating business operations, and the traditional CIO role is in question as mainstream product development becomes increasingly digital. The value of correctly and carefully applied digital technology is more variable than the value of electricity. At this 2018 writing, the five largest companies by market capitalization — Apple, Amazon, Google, Facebook, and Microsoft — are digital firms, based on digital products, the result of digital strategies based on correct understanding and creative application of digital resources.
In this world, information enables effectiveness as much as, or even more than, efficiency.
6.4.2.1.4. The Importance of Context
Information management as we will discuss in the rest of this Competency Area arises from the large-scale absorption of data into highly efficient, miniaturized, automated digital infrastructures with capacity orders of magnitude greater than anything previously known. However, cuneiform and quipu, hash marks on paper, financial ledgers, punched cards, vacuum tubes, transistors, and hard disks represent a continuum, not a disconnected list. Whether we are looking at a scratch on a clay tablet or the magnetic state of some atoms in a solid state drive, there is one essential question:
What do we mean by that?
Consider the state of those atoms on a solid state drive. They represent the numbers 547. But without context, that number is meaningless. It could be:
-
The numeric portion of a street address
-
A piece of a taxpayer identification number
-
The balance on a bank account
-
A piece of the data uniquely identifying DNA in a crime
The state of this data may have significant consequences. A destination address might be wrong, a tax return mis-identified. A credit card might be accepted or declined. A mortgage might be approved or denied. Or the full force of the law may be imposed on an offender, including criminal penalties resulting from a conviction on the evidence stored in the computer.
The COBIT Enabling Information guide [145] proposes a layered approach to this problem:
| Layer | Implication |
|---|---|
Physical |
The media (paper, electronic) storing the data |
Empirical |
The layer that observes the signals from the physical, and distinguishes signal from noise |
Syntactic |
The layer that encodes the data into symbols (e.g., ASCII) |
Semantic |
The layer providing the rules for constructing meaning from syntactical elements |
Pragmatic |
The layer providing larger, linguistic structuring |
Social |
The layer that provides the context and ultimately consequence of the data (e.g., legal, financial, entertainment) |
Without all these layers, the magnetic state of those atoms is irrelevant.
The physical, empirical, and syntactic layers (hardware and lowest-level software) are in general out of scope for this document. They are the concern of broad and deep fields of theory, research, development, market activity, and standards. (Digital Infrastructure on infrastructure is the most closely related).
A similar but simpler hierarchy is:
-
Data
-
Information
-
Knowledge
Data is the context-less raw material.
Information is data + context, which makes it meaningful and actionable.
Knowledge is the situational awareness to make use of information.
Semantic, pragmatic, and social concerns (information and knowledge) are fundamental to this document and Competency Area. At digital scale — terabytes, petabytes, exabytes — establishing the meaning and social consequence of data is a massive undertaking. Data management and records management are two practices by which such meaning is developed and managed operationally. We will start by examining data management as a practice.
Evidence of Notability
Information management and its related value is the basis of computing and IT. Its notability is evidenced in the history of the human race’s approaches to managing it, from cuneiform to the present day.
Limitations
Information tends to be static and passive, where process is dynamic.
Related Topics
6.4.2.2. Enterprise Information Management
Description
6.4.2.2.1. Data Management and the DMBOK®
Data management is a long established practice in larger IT organizations. As a profession, it is represented by the Data Management Association (DAMA). DAMA developed and supported the Data Management Body of Knowledge (DMBOK), which is a primary influence on this Competency Category.
The Data Management Body of Knowledge (DMBOK) [80] is similar to other frameworks presented in this document (e.g., ITIL, COBIT, and PMBOK). It includes ten major functions:
-
Data Governance
-
Data Architecture Management
-
Data Development
-
Data Operations Management
-
Data Security Management
-
Reference and Master Data Management
-
Data Warehousing and Business Intelligence Management
-
Document and Content Management
-
Metadata Management
-
Data Quality Management
Attentive readers will notice some commonalities with general areas covered in this document: Governance, Architecture, Operations, and Security in particular. Data at scale is a significant problem area, and so the DMBOK provides a data-specific interpretation of these broader concerns, as well as more specialized topics.
We will not go through each of the DMBOK functions in order, but we will be addressing most of them throughout this Competency Category.
6.4.2.2.2. Data Architecture and Development
In order to understand data, we must understand how it is being used. We covered process management in Section 6.3.3, “Organization and Culture”. Data is often contrasted with process since processes take data inputs and produce data outputs. The fundamental difference between the two can be seen in the core computer science concepts of algorithms (process) and data structures. Data emerges, almost unavoidably, when processes are conceived and implemented. A process such as “Hire Employee” implies that there is an employee, and also a concept of “hire” with associated date and other circumstances. It may seem obvious, but data structures are surprisingly challenging to develop and gain consensus on.
The boundaries of an entity are arbitrary, our selection of entity types is arbitrary, the distinction between entities, attributes, and relationships is arbitrary.
Preface to Kent's Data and Reality
Suppose you are discussing the concept of “customer” with a teammate. You seem to be having some difficulty understanding each other. (You are from support and she is from sales.) You begin to realize that you have two different definitions for the same word:
-
You believe that “customer” means someone who has bought something
-
She believes that “customer” includes sales leads
This is a classic issue in data management: when one term means two things. It can lead to serious confusion and technical difficulties if these misunderstandings affect how systems are built and operated. Because of this, it is critical to have rational and clear discussions about “what we mean”. In a startup driven by one or two visionary founders, perhaps little or no time is needed for this. The mental model of the problem domain may be powerfully understood by the founder, who controls the key architectural decisions. In this way, a startup can progress far with little formalized concern for data management.
But as a company scales, especially into multi-product operations, unspoken (tacit) understandings do not scale correspondingly. Team members will start to misunderstand each other unless definitions are established. This may well be needed regardless of whether data is being held in a database. The concept of a "controlled vocabulary” is, therefore, key to Enterprise Information Management.
In many areas of business, the industry defines the vocabulary. Retailers are clear on terms like “supplier”, “cost”, and “retail” (as in amount to be charged for the item; they do not favor the term “price” as it is ambiguous). The medical profession defines “patient”, “provider”, and so forth. However, in more flexible spaces, where a company may be creating its own business model, defining a controlled vocabulary may be essential. We see this even in books, which provide glossaries. Why does a book have a glossary, when dictionaries exist? Glossaries within specific texts are defining a controlled, or highly specific, vocabulary. General-purpose dictionaries may list multiple meanings for the same word, or not be very precise. By developing a glossary, the author can make the book more consistent and accurate.
There are techniques for developing controlled vocabularies in efficient and effective ways. The term “ontology engineering” is sometimes used [82]. While specialists may debate the boundaries, another important practice is “conceptual data modeling”. All of these concepts (controlled vocabularies, glossaries, ontologies, conceptual data models) are independent of computers. But the initial development of controlled vocabulary is the first step towards automating the information with computers.
An information system (e.g., database) is a model of a small, finite subset of the real world … We expect certain correspondences between constructs inside the information system and in the real world. We expect to have one record in the employee file for each person employed by the company. If an employee works in a certain department, we expect to find that department’s number in that employee’s record.
Data and Reality
Databases are the physical representation of information within computing systems. As we discussed above, the data contained within them corresponds to some “real world” concept we hold.
There are well-known techniques for translating concepts (e.g., controlled vocabularies) into technical database structures. The best known of these is relational data modeling.
Relational data modeling is often presented as having three layers:
-
Conceptual
-
Logical
-
Physical
The following descriptions of the layers are typical:
Conceptual |
Independent of computing platform — no assumption of any database. Does include simple relationships. Does not include attributes. |
Logical |
Assumes a database, but not what kind. Includes more detailed relationships and attributes. Human-readable names. |
Physical |
Intended for a specific database platform (e.g., Oracle or MySQL). Computer-compatible names. Can be used to generate data definition scripts. |
A simple conceptual model might appear as shown in Figure 131, “Conceptual Data Model”.

The above model might be a fragment from a sales system. It shows that their are four major entities:
-
Customer
-
Invoice
-
Line Item
-
Product
This might be elaborated into a logical model (see Figure 132, “Logical Data Model”).
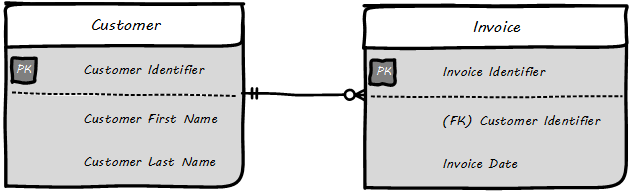
The logical model includes attributes (Customer First Name). The line between them has particular “adornments” representing a well-known data modeling notation called “crow’s foot”. In this case, the notation is stipulating that one customer may have zero to many invoices, but any invoice must have one and only one customer. Notice also that the entity and attribute names are human-readable.
Then, the logical model might be transformed into physical (see Figure 133, “Physical Data Model”).
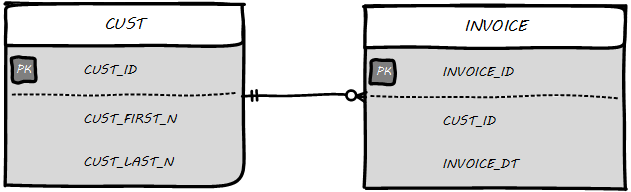
The names are no longer human-readable in full, nor do they have spaces. Common data types such as “name” and “date” have been replaced with brief codes (“N” and “DT”). In this form, the physical data model can be (in theory) translated to data definition language that can result in the creation of the necessary database tables.
Continuing from above: the data modeling work might have been performed by a data architect or analyst, or a developer. Perhaps a pictorial representation is not even created (formal data modeling as above is less likely in a startup). But at some point (assuming a relational database) the following statement will be developed:
CREATE TABLE SALES.CUST
(CUST_ID NUMBER,
CUST_FIRST_N VARCHAR2(32),
CUST_LAST_N VARCHAR2(32))
In the above SQL (Structured Query Language) statement, the Customer entity has been finally represented as a series of encoded statements an Oracle database can understand, including specification of the data types needed to contain Customer Identifier (a number type) and the customer’s first and last names (a 32-character long string field, called “VARCHAR” in Oracle).
If a DBA issues that statement to the Oracle database, the table will be created. Once the structure is created, it can (within limits) hold any number of customers, in terms of knowing their first and last names and an ID number, which might or might not be assigned automatically by the system. (Of course, we would want many more attributes; e.g., customer address.)
|
Important
|
Notice that this database would only work for regions where customers have “first” and “last” names. This may not be true in all areas of the world. See Falsehoods Programmers Believe about Names. |
The Oracle software is installed on some node or machine and receives the statement. The database adds the table suggested (see Figure 134, “Database Creates Table”).
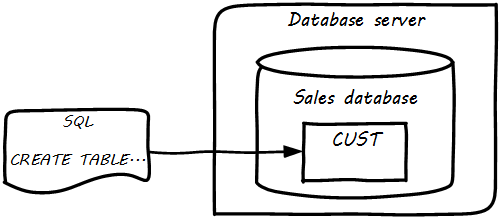
Further tables can easily be added in the same manner (see Figure 135, “Multiple Tables in Database”).
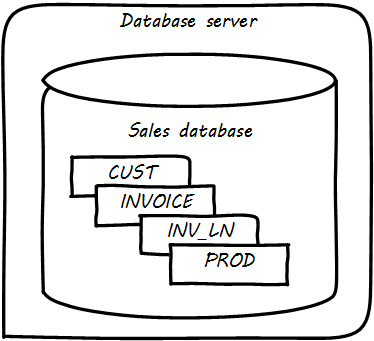
What is a database in this sense? The important point is that it is a common query space — you can ask for data from either the CUST, INVOICE, or Inventory LINe (INV_LN) table or ask the database to “join” them so you can see data from both. (This is how, for example, we would report on sales by customer.)
Reference architectures and design patterns are examples of approaches that are known to work for solving certain problems. In other words, they are reusable solutions for commonly occurring scenarios. They apply to core software development, often suggesting particular class structures [108]. However, the concept can also be applied to data and system architectures; e.g., [101], [31]. David Hay [127], and Len Silverston [258], [257], [259] have documented data models for a variety of industries.
Reference architectures also can provide guidance on data structures, as they often contain industry learnings. Examples include:
| Organization | Domain | Standard(s) |
|---|---|---|
TM Forum |
Telecommunications |
Frameworx, ETOM — Enhanced Telecommunications Operating Model, TAM, SIDS |
Association for Retail Technology Standards |
Retail |
ARTS Model |
ACORD.org |
Insurance |
ACORD Framework |
Banking Industry Architecture Network |
Banking |
BIAN Service Landscape |
The Open Group Exploration, Mining, Metals, and Minerals (EMMM™) Forum |
Exploration, Mining, and Minerals |
Exploration and Mining Business Reference Model |
The Open Group IT4IT Forum |
Information Technology Management |
IT4IT Standard |
Patterns and reference architectures can accelerate understanding, but they also can over-complicate solutions. Understanding and pragmatically applying them is the challenge. Certainly, various well-known problems such as customer address management have surprising complexity and can benefit from leveraging previous work.
The above description is brief and “classic” — the techniques shown here date back decades, and there are many other ways the same problem might be represented, analyzed, and solved. But in all cases in data management, the following questions must be answered:
-
What do we mean?
-
How do we represent it?
The classic model shown here has solved many business problems at large scale. But there are critical limitations. Continuing to expand one “monolithic” database does not work past a certain point, but fragmenting the data into multiple independent systems and data stores also has challenges. We will discuss these further as this Competency Category progresses.
6.4.2.2.3. Enterprise Information Management
The previous section was necessary but narrow. From those basic tools of defining controlled vocabularies and mapping them onto computing platforms, has come today’s digital economy and its exabytes of data.
The relational database as represented in the previous Competency Category can scale, as a single unit, to surprising volumes and complexity. Perhaps the most sophisticated and large-scale examples are seen in ERP (more detail on this in the Topics section). An ERP system can manage the supply chain, financials, human resources, and manufacturing operations for a Fortune 50 corporation, and itself constitute terabytes and tens of thousands of tables.
However, ERP vendors do not sell solutions for leading-edge Digital Transformation. They represent the commoditization phase of the innovation cycle. A digital go-to-market strategy cannot be based solely on them, as everyone has them. Competing in the market requires systems of greater originality and flexibility, and that usually means some commitment to either developing them with internal staff or partnering closely with someone who has the necessary skills. And as these unique systems scale up, a variety of concerns emerge, requiring specialized perspectives and practices.
The previous Competency Category gave us the basics of data storage. We turn to some of the emergent practices seen as Enterprise Information Management scales up:
-
Master data, data integration, and the System of Record
-
Reference data management
-
Data quality management
In the last section, we analyzed a business problem as a data model and created a simple database. Notice that if data is not in the database table, the database doesn’t know about it. Therefore, if there is data held in other parts of the company, it must be loaded into the database before it can be combined with that database’s other data. This can also apply to data held by cloud providers.
Let’s go back to our emergence model. Think about moving from one database to two.
In the example below, the CRM system is in the cloud, and data is also being imported from the product database (see Figure 136, “Data Integrations”).
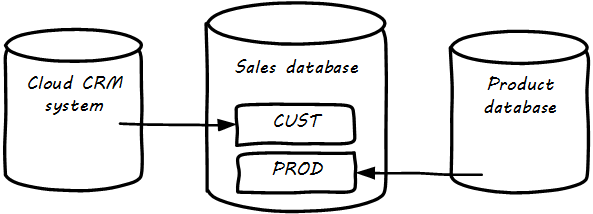
The process of identifying such remote data and loading it into a database to enable work to be done is known as “integration” and is a complex domain [129]. There are many ways data can be integrated, and industry views of what is “good practice” have changed over the years.
|
Note
|
Thinking in terms of the emergence model, you have likely been integrating data in various ways for some time. However, in a large, governed organization, you need to formalize your understandings and approach. |
Take the above diagram and multiply it by several hundred times, and you will start to get an idea of the complexity of Enterprise Information Management at scale in the enterprise. How do we decide what data needs to flow where? What happens if we acquire another company and can’t simply move them over to our systems immediately? What department should properly own a given database? These and similar questions occupy data professionals worldwide.
As we see from the above picture, the same data may exist in multiple systems. Understanding what system is the “master” is critical. Product data should (in general) not flow from the sales database back into the product system. But what about sales information flowing from the sales database back to the CRM system? This might be helpful so that people using the CRM system understand how much business a customer represents.
The “System of Record” concept is widely used in data management, records management, and Enterprise Architecture to resolve these kinds of questions. It is often said that the System of Record is the “master” for the data in question, and sustaining the System of Record concept may also be called Master Data Management. In general, the System of Record represents data that is viewed as:
-
The most complete and accurate
-
Authoritative, in terms of resolving questions
-
Suitable for legal and regulatory purposes
-
The “source” for other systems to refer to
It is important to realize that the designation “System of Record” is a role that a given database (or system) plays with respect to some data. The “sales” database above might be the System of Record for invoices, but is not the System of Record for products or customers (see Figure 137, “System of Record”).
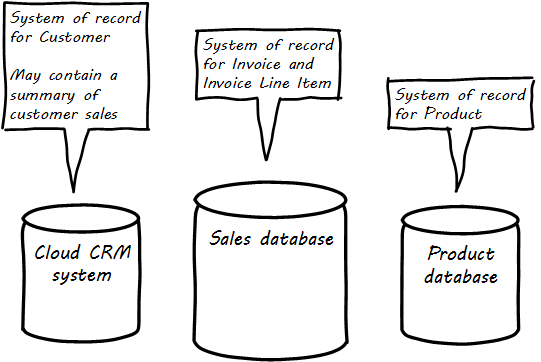
The System of Record is often the system of origin — the system where the data is first captured — but not always. In retail, sales transactions are not considered authoritative until they pass through sales audit, and so the System of Record for a transaction is not the cash register, which has a database in it (see Figure 138, “Data Flow for Sales Information”).
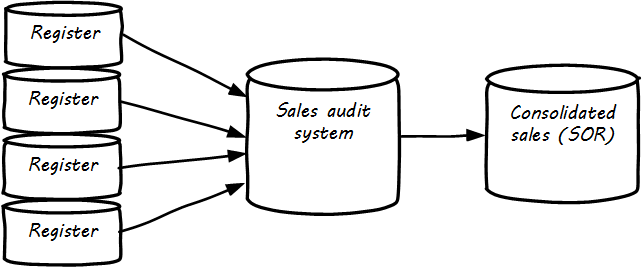
System of Record logically would be the first place to pull data from, but sometimes due to performance or security concerns, data may be replicated into an alternate source better suited for distributing the data. A good example of this is a human resources system that feeds the corporate directory; the human resources system (e.g., Oracle HR, or Workday) is the actual System of Record for employee names and identifiers, but most people and other systems in the company will pull the data from the directory (e.g., Microsoft Exchange — see Figure 139, “Data Flow for Human Resources Data”).
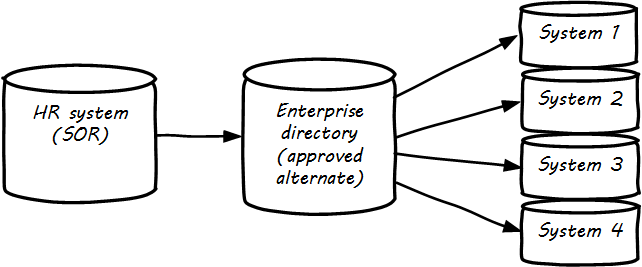
Reference data is any kind of data that is used solely to categorize other data found in a database, or solely for relating data in a database to information beyond the boundaries of the enterprise.
Managing Reference Data
There are various ways to categorize data. Frequently, it is categorized by business process or functional area (sales, marketing, support, etc.). However, another important way to understand data is by its non-functional characteristics. Keep in mind that some data is transactional (e.g., Invoice and Invoice Line Item in the above example) and some is more persistent (Customer, Product).
When data is highly persistent and used primarily for categorizing across an enterprise, we may call it “reference” data. Classic examples of reference data include:
-
Geographic information (cities, states, zip codes)
-
Widely used “codes” in the business (medical insurance makes extensive use of these)
-
An organization’s chart of accounts
Reference data is among the first data to be shared between systems. It is often the basis for dimensions in analytic processing, which we cover in the next Competency Category.
Data is not just an internal artifact of organizations. Data can be bought and sold on the open market like any other commodity. Marketing organizations frequently acquire contact information for email and other campaigns. Here are examples of commercial data available through market sources:
| Data type | Market provider |
|---|---|
Stock prices |
Bloomberg, Reuters |
Credit ratings |
Trans-Union, Experian |
Known security issues |
NIST Common Vulnerability database |
Technology products and availability dates |
BDNA Technopedia |
Other forms include:
-
Transactions of record (e.g., real estate)
-
Governmental actions (these may be nominally free from the government, but frequently are resold by vendors who make the data more accessible)
For a detailed examination of the privacy issues relating to commercial data, especially when governmental data is commercialized, see [86].
Human beings cannot make effective business decisions with flawed, incomplete, or misleading data.
Executing Data Quality Projects
We touched on quality management and continuous improvement in Section 6.3.3, “Organization and Culture”. Data is an important subject for continuous improvement approaches. Sometimes, the best way to improve a process is to examine the data it is consuming and producing, and an entire field of data quality management has arisen.
Poor data quality costs the enterprise in many ways:
-
Customer dissatisfaction (“they lost my order/reservation”)
-
Increased support costs (30 minutes support operator time spent solving the problem)
-
Governance issues and regulatory risk (auditors and regulators often check data quality as evidence of compliance to controls and regulations)
-
Operational and supply chain issues
-
Poor business outcomes
The following activities are typically seen in data quality management (derived and paraphrased from [80]):
-
Identify measurable indicators of data quality
-
Establish a process for acting upon those indicators (what do we do if we see bad data?)
-
Actively monitor the quality
-
Fix both data quality exceptions, and their reasons for occurring
Data quality indicators may be automated (e.g., reports that identify exceptions) or manual (e.g., audits of specific records and comparison against what they are supposed to represent).
It is important to track trending over time so that the organization understands if progress is being made.
6.4.2.2.4. Enterprise Records Management
Not all enterprise information is stored in structured databases; in fact, most isn’t. (We will leave aside the issues of rich content such as audio, images, and video.) Content management is a major domain in and of itself, which shades into the general topic of knowledge management (to be covered in the Topics section). Here, we will focus on records management. As discussed above, businesses gained efficiency through converting paper records to digital forms. But we still see paper records to this day: loan applications, doctor’s forms, and more. If you have a car, you likely have an official paper title to it issued by a governmental authority. Also, we above defined the concept of a System of Record as an authoritative source. Think about the various kinds of data that might be needed in the case of disputes or legal matters:
-
Employee records
-
Sales records (purchase orders and invoices)
-
Contracts and other agreements
-
Key correspondence with customers (e.g., emails directing a stock broker to “buy”)
These can take the form of:
-
Paper documents in a file cabinet
-
Documents scanned into a document management system
-
Records in a database
In all cases, if they are “official” — if they represent the organization’s best and most true understanding of important facts — they can be called “records”.
This use of the word “records” is distinct from the idea of a “record” in a database. Official records are of particular interest to the company’s legal staff, regulators, and auditors. Records management is a professional practice, represented by the Association of Records Management Administrators (www.arma.org). Records management will remain important in digitally transforming enterprises, as lawyers, regulators, and auditors are not going away.
One of the critical operational aspects of records management is the concept of the retention schedule. It is not usually in an organization’s interest to maintain all data related to all things in perpetuity. Obviously, there is a cost to doing this. However, as storage costs continue to decrease, other reasons become more important. For example, data maintained by the company can be used against it in a lawsuit. For this reason, companies establish records management policies such as:
-
Human resources data is to be deleted seven years after the employee leaves the company
-
POS data is to be deleted three years after the transaction
-
Real estate records are to be deleted ten years after the property is sold or otherwise disposed of
This is not necessarily encouraging illegal behavior. Lawsuits can be frivolous, and can “go fishing” through a company’s data if a court orders it. A strict retention schedule that has demonstrated high adherence can be an important protection in the legal domain.
|
Important
|
If you or your company are involved in legal issues relating to the above, seek a lawyer. This discussion is not intended as legal advice. |
We will return to records management in the discussion below on e-discovery and cyberlaw.
Records management drives us to consider questions such as “who owns that data” and “who takes care of it”. This leads us to the concept of data governance.
6.4.2.2.5. Data Governance
This document views data governance as based in the fundamental principles of governance from Section 6.4.1, “Governance, Risk, Security, and Compliance”:
-
Governance is distinct from management
-
Governance represents a control and feedback mechanism for the digital pipeline
-
Governance is particularly concerned with the external environment (markets, brands, channels, regulators, adversaries)
By applying these principles, we can keep the topic of “data governance” to a reasonable scope. As above, let’s focus on the data aspects of:
-
Risk management, including security
-
Compliance
-
Policy
-
Assurance
The biggest risk with information is unauthorized access, discussed previously as a security concern. Actual destruction, while possible, is also a concern; however, information can be duplicated readily to mitigate this. Other risks include regulatory and civil penalties for mis-handling, and operational risks (e.g., from bad data quality).
There is a wide variety of specific threats to data, leading to risk; for example:
-
Data theft (e.g., by targeted exploit)
-
Data leakage (i.e., unauthorized disclosure by insiders)
-
Data loss (e.g., by disaster and backup failure)
The standard risk and security approaches suggested in Section 6.4.1, “Governance, Risk, Security, and Compliance” are appropriate to all of these. There are particular technical solutions such as data leakage analysis that may figure in a controls strategy.
A valuable contribution to information management is a better understanding of the risks represented by data. We have discussed simple information sensitivity models (for example Public, Internal, Confidential, Restricted). However, a comprehensive information classification model must accommodate:
-
Basic sensitivity (e.g., confidential)
-
Ownership/stewardship (e.g., senior vice-president HR, HR/IS director)
-
Regulatory aspects (e.g., SOX or HIPAA)
-
Records management (e.g., “Human Resources”, “Broker/Client Communications”, “Patient History”)
Beyond sensitivity, the regulatory aspects drive both regulatory and legal risks. For example, transmitting human resources data related to German citizens off German soil is illegal, by German law. (There are similar regulations at the European Union level.) But if German human resources data is not clearly understood for what it is, it may be transmitted illegally. Other countries have different regulations, but privacy is a key theme through many of them. The US HIPAA regulations are stringent in the area of US medical data. In order to thoroughly manage such risks, data stores should be tagged with the applicable regulations and the records type.
The broad topic of individuals' expectations for how data relating to them is stored and secured is called data privacy. It drives regulations, lawsuits, standards, and is a frequent topic of news coverage (e.g., when a mass data breach occurs). Bad data quality also presents risks as mentioned above. In fact, [84] sees data quality as a kind of control (in the sense of risk mitigation).
Information systems and the data within them can be the subject of litigation, both civil and criminal. A criminal investigation may ensue after a security breach. Civil and regulatory actions may result from (for example) inappropriate behavior by the organization, such as failing to honor a contract. In some cases, records are placed under a “legal hold”. This means that (whether physical or digital) the records must be preserved. The US Federal Rules of Civil Procedure [277] covers the discovery of information stored in computing systems. Successfully identifying the data in scope for the hold requires disciplined approaches to records management and data classification, as described above.
|
Important
|
Again, if you or your company are involved in legal issues relating to the above, seek a lawyer. This discussion is not intended as legal advice. |
Evidence of Notability
Information management is the basis of computing and IT. Its notability is evidenced in the existence of professional associations like the Data Management Association and the Information and Records Management Association, as well as the revenues of companies like Oracle and IBM for their data management products, and finally the broad career paths available for DBAs and data scientists.
Limitations
Data management, as a discipline concerned with the general question of information, is abstract and only arises as a formal focus of attention in larger organizations.
Related Topics
6.4.2.3. Analytics
Description
6.4.2.3.1. Analytics in Context
One important aspect of digital product development is data analytics. Analysis of organizational records has always been a part of any concern large enough to have formal records management. The word for this originally was simply “reporting”. A set of files or ledgers would be provided to one or more clerks, who would manually review them and extract the needed figures.
We have touched on reporting previously, in our discussion of metrics. Here is a more detailed examination. The compilation of data from physical sources and its analysis for the purposes of organizational strategy was distinct from the day-to-day creation and use of the data. The clerk who attended to the customer and updated their account records had a different role than the clerk who added up the figures across dozens or hundreds of accounts for the annual corporate report.
What do we mean by the words “analysis” or “analytics” in this older context? Just compiling totals and averages was expensive and time-consuming. Cross-tabulating data (e.g., to understand sales by region) was even more so. As information became more and more automated, the field of "decision support” (and its academic partner "decision sciences”) emerged. The power of extensively computerized information that could support more and more ambitious forms of analysis gave rise to the concept and practice of "data warehousing” [141]. A robust profession and set of practices emerged around data warehousing and analytics. As infrastructure became more powerful and storage less expensive, the idea of full-lifecycle or closed-loop analytics originated.
When analyzing data is costly and slow, the data analysis can only affect large, long-cycle decisions. It is not a form of fast feedback. The annual report may drive next year’s product portfolio investment decisions, but it cannot drive the day-to-day behavior of sales, marketing, and customer service (see Figure 140, “Strategic Analytics”).
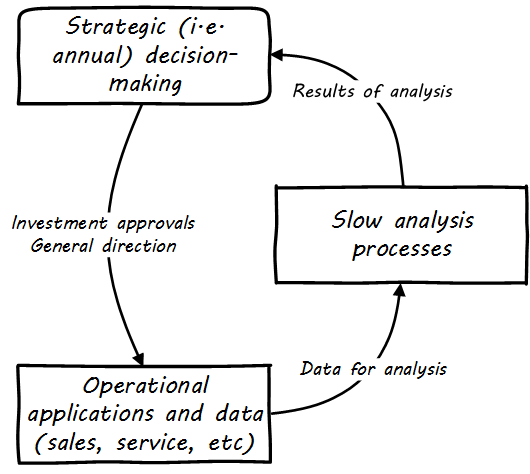
However, as analysis becomes faster and faster, it can inform operational decisions (see Figure 141, “Operational Analytics (Closed-Loop)”).
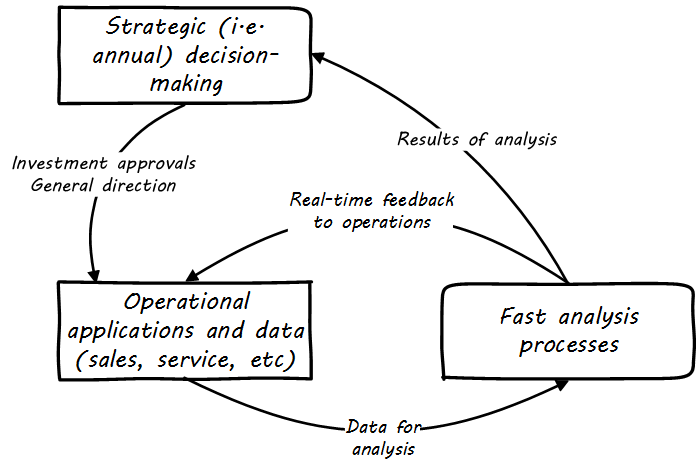
And, for certain applications (such as an online traffic management application on your smartphone), analytics is such a fundamental part of the application that it becomes operational. Such pervasive use of analytics is one of the hallmarks of Digital Transformation.
6.4.2.3.2. Data Warehousing and Business Intelligence
The reason to build a DW is to have the ability to make better decisions faster based on information using current and historical data.
Data Warehousing: Using the Wal-Mart Model
According to the DMBOK, “A Data Warehouse (DW) is a combination of two primary components. The first is an integrated decision support database. The second is the related software programs used to collect, cleanse, transform, and store data from a variety of operational and external sources … Data warehousing is a technology solution supporting Business Intelligence (BI)” [80]. The vision of an integrated DW for decision support is compelling and has provided enough value to support an industry sector of specialized hardware, software, training, and consulting. It can be seen as a common architectural pattern, in which disparate data is aggregated and consolidated for purposes of analysis, reporting, and for feedback into strategy, tactics, and operational concerns.
Figure: Figure 142, “Data Warehousing/Business Intelligence Architecture” illustrates a Data Warehousing/Business Intelligence (DW/BI) implementation pattern. The diagram expands on the above contextual diagrams, showing the major business areas (sales, etc.) as data sources. (In a large organization this might be dozens or hundreds of source systems.) These systems feed a "data services layer” that both aggregates data for analytics, as well as providing direct services such as data cleansing and master data management.
It is important to understand that in terms of this document’s emphasis on product-centric development that the data services layer itself is an internal product. Some might call it more of a component than a feature, but it is intended in any case as a general-purpose platform that can support a wide variety of use-cases.
“Factoring out” data services in this way may or may not be optimal for any given organization, depending on maturity, business objectives, and a variety of other concerns. However, at scale, the skills and practices do become specialized, and so it is anticipated that we will continue to see implementation strategies similar to this figure. Notice also that the data services layer is not solely for analytics; it also supports direct operational services. Here are discussions of the diagrams' various elements:
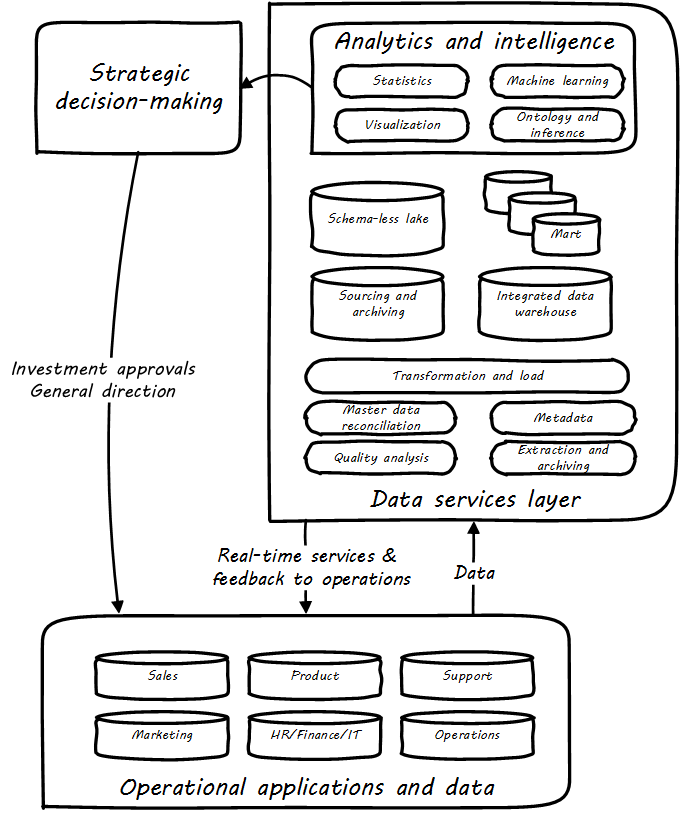
Operational applications. These are the source systems that provide the data and require data services.
Quality analysis. This is the capability to analyze data for consistency, integrity, and conformity with expectations, and to track associated metrics over time. (See data quality.)
Extraction and archiving. As data storage has become less expensive, maintaining a historical record of data extracts in original format is seen more often in data warehousing. (This may use a schema-less data lake for implementation.)
Master data reconciliation. When master data exists in diverse locations (e.g., in multiple System of Record) the ability to reconcile and define the true or “golden” master may be required. This is useful directly to operational systems, as an online service (e.g., postal service address verification), and is also important when populating the DW or mart. Master data includes reference data, and in the data warehousing environment may be the basis for “dimensions”, a technical term for the ways data can be categorized for analytic purposes (e.g., retail categorizes sales by time, region, and product line). Maintaining a history of dimensions is a challenging topic; search on the “slowly changing dimension” problem for further information.
Metadata. Commonly understood as “data about data”, we have previously encountered the concept of metadata and will further discuss it in the next Competency Category.
Transformation and load. Converting data to a consistent and normalized form has been the basis of enterprise data warehousing since it was first conceived. (We will discuss the schema-less data lake approach in the next Competency Category.) A broad market segment of "Extract, Transform, Load” (ETL) tooling exists to support this need.
Sourcing and archiving. This represents the physical data store required for the extraction and archiving capability. Again, it may be implemented as a schema-less data lake, or as a traditional relational structure.
Integrated DW. The integrated or enterprise DW is the classic, normalized, often massive, historical data store envisioned originally by Bill Inmon [141]. While the development effort in creating fully normalized DWs has limited them, they nevertheless are important, valuable, and frequently encountered in larger organizations.
Data lake. A newer form of data aggregation is seen in the schema-less "data lake”. As discussed in the next Competency Category, schema-less approaches accept data in native formats and defer the hard question of normalizing the data to the reporting and analysis stage.
Data mart(s). The integrated DW is intended to provide a consistent and universal platform across the enterprise. The data mart on the other hand is usually seen as specific to a particular organization or problem.
Statistics. Statistical analysis of the aggregated and cleansed data is a common use-case, often performed using commercial software or the R programming language.
Machine learning. Machine learning is broadly defined as “a field of study that gives computers the ability to learn without being explicitly programmed”. [Arthur Samuel as quoted in Simon, waiting on the book]. Machine learning allows computers to develop and improve algorithmic models for making predictions or decisions. Spam filters that “learn” are a good example.
Visualization. Representing complex information effectively so that humans can understand it and derive value is itself a challenging topic. Many graphical forms have been developed to communicate various aspects of data. See, for example, the open source visualization library D3.js.
Ontology and inference. This includes text mining and analytics, and also the ability to infer meaning from unstructured data sets. More in the next Competency Category discussion on schema-less.
Evidence of Notability
Analytics and "Big Data", and their more advanced expression in cognitive applications, are significant areas of R&D and industry interest.
Limitations
Analytics is a broad topic, ranging from simple reporting to AI. Clarity on what the term may mean in a given context is essential.
Related Topics
6.4.2.4. Agile Information Management
Description
Data infrastructure, like any complex systems development effort, is most effective and least risky when undertaken iteratively and incrementally. An organization’s analysis needs will change unpredictably over time and so a fast feedback loop of testing and learning is essential. The enterprise DW can support a wide variety of analysis objectives flexibly. Its challenge has always been the lead time required to develop the data structures and ETL logic. This will be discussed further in the next Competency Category.
6.4.2.4.1. Software versus Data
Services and applications can have their own gravity, but data is the most massive and dense. Therefore, it has the most gravity. Data if large enough can be virtually impossible to move [193].
Enterprise Information Management (including data management) has had a contentious relationship to Agile methods. There are inherent differences in perspective between those who focus on implementing software versus those who are concerned with data and information, especially at scale. The tendency among software engineers is to focus on the conceptual aspects of software, without concern for the physical issues of computing. (Logical versus physical is arguably the fundamental distinction at the heart of the development versus operations divide). Enterprise information managers also are tasked with difficult challenges of semantic interoperability across digital portfolios, concerns that may appear remote or irrelevant for fast-moving Agile teams.
As we have previously discussed, refactoring is one of the critical practices of Agile development, keeping systems flexible and current when used appropriately. The simple act of turning one overly large software class or module into two or three more cohesive elements is performed every day by developers around the world, as they strive for clean, well engineered code.
DevOps and Agile techniques can be applied to databases; in fact, there are important technical books such as Refactoring Databases by Ambler and Sadalage [19]. With smaller systems, there is little reason to avoid ongoing refactoring of data along with the code. Infrastructure as Code techniques apply. Database artifacts (e.g., SQL scripts, export/import scripts, etc.) must be under version control and should leverage continuous integration techniques. Test-driven development can apply equally well to database-related development.
But when data reaches a certain scale, its concerns start to become priorities. The bandwidth of UPS is still greater than that of the Internet [205]. That is to say, it is more effective and efficient, past a certain scale, to physically move data by moving the hard drives around, than to copy the data. The reasons are well understood and trace back to fundamental laws of physics and information first understood by Claude Shannon [254]. The concept of “data gravity” (quote above) seems consistent with Shannon’s work.
Notice that these physical limitations apply not just to simple movement of data, but also to complex refactoring. It is one thing to refactor code — even the SQL defining a table. Breaking an existing, overly large database table and its contents into several more specialized tables is a different problem if data is large. Data, in the sense understood by digital and IT professionals, is persistent. It exists as physical indications of state in the physical world: whether knotted ropes, clay tablets, or electromagnetic state.
If you are transforming 3 billion rows in a table, each row of data has to be processed. The data might take hours or days to be restructured, and what of the business needs in the meantime? These kinds of situations often have messy and risky solutions, that cannot easily be “rolled back":
-
A copy might be made for the restructuring, leaving the original table in place
-
When the large restructuring operation (perhaps taking hours or days) is completed, and new code is released, a careful conversion exercise must identify the records that changed while the large restructuring occurred
-
These records must then go through the conversion process again and be updated in the new data structure; they must replace the older data that was initially converted in step 1
All in all, this is an error-prone process, requiring careful auditing and cross-checking to mitigate the risk of information loss. It can and should be automated to the maximum degree possible. Modern web-scale architectures are often built to accommodate rolling upgrades in a more efficient manner (see [178], Chapter 11: “Upgrading Live Services”). Perhaps the data can be transformed on an “if changed, then transform” basis, or via other techniques. Nevertheless, schema changes can still be problematic. Some system outage may be unavoidable, especially in systems with strong transactional needs for complete integrity. (See earlier discussion of CAP theorem.)
Because of these issues, there will always be some contention between the software and information management perspectives. Software developers, especially those schooled in Agile practices, tend to rely on heuristics such as “do the simplest thing that could possibly work”. Such a heuristic might lead to a preference for a simpler data structure, that will not hold up past a certain scale.
An information professional, when faced with the problem of restructuring the now-massive contents of the data structure, might well say: “Why did you build it that way? Couldn’t you have thought a little more about this?” In fact, data management personnel often sought to intervene with developers, sometimes placing procedural requirements upon the development teams when database services were required. This approach is seen in waterfall development and when database teams are organized functionally.
We saw the classic model earlier in this Competency Category; in turn, define:
-
Conceptual data model
-
Logical data model
-
Physical schema
as a sequential process. However, organizations pressed for time often go straight to defining physical schemas. And indeed, if the cost of delay is steep, this behavior will not change. The only reason to invest in a richer understanding of information (e.g., conceptual and logical modeling), or more robust and proven data structures, is if the benefits outweigh the costs. Data and records management justifies itself when:
-
Systems are easier to adapt because they are well understood, and the data structures are flexible
-
Occurrence, costs, and risks of data refactoring are reduced
-
Systems are easier to use because the meaning of their information is documented for the end consumer (reducing support costs and operational risks)
-
Data quality is enabled or improved
-
Data redundancy is lessened, saving storage and management attention
-
Data and records-related risks (security, regulatory, liability) are mitigated through better data management
Again, back to our emergence model. By the time you are an enterprise, faced with the full range of governance, risk, security, and compliance concerns, you likely need at least some of the benefits promised by Enterprise Information Management. The risk is that data management, like any functional domain, can become an end in itself, losing sight of the reasons for its existence.
6.4.2.4.2. Next-Generation Practices in Information Management
The value of cross-functional teams was discussed at length in Section 6.3.3.1.4, “Product and Function”. This applies to including data specialists as team members. This practice alone can reduce many data management issues.
As you try to model a larger domain, it gets progressively harder to build a single unified model [105].
The relational database, with its fast performance and integrated schemas allowing data to be joined with great flexibility, has fundamentally defined the worldview of data managers for decades now. This model arguably reached its peak in highly-scaled mainframe systems, where all corporate data might be available for instantaneous query and operational use.
However, when data is shared for many purposes, it becomes very difficult to change. The analysis process starts to lengthen, and cost of delay increases for new or enhanced systems. This started to become a real problem right around the time that cheaper distributed systems became available in the market. Traditional data managers of large-scale mainframe database systems continued to have a perspective that “everything can fit in my database”. But the demand for new digital product outstripped their capacity to analyze and incorporate the new data.
The information management landscape became fragmented. One response was the enterprise conceptual data model. The idea was to create a sort of “master schema” for the enterprise, that would define all the major concepts in an unambiguous way. However, attempting to establish such a model can run into difficulties getting agreement on definitions. (See the ontology problem above.) Seeking such agreement again can impose the cost of delay if gaining agreement is required for the system. And if gaining agreement is optional, then why is agreement being sought? The risk is that the data architect becomes “ivory tower”.
|
Note
|
In fact, there are theoretical concerns at the heart of philosophy with attempting to formulate universal ontologies. They are beyond the scope of this document but if you are interested, start by researching semiotics and postmodernism. Such concerns may seem academic, but we see their consequences in the practical difficulty of creating universal data models. |
A pragmatic response to these difficulties is represented in the Martin Fowler quote above. Fowler recommends the practice of DDD, which accepts the fact that “different groups of people will use subtly different vocabularies in different parts of a large organization” [105] and quotes Eric Evans that “total unification of the domain model for a large system will not be feasible or cost-effective” [96].
Instead, there are various techniques for relating these contexts, beyond the scope of this document. (See [96].) Some will argue for the use of microservices, but data always wants to be recombined, so microservices have limitations as a solution for the problems of information management. And, before you completely adopt a DDD approach, be certain you understand the consequences for data governance and records management. Human resources records must be handled appropriately. Regulators and courts will not accept DDD as a defense for non-compliance.
Schema development — the creation of detailed logical and physical data and/or object models — is time-consuming and requires certain skills. Sometimes, application developers try to use highly generic structures in the database. Relational databases and their administrators prefer distinct tables for Customer, Invoice, and Product, with specifically identified attributes such as Invoice Date. Periodically, developers might call up the DBA and have a conversation like this (only slightly exaggerated):
“I need some tables.”
“OK, what are their descriptions?”
“Just give me 20 or so tables with 50 columns each. Call them Table1 through Table20 and Column1 through Column50. Make the columns 5,000-character strings, that way they can hold anything.”
“Ummm … You need to model the data. The tables and columns have to have names we can understand.”
“Why? I’ll have all that in the code.”
These conversations usually would result in an unsatisfied developer and a DBA further convinced that developers just didn’t understand data. A relational database, for example, will not perform well at scale using such an approach. Also, there is nothing preventing the developer from mixing data in the tables, using the same columns to store different things. This might not be a problem for smaller organizations, but in organizations with compliance requirements, knowing with confidence what data is stored where is not optional.
Such requirements do not mean that the developer was completely off track. New approaches to data warehousing use generic schemas similar to what the developer was requesting. The speed of indexing and proper records management can be solved in a variety of ways. Recently, the concept of the "data lake” has gained traction. Some data has always been a challenge to adapt into traditional, rigid, structured relational databases. Modern “web-scale” companies such as Google have pioneered new, less structured data management tools and techniques. The data lake integrates data from a large variety of sources but does not seek to integrate them into one master structure (also known as a schema) when they are imported. Instead, the data lake requires the analysts to specify a structure when the data is extracted for analysis. This is known as “schema-on-read”, in contrast to the traditional model of “schema-on-write”.
Data lakes, and the platforms that support them (such as Hadoop), were originally created as high-volume web data such as generated by Google. There was no way that traditional relational databases could scale to these needs, and the digital exhaust data was not transactional – it was harvested and in general never updated afterwards. This is an increasingly important kind of workload for digital organizations. As the IoT takes shape, and digital devices are embedded throughout daily experiences, high-volume, adaptable data stores (such as data lakes) will continue to spread.
Because log formats change, and the collaboration data is semi-structured, analytics will likely be better served with a “schema-on-read” approach. However, this means that the operational analysis is a significant development. Simplifying the load logic only defers the complexity. The data lake analyst must have a thorough understanding of the various event formats and other data brought into the lake, in order to write the operational analysis query.
“Schema-on-read” still may be a more efficient approach, however. Extensive schema development done up-front may be invalidated by actual data use, and such approaches are not as compatible with fast feedback. (Data services are also a form of product development and therefore fast feedback on their use is beneficial; the problem again is one of data gravity. Fast feedback works in software because code is orders of magnitude easier to change.)
Schema inference at the most general shades into ontology mining. In ontology mining, data (usually text-heavy) is analyzed by algorithms to derive the data model. If we read a textbook about the retail business, we might easily infer that there are concepts such as “store”, “customer”, “warehouse”, and “supplier”. IT has reached a point where such analysis itself can be automated, to a degree. Certain analytics systems have the ability to display an inferred table structure derived from unstructured or semi-structured data. This is an active area of research, development, and product innovation.
The challenge is that data still needs to be tagged and identified; regulatory concerns do not go away just because a NoSQL database is being used.
Another technique that is changing the data management landscape is the concept of append-only. Traditional databases change values; for example, if you change “1004 Oak Av.” to “2010 Elm St.” in an address field, the old value is (in general) gone, unless you have specifically engineered the system to preserve it.
A common approach is the idea of “audited” or “effective-dated” fields, which have existed for decades. In an effective-dated approach, the “change” to the address actually looks like this in the database:
| Street address | From | To |
|---|---|---|
1004 Oak Av. |
12/1/1995 |
9/1/2016 |
2010 Elm St. |
9/2/2016 |
Present |
Determining the correct address requires a query on the To date field. (This is only an example; there are many ways of solving the problem.)
In this approach, data accumulates and is not deleted. (Capacity problems can, of course, be the result.) Append-only takes the idea of effective dating and applies it across the entire database. No values are ever changed, they are only superseded by further appends. This is a powerful technique, especially as storage costs go down. It can be combined with the data lake to create systems of great flexibility. But there are no silver bullets. Suppose that a distributed system has sacrificed consistency for availability and partition-tolerance (see CAP theorem). In that case, the system may wind up with data such as:
| Street address | From | To |
|---|---|---|
1004 Oak Av. |
12/1/1995 |
9/1/2016 |
2010 Elm St. |
9/2/2016 |
Present |
574 Maple St. |
9/2/2016 |
Present |
This is now a data quality issue, requiring after-the-fact exception analysis and remediation, and perhaps more complicated application logic.
Finally, append-only complements architectural and programming language trends towards immutability.
… when teams have adequate test data to run automated tests, and can create that data on-demand, they see better IT performance.
2016 State of DevOps Report
A non-obvious and non-trivial problem at the intersection of Enterprise Information Management and DevOps is test data management.
What is test data management?
Suppose you are a developer working on a data-intensive system, one that (for example) handles millions of customer or supply chain records. Your code needs to support a wide variety of data inputs and outputs. At first, you just entered a few test names and addresses, like “Mickey Mouse” or “Bugs Bunny, 123 Carrot Way, Albuquerque, New Mexico 10001”. However, this nonsensical data quickly was shown not to work. For example, if you are testing integration with an address-scrubbing service, you will get an error with an address in New Mexico that shows a ZIP code of 10001. (Actually, the nonsensical data is useful in testing that particular error scenario. But that is only one of many error scenarios.)
Based on hearing anecdotal concerns, the authors of the 2016 State of DevOps report examined test data management practices and found that they correlated positively with “better IT performance, lower change failure rates, and lower levels of deployment pain and rework” [44 p. 29]. In particular, the report suggests that test data be minimized and created from a blank slate wherever possible.
Taking data from production systems as a basis for testing is also frequently done. However, such data must be sanitized — sensitive information such as social security number must be removed. This can be done automatically, but then such automation must itself be developed and maintained, and the extensive production data set may (in effect) be driving a large amount of non-value-add testing.
In general, test data management techniques will vary greatly by application and problem domain. The primary recommendation here is to invest in solving the problem, understanding that up-front investments in automation will pay off. The high-performing product team will have to solve the “how” of doing it appropriately for their particular situation.
Evidence of Notability
Agile methods and data management have had an uneasy relationship since Agile’s origins. See the writings of Scott Ambler for evidence of this topic’s notability.
Limitations
There are fundamental problems with data’s gravity in relationship to Agile methods. Multi-terabyte data sets often cannot be "refactored" with the ease and efficiency of their accessing software.
Related Topics
6.4.2.5. Information Management Topics
Description
6.4.2.5.1. Social, Mobile, Analytics, and Cloud
Discussions of Digital Transformation often reference the algorithm SMAC:
-
Social
-
Mobile
-
Analytics
-
Cloud computing
Others would add IoT. These are not equivalent terms; in fact, they have relationships to each other (see Figure 143, “Social, Mobile, Analytics, and Cloud”).
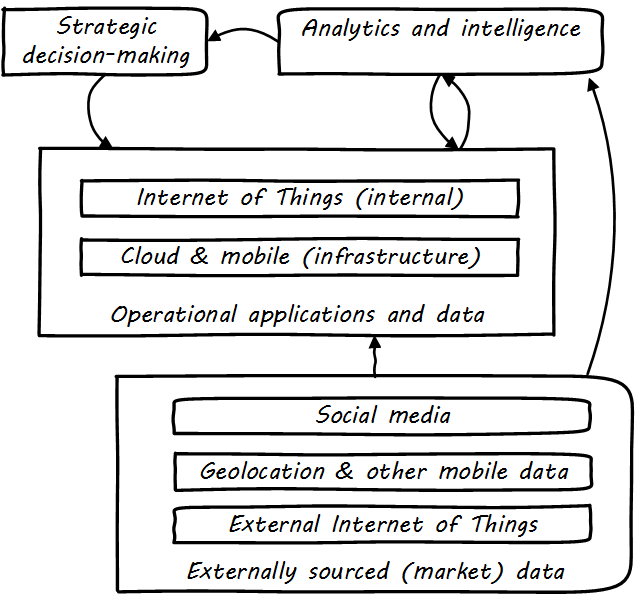
Social media is generally external to an organization and manifests as a form of commercial data, that provides essential insights into bow a company’s products are performing and being received.
Mobile (or mobility) has two distinct aspects: mobility as an engagement platform (e.g., for deployment of “apps” as one product form), versus the commercial data available from mobile carriers, notably geolocation data.
IoT can be either an internal or external data source, often extremely high volume and velocity, requiring analysis services for sense-making and value extraction.
6.4.2.5.2. Big Data
The term "Big Data” in general refers to data that exceeds the traditional data management and data warehousing approaches we have discussed above.
As proposed by analyst Doug Laney in 2001 [173], its most well-known definition identifies three dimensions of scale:
-
Volume
-
Variety
-
Velocity
For example, high-volume data is seen in the search history logs of search engines such as Google.
High-variety data encompasses rich media and unstructured data, such as social media interactions.
High-velocity data includes telemetry from IoT devices or other sources capable of emitting large volumes of data very quickly.
All of these dimensions require increasingly specialized techniques as they scale, and the data management product ecosystem has continued to diversify as a result.
6.4.2.5.3. Managing the Information of Digital Delivery
|
Note
|
We have talked about metadata previously, and understanding business impact with the CMDB. You should review that material before continuing. |
Regarding our previous data warehousing architecture, the digital pipeline can be seen as related to four areas (see Figure 144, “The Data Architecture of Digital Management”):
-
Product management
-
IT
-
Support
-
Operations
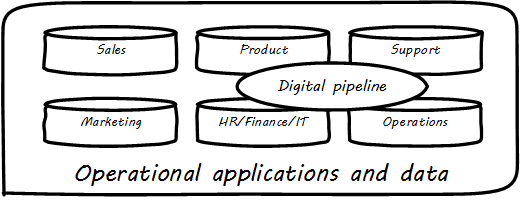
Assume the primary product of the organization is an information-centric digital service, based ultimately on data. How do you manage data? How do you manage anything? In part, through collecting data about it. Wait — “data about data"? There’s a word for that: metadata. We will take some time examining it, and its broader relationships to the digital delivery pipeline. The association of business definitions with particular data structures is one form of metadata. Data governance, records management, and ongoing support for digital consumers all require some layer of interpretation and context to enrich the raw data resource.
Consider the following list:
| Server | Database |
|---|---|
SRV001 |
DB0023 |
SRV001 |
DB0045 |
SRV002 |
DB0067 |
Not very useful, is it? Compare it to:
| Server | Database | Product | Regulatory |
|---|---|---|---|
SRV001 |
DB0023 |
Online reviews |
Customer privacy |
SRV001 |
DB0045 |
Employee records management |
HIPAA, PII |
SRV002 |
DB0067 |
Online sales |
PCI, PII |
We could also include definitions of the tables and columns held in each of those databases. However, what system would contain such data? There have been a couple of primary answers over the years: metadata repositories and CMDBs.
In terms of this document’s general definition of metadata as non-runtime information related to digital assets, both the metadata repository and the CMDB contain metadata. However, they are not the only systems in which data related to digital services is seen. Other systems include monitoring systems, portfolio management systems, risk and policy management systems, and much more. All of these systems themselves can be aggregated into a data warehousing/BI closed-loop infrastructure.
This means that the digital organization, including organizations transforming from older IT-centric models, can apply Big Data, machine learning, text analytics, and the rest of the techniques and practices covered in this Competency Category.
|
Note
|
We will examine a full “business of IT/digital delivery pipeline” architecture in the next Competency Category. |
Evidence of Notability
Considered in each specific topic area.
Limitations
Considered in each specific topic area.
Competency Category "Topics in Information Management" Example Competencies
-
Identify the themes of social, mobile, analytics, and cloud as modern digital channels and platforms
-
Identify the data management concerns of the digital pipeline itself
Related Topics
6.4.3. Architecture
Area Description
Regardless of starting off as a digital startup, or as an older organization now digitally transforming, the digital world is complex and getting more so.
The prior decisions that might have been made quickly and casually by a product or project team become harder. The increasing challenges are due to both internal and external factors. Decisions made years ago come back to haunt current strategies with a vengeance. With scale, management needs some way of making sense across digital operations of mind-numbing complexity. Should a firm invest in 15 new internally developed microservices, or sunset 12 existing ones and implement a commercial package developed by a trusted partner? When there are 1,500 applications or services in the digital portfolio, how do we know that the proposed number 1501 is not redundant or outright conflicting with existing services?
Architecture provides tools to manage such problems, but doing so is difficult and controversial. Is the architecture merely the drawings of HiPPOs? How can the organization maintain an experimental and hypothesis-driven approach in the midst of all the complexity? How do we know that their understanding of the digital operation is current and up-to-date? How much should an organization spend on keeping it so? What happens when management decides to set direction using these same abstractions, and architects find themselves now enforcing what had originally started as mere explanation and sense-making?
Vendor relationships become a two-edged sword, providing increased value with access to higher levels of vendor resources, but at the cost of greater lock-in. Pure open-source strategies inevitably give way to monetized relationships, as the risk of not having support becomes unacceptable.
Portfolio management in terms of IT means looking at long-lived IT investments regarding their overall benefit, cost, and risk to the organization. This can and should be done regardless of whether the IT investment is external or internal-facing. Products, services, and applications are the most useful portfolio constructs, although assets, technology products, and even projects also figure into longer-horizon value management. Enterprise Architecture benefits from a tight alignment with IT portfolio management, as well; it is not clear that a firm boundary between them could be drawn.
This Competency Area is, in a way, summative: it reflects all of the concerns discussed in the previous Competency Areas. Every Competency Area represents topics of interest to the architect. Now, we discuss a language and way of thinking to merge these concerns.
|
Important
|
As with other Competency Areas in the later part of this document, we are going to introduce this topic “on its own terms”. We will then add additional context and critique in subsequent sections. |
6.4.3.1. Why Architecture?
Description
The word “architecture” is usually associated with physical construction: buildings, landscapes, civil infrastructure, and so forth. It was appropriated by systems engineers at IBM around 1960 to describe the problems of designing complex information processing hardware and software. This leads to some confusion, and occasional questions from “real” architects as to why IT people are calling themselves “architects”. Perhaps a different choice of word would have been advisable.
In our journey to date, we have covered:
-
Business motivations and context
-
Products and/or services
-
Organization and process
We have also covered the practices by which ideas and intentions are established and translated by investment into actions, including:
-
Investment of time and resources towards digital objectives (e.g., through project management)
-
Acquisition of technologies and external services (i.e., sourcing)
-
Governance of digital organizations for risk, security, and other purposes
As we have progressed in our journey and scaled our company up, all these areas have continued to evolve. Specialization emerges. You have people with deep experience in cloud architectures and individuals with deep experience in e-records management and compliance. You do not have too many who are deep in both.
Your product portfolio (internal and external) is now in the hundreds or thousands. Some were built with the latest technology, and others run on older technologies now perceived to be dead ends. However, investing in rewriting or re-platforming them would not provide as much value as other uses of the funds, so you have to manage the risk of the older technology.
Investment decisions become harder. You are far beyond the days when you had a one-product focus. You have multiple interacting products and multiple interacting teams, and the relationship between the teams and outputs is not one-to-one. Understanding the business case for the investment gets harder; when you have a thousand services over multiple business units, how do you know if someone is proposing a redundant new one?
Moreover, there are the big headaches. A major commercial product version is going off support, and it is the perfect time to think about a rewrite or re-platform (say into the cloud). However, the moving pieces and interdependencies are formidably complex, and if you get the analysis wrong, the business impact will be severe. You acquire another firm, with a lot of overlapping activities, and start to see the need for “Business Architecture” to clarify your understanding of business processes, organizations, and capabilities. Alternatively, a major outage hits the business hard, and all of a sudden the organizational priority (from the Board on down) is “fix this, so it never happens again”. Everything else is to go “on hold”. Except, of course, it cannot.
In response to these and a thousand other complexities of digital management as organizations scale up, a general-purpose coordination capability emerges sometimes called Enterprise Architecture. In this Competency Category, we will discuss its definition, organizational dynamics, and value proposition.
6.4.3.1.1. Defining Enterprise Architecture
The fundamental concepts or properties of a system in its environment embodied in its elements, relationships, and in the principles of its design and evolution. [157]
The Enterprise Architecture is the organizing logic for business processes and IT infrastructure, reflecting the integration and standardization requirements of the company’s operating model. The Enterprise Architecture provides a long-term view of a company’s processes, systems, and technologies so that individual projects can build capabilities - not just fulfill immediate needs. [237]
Weill
Enterprise Architecture (EA) is the representation of the structure and behavior of an enterprise’s IT landscape in relation to its business environment. It reflects the current and future use of IT in the enterprise and provides a roadmap to reach a future state. [28 p. 35]
Collaborative Enterprise Architecture
The purpose of Enterprise Architecture is to optimize across the enterprise the often fragmented legacy of processes (both manual and automated) into an integrated environment that is responsive to change and supportive of the delivery of the business strategy.
The TOGAF Standard, Version 9.2
“Architecture” as a term by itself is something you have encountered since your earliest days as a startup. Perhaps you used it to describe the choice of technologies you used for your products. Or the most important components in your application. Or the common services (e.g., authentication) you developed to support multiple products. The architecture concept is therefore not something new or foreign. But what does it mean to say we have an “Enterprise” Architecture? Enterprise Architecture is nothing but the unification of this document’s topics into a common, formalized, scalable framework for understanding. It means we are “doing architecture” comprehensively, considering the enterprise itself as a system to be architected. It also may mean we have a program for sustaining the work of those doing architecture in the technical, application, solution, data, process, or business domains.
In terms of our emergence model, Enterprise Architecture assumes multi-product, “team of teams” problems. As an overall domain of practice, Enterprise Architecture encompasses a variety of specialist domains (some of which we have already encountered) as we will discuss in the next Competency Category. Some of those domains do make sense at smaller, single-product contexts (e.g., software architecture).
There are numerous definitions of Enterprise Architecture. See, for example, [157], [237], [28 p. 35]. It can be defined as:
-
An organizational unit
-
An organizational capability
-
A formalized program
-
A professional discipline or set of practices
-
A process or process group; an ongoing activity or activities
-
A large-scale artifact (i.e., an integrated model consisting of catalogs, diagrams, and matrices) maintained on an ongoing basis for communication and planning
-
An integrated and standardized language for reasoning about complexity
In general, definitions of Enterprise Architecture characterize it as a coordination and problem-solving discipline, suited to large-scale problems at the intersection of digital technology and human organization. An important function of architecture is supporting a shared mental model of the complex organization. We were first introduced to the importance of shared mental models in Section 6.2.2, “Work Management” and this need has only increased as the organization became more complex. Enterprise Architecture provides the tools and techniques for sustaining shared mental models of complexity at scale.
It may be useful to compare architecture to the activity of map-making. In map-making we have:
-
The actual terrain
-
The capability of map making: surveying, drawing, etc.
-
The process of surveying and mapping it
-
The resulting map as a document (i.e., artifact)
And once the map is made, you might use it for a wide variety of purposes, and you also might find that once you start to use the map, you wish it had more information. Similarly, in Enterprise Architecture, it is important to remember that there are different concerns:
-
Operational reality
-
The capability of representing it for planning and analysis (“being” an architect or an architecture organization; having the skills and tools)
-
The process of representing and analyzing the operational reality (“doing” architecture)
-
The actual representation (the “architecture” as a “thing” — a model, an artifact, etc.; recall our previous discussion of information representation)
And, like a map, once you have the architecture, you can use it for a wide variety of purposes, but also you may find it incomplete in various ways.
6.4.3.1.2. Architecture Organization
There are three major themes we will discuss in terms of the overall organizational positioning of Enterprise Architecture:
-
The line versus staff concept and its origins
-
Contrasting the concepts of “business model” versus “operating model”
-
The other major organizational units of interest to Enterprise Architecture
We saw in Section 6.4.1, “Governance, Risk, Security, and Compliance” how governance emerges, as a response to scale and growth, and the concerns for risk and assurance in the face of increasing pressures of the external environment. One important response has been the emergence of the line _versus staff_ distinction. As Christian Millotat (and many others) have noted: "[m]any elements that have become integral parts of managerial economics and organizing sciences can be traced back” to military staff systems [197 p. 7]. These include:
-
Collecting and combining knowledge so that decisions are as well informed as possible
-
Supporting specialized roles and functions (e.g., legal experts, engineers)
-
Operating supply chains and other services that function best when shared
Staff functions in the enterprise include planning, coordination, and operations; broadly speaking, and with key differences depending on the industry, the following are considered “staff":
-
Financial management
-
Human resources management
-
Legal services
-
Purchasing and vendor management (varies w/company and industry; for example, in retail “merchandising” is a line function)
-
IT (however, with Digital Transformation this is increasingly overlapping with R&D and driven directly by line management)
-
Facilities management
-
Strategic planning and forecasting
While the following are considered “lines” (analogous to the warfighting units in the military):
-
Sales
-
Marketing
-
Operations
-
R&D (varies w/company and industry)
Enterprise Architecture has as a key part of its mission the task of collecting and combining knowledge to support decision-making. Therefore, an Enterprise Architecture organization can be seen as a form of staff organization. Most often it is seen as a specialized staff function within the larger staff function of IT management, and with the increased role of digital technology, there are corresponding pressures to “move Enterprise Architecture out of IT” as we will discuss below.
The classic line/staff division is a powerful concept, pervasive throughout organizational theory. But it has important limitations:
-
Staff organizations can “lose touch”, become insular and self-serving and indeed accumulate power in dangerous and unaccountable ways; ror this reason, officers are rotated between line and staff positions in the US military
-
Staff “expertise” may matter less and less in complex and chaotic environments requiring experimental and adaptive approaches
-
If a feedback loop involves both line and staff organizations, it risks being delayed; the delay waiting for “headquarters approvals” has been a common theme in line/staff organizations
In the history of line versus staff relations, we see tensions similar to those between Enterprise Architecture and advocates of Agile methods. The challenges, debates, and conflicts have only changed in their content, but not their essential form.
But in many cases, centralizing staff expertise and the definition of acceptable practices for a domain is still essential. See the discussion of matrix organizations and even feature versus component teams.
In terms of overall positioning, Enterprise Architecture is often portrayed as mediating between strategy and portfolio management (see Figure 145, “EA Context, Based on Ross”, derived from [237 p. 10], Figure 1-2).
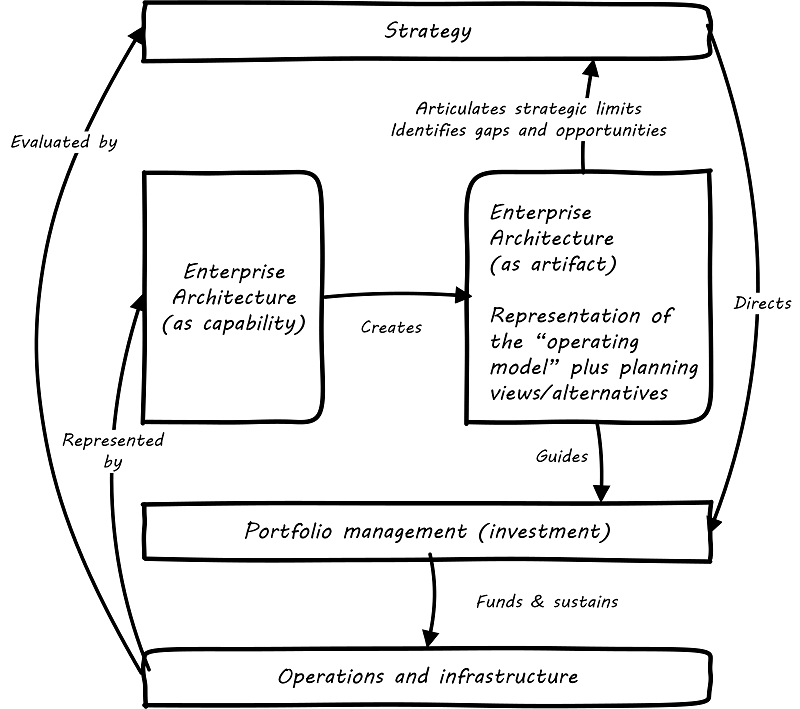
Notice the distinction between Enterprise Architecture as a capability and as an artifact. The practice of Enterprise Architecture is not the same as the actual Enterprise Architecture. For the purposes of this document, we define Enterprise Architecture’s concerns as essentially the enterprise operating model: process, data, organizational capabilities, and systems.
One of the most frequently used visualizations of Enterprise Architecture’s concerns is the Zachman Framework (see Figure 146, “A Variation on the Zachman Framework”, loosely based on [313] and succeeding work).
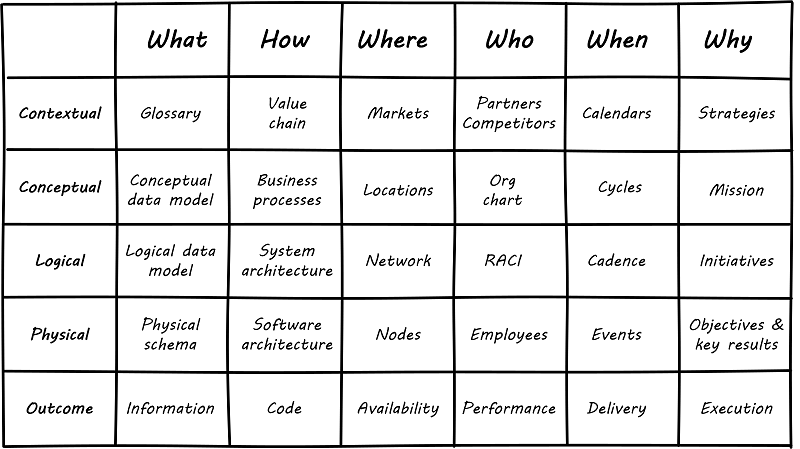
We were exposed to the data modeling progression from conceptual to logical to the physical data model in Section 6.4.2, “Information Management”. The Zachman Framework generalizes this progression to various views of importance to organizations, as shown in the columns:
-
What
-
How
-
Where
-
Who
-
When
-
Why
Overall, the Zachman Framework represents the range of organizational operating model concerns well. Certainly, sustaining a large and complex organization requires attention to all its concerns. But what good does it do to simply document the contents of each cell? Such activity needs to have relevance for organizational planning and strategy; otherwise, it is just waste.
It is reasonable to associate the Business Model Canvas with strategy, and the Zachman Framework with the Enterprise Architecture as an artifact (see Figure 147, “Business Model versus Operating Model”).
This distinction helps us position the Enterprise Architecture group with respect to key partner organizations:
-
Organizational strategy
-
Portfolio and investment management
-
I&O
Organizational Strategy
The operating model needs to support the business model, and so, therefore, Enterprise Architecture needs a close and ongoing relationship with organizational strategists, whether they are themselves line or staff. Defining digital strategies is a challenging topic; we have touched on it in Section 6.1.1.1, “Digital Context”, Section 6.2.1, “Product Management”, and Section 6.3.2, “Investment and Portfolio”. Further discussion at the enterprise level will be deferred to a future edition of this document.
Portfolio and Investment Management
Architecture needs to be tied to the organization’s investment management process. This may be easier said that done, given the silos that exist. As Scott Bernard notes: “Enterprise Architecture tends to be viewed as a hostile takeover by program managers and executives who have previously had a lot of independence in developing solutions for their own requirements” [29], Case Study Scene 1.
Many organizations have a long legacy of project-driven development, in which the operational consequences of the project were too often given short shrift. The resulting technical debt can be crippling. Now that there is more of a move towards “you build it, you run it” the operability aspects of systems are (perhaps) improving. However, ongoing scrutiny and management are still needed at the investment front end, if the enterprise is to manage important objectives like vendor leverage, minimizing technical debt, reducing investment redundancy, controlling the security perimeter, and keeping skills acquisition cost efficient (more on this below in the section on Enterprise Architecture value).
Portfolio management is discussed in depth in a subsequent Competency Category.
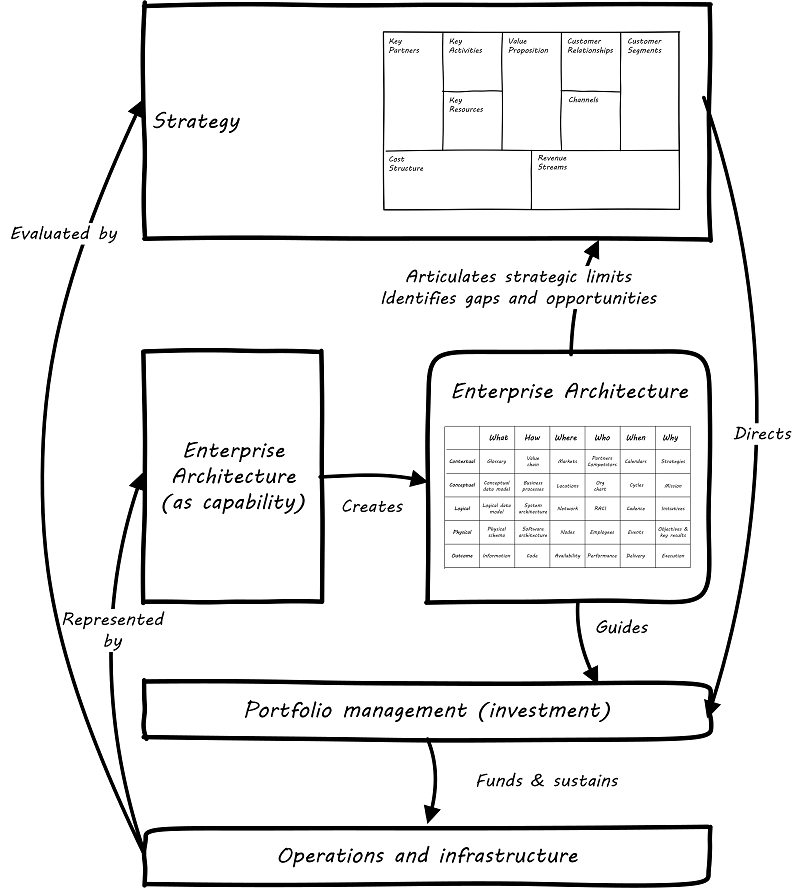
Infrastructure and Operations (I&O)
Finally, the Enterprise Architecture group often has a close relationship with I&O groups. This is because in organizations where operations is a shared service, the risks, and inefficiencies of technical fragmentation are often most apparent to the operations team. In organizations where operations is increasingly distributed to the application teams (“you build it, you run it”) the above may be less true.
Other staff organizations that may develop close relationships with Enterprise Architecture include vendor management and sourcing, risk management, compliance, and security. Notice that some of these have strong governance connections (although we do not consider “governance” itself to be an organization, which is why it was not included in the discussion above).
6.4.3.1.3. The Value of Enterprise Architecture
Enterprise Architecture often struggles to demonstrate clear, quantifiable value to the organization. Architects are usually among the most experienced and therefore expensive staff in the organization. It may seem to make historical and intuitive sense that architecture as a staff function is necessary. Yet, demonstrating this takes some thought and effort. Statements like “promoting enterprise-wide thinking” easily provoke skepticism. What are the benefits of so-called “enterprise-wide thinking"? And who receives them?
The following outcomes are often asserted for Enterprise Architecture:
-
Shortening planning and decision-making (e.g., through curating information)
-
Curating a shared enterprise language and mental model
-
Increased speed of delivering new functionality
-
Reduced and simplified portfolios
-
Reducing duplication and rework
-
Reducing headcount (e.g., in processes)
Illustrated in Figure 148, “Architecture Impacts on Enterprise Value” is a high-level impact mapping representation.
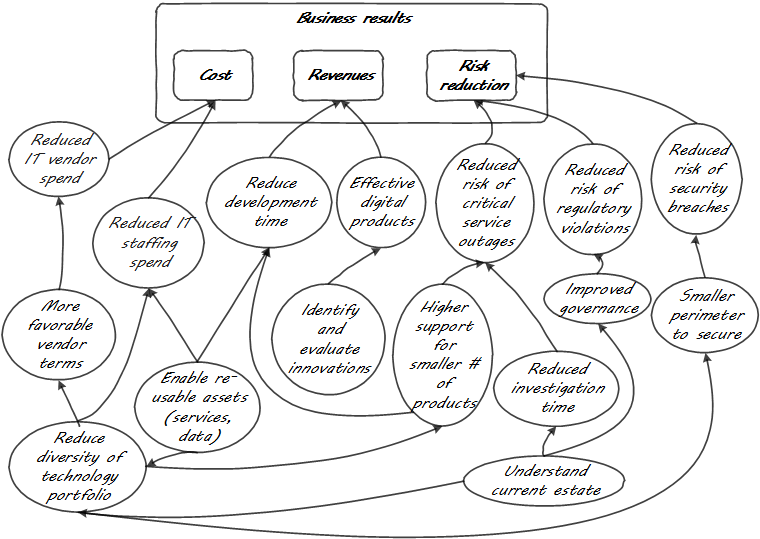
The diagram suggests a number of specific, measurable outcomes from typical Enterprise Architecture goals. Without exploring every line of value:
-
A reduced technology portfolio can and should result in improved sourcing, improved support, improved security, reduced IT staffing spend, and potentially reduced development time; for example, vendors may offer more favorable terms when their products are preferred standards throughout an organization - a smaller product portfolio is easier to secure
-
Better understanding of the current estate should reduce investigation times and outages, and reduce the risk of regulatory violations; for example, if regulators require evidence that employee medical records have not been removed from the country, architecture’s curating of that information will expedite the compliance response
-
Ensuring systems are adaptable (e.g., they have service interfaces) and resilient (they are designed for operability) should improve both time-to-market over the product’s lifecycle, and ultimately effectiveness in customer acquisition and retention
These are not intangible suggestions. We have previously studied the work and influence of Don Reinertsen, who emphasizes the critical importance of an economic model.
|
Important
|
Some might say that architecture’s value is “intangible”. If you are tempted to say this, you should read Douglas Hubbard’s How to Measure Anything: Finding the Value of “Intangibles” in Business [134]. |
We close this section by discussing two current value concepts and how architecture contributes (or detracts) from them:
-
Cost of delay
-
Technical debt
We have covered the concept of cost of delay previously, at the team and product level. However, this powerful concept can also be applied at higher levels. Cost of delay is not a concept familiar to most architects. It poses two important challenges:
-
How can architecture help reduce the cost of delay within the product portfolio?
-
How can architecture not, itself, introduce un-economical cost of delay?
As we have discussed previously, the definition of cost of delay is intuitive. It is the opportunity cost of not having a given product or service available for use: the foregone revenues, the cost of the workarounds and inefficiencies. If the architecture process becomes the critical path for a product or service’s release (a common experience), then the architecture process is responsible for that product’s or service’s cost of delay.
The cost of delay can take various forms, some of them significant. For example, suppose there is a need to demonstrate a product to key clients at a trade show. This could be the company’s best opportunity to develop business; the sales team estimates $12 million in funnel opportunities based on previous experience that should result in at least $2 million in sales in the year, with projections of another $1 million in maintenance and renewals. However, if the product is not ready, these benefits will not materialize. If everything else is ready, but the architecture process is delaying product readiness, then the architecture process is incurring $2 million in the cost of delay. This is bad. The architecture process is clearly impacting significant business objectives and revenue.
But the question still needs to be asked: “what benefits do we receive from having an architecture process?”. We discussed such benefits above. Are these benefits adding up to $2 million a year? No? Then your architecture process does not make good economic sense. On the other hand, what if the architects were kept out of the picture, and the product team chooses an untested technology, instead of re-using a well-known and reliable approach already proven for that company? What if that decision were the cause of missing the trade show? What if it can be shown that re-usable components identified as architecture standards were increasing the speed of delivery, and reducing the cost of delay, because they are reducing the need for product teams to perform risky (and yet redundant) R&D activities?
Quantifying these benefits across a portfolio is difficult, but should be attempted. Cost of delay can and should be calculated at the portfolio level, and this can provide “enterprise-level decision rules” that can help an organization understand the cost and value of operating model changes [229 pp. 35-38] including instituting processes (such as change management or technology lifecycle management), or even the establishment of Enterprise Architecture itself.
We touched on technical debt in Section 6.1.3, “Application Delivery”'s discussion of refactoring. Technical debt is a metaphor first introduced by Ward Cunningham [78] in the context of software, widely discussed in the industry. It can be applied more broadly at the portfolio level, and in that sense, is sometimes discussed in Enterprise Architecture. Debt exists in the form of obsolete products and technologies; redundant capabilities and systems; interfaces tightly coupled where they should be loose and open, and many other forms.
Technical debt, like the cost of delay, can and should be quantified. We will discuss approaches to that in the Competency Category on portfolio management.
We have often referred to the concept of common ground through this document. The architecture supports common ground understanding at scale, by curating a shared mental model for the organization. In doing so, it enables the “right emergent behaviors” (as Adrian Cockcroft suggests). It also enables communication across diversity and may improve staffing flexibility and mobility among teams.
Evidence of Notability
Architecture has been a metaphor for digital systems strategy and design since the 1960s. It has given rise to multiple professional organizations, and frameworks, and much literature.
Limitations
Architecture (all practices) is encountering resistance from digital-first organizations and its messaging and value proposition needs to evolve.
Related Topics
6.4.3.2. Architecture Practices
Description
Before we get into a detailed discussion of architecture domains, let’s talk in general about what architects do and some common practices and themes.
As we mentioned previously, architecture itself as a term shows up in many ways - as role, artifact, program, and organization.
In this Competency Category, we will look at:
-
The relationship of architecture and governance
-
Architecture as a management program
-
The importance of visualization as a practice in architecture
-
The IT lifecycles
-
Architecture and the quest for “rationalization”
6.4.3.2.1. Architecture and Governance
Enterprise Architecture has a clear relationship to governance as we discussed it in Section 6.4.1, “Governance, Risk, Security, and Compliance”. It provides a framework for managing long lifecycle concerns and various forms of enterprise risk, especially as related to digital and IT systems.
Architecture is an important part of the governance equation. Architecture becomes the vehicle for technical standards that are essential risk controls; a risk management organization cannot achieve this alone.
Enterprise Architecture, therefore, may have a role in defining policies, especially at the mid-tier of the policy hierarchy — neither the highest enterprise principles, nor the most detailed technical standards, but rather policies and standards related to:
-
Choice of certain enterprise products expected to be heavily leveraged (e.g., common database and middleware products)
-
Design patterns for solving recurring requirements (e.g., user authentication, load balancing, etc.)
-
System of Record identification and enforcement
As discussed in Section 6.4.1.2.2, “Mission, Principles, Policies, and Frameworks”, there needs to be traceability from tactical standards to strategic codes and principles. The preference for a given database should not be a policy, but having a process that establishes such a preference would be; that is, a policy should exist saying (for example): “there shall be a Technology Lifecycle Management process with the following objectives and scope”. Where appropriate, such policies might also be linked to specific risks as controls or governance elements.
As for all policies, it is important to have some sort of sunset mechanism for Enterprise Architecture guidance. As Bente et al. note: Many Enterprise Architecture-originated policies that appear obsolete today have not always been meaningless … A frequent example is the uncontrolled proliferation of newly-hyped technologies by the IT crowd, and the Enterprise Architecture group’s rigid attempt to reinstitute order. Once the technology has matured, the Enterprise Architecture rules often appear overly strict and suppress a flexible use of the appropriate technology [28], p.19.
The issue with the quote above is that the overall benefits of having (for example) a Technology Lifecycle Management process are not usually quantified in terms of cost and risk avoidance. Without an overall governance mandate and value proposition, Enterprise Architecture activities may seesaw in response to the “issue of the moment”. This is not a recipe for sustainable architecture, whose most important value proposition lies in the long term. Architecture, as a component of coherent governance, requires no less.
As we discussed in Section 6.4.1, “Governance, Risk, Security, and Compliance” governance emerges in part as a response to external forces. Architecture often plays a consultative role when external forces become governance issues; for example:
-
Data custody and System of Record, and relationship to records management
-
Vendor relationship strategies
-
Security risks and controls
Governance is also concerned with efficiency, which also becomes a key architecture concern with associated practices:
-
IT portfolio rationalization
-
Business process optimization
-
Shared services and APIs re-use
-
Master and reference data management
Finally, does Enterprise Architecture promote effectiveness? Effectiveness is often seen as the primary responsibility of “the line” in line/staff paradigms. However, as the impact model suggests, establishing a foundation of re-usability and limiting technical choices can increase the speed with which new products and services are delivered.
6.4.3.2.2. Architecture as a Management Program
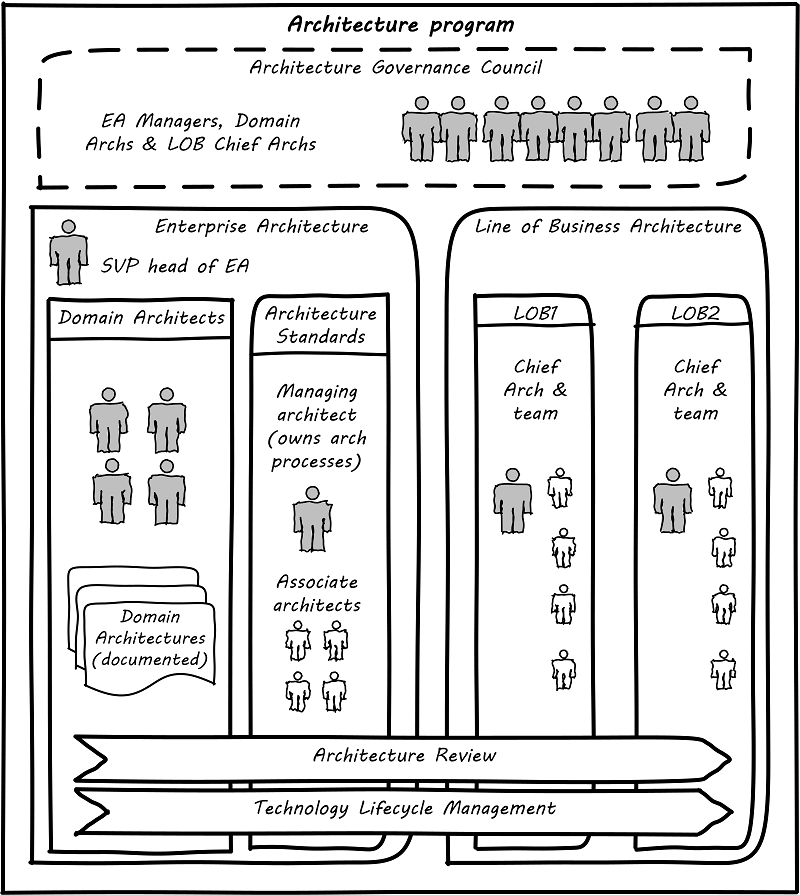
The above section discussed the relationship of architecture to governance. As we covered in Section 6.4.1, “Governance, Risk, Security, and Compliance”, governance is not management. Here, we will cover the topic of architecture as a management program of activity, in part through examining an example large-scale architecture program.
Architecture as a program refers to a coordinated set of:
-
Processes
-
Job roles
-
Standards and practices
-
Artifacts
-
Organizations
-
Cadenced and ad hoc activities
intended to serve a key coordination role. Illustrated in Figure 149, “Large-Scale Architecture Program” is a large-scale, coordinated architecture program in a large enterprise. Notice that this is not a single organization. The Architecture Program in this example spans a centralized Enterprise Architecture group as well as teams of Line of Business (LOB) architects.
The Enterprise Architecture organization might report to a Chief Technical Officer (CTO), the Chief of Staff for the Office of the CIO, or the head of Corporate Strategy and Planning. It is a centralized organization with a small staff of domain architects and an Architecture Standards organization that owns two key cross-functional architecture processes.
LOBs have dedicated IT organizations, and these organizations have Chief Architects with their own staff. In terms of our discussion of line/staff organization, it is as if the line organization has its own staff function within it; another way to think about it is that the line/staff division is fractal (that is, it reproduces at different scales).
Within the central Enterprise Architecture organization, we have a number of director-level Domain Architects. These architects might focus on particular business problems (e.g., Supply Chain) or architectural domains (e.g., Data and Information, or Security).
It is the responsibility of the Domain Architects to create Domain Architectures, which are documents that lay out an overall point of view on a particular domain and often serve as standards. These architectures may be created according to a methodology such as the TOGAF ADM, with the support of a repository-based tool and language such as ArchiMate notation or various standards from the Object Management Group.
The domain architects also serve as a senior consulting pool and are assigned to significant programs and projects as needed.
The Architecture Standards organization is responsible for two organization-wide architecture processes:
-
Architecture Review
-
Technology Lifecycle Management
The Architecture Review process is part of the investment process, when initiatives are initially scoped and direction set. The process requires architects to review significant proposed investments in new systems for consistency with standards (e.g., the Domain Architectures and approved technologies). In terms of the previous section’s impact model, this process is attempting to support many of the lines of value through controlling redundancy and ensuring re-use and application of previously learned architectural lessons.
The Technology Lifecycle Management process is the means by which new vendor and open source products are approved as fit-for-purpose and/or preferred within the organization. In terms of the previous section’s impact model, this process is tasked with reducing the portfolio of vendor products which reduces cost and risk as shown.
Both of these processes are enterprise-wide processes. They are owned, defined, and modified by the Architecture Standards organization, but projects and products across the enterprise follow these processes.
Finally, the Architectural Governance Council brings together the senior architects from the central Enterprise Architecture organization and the LOB Chief Architects. It is a virtual organization operating on a quarterly cadence, responsible for setting direction and resolving the most difficult questions that may emerge from the architecture processes and domain architectures.
Overall, this may seem like a complex structure, but similar structures are in place in IT organizations with budgets of $1bn or more. It would be questionable to see comparable structures in much smaller organizations. However, this structure is useful to examine; organizations of various sizes might choose to use different parts of it.
6.4.3.2.3. Modeling and Visualization
We discussed the importance of visual management in Section 6.2.2, “Work Management”. Making information visually available to help create common ground is an important Lean practice (see Andon).
The word “architect”, whether in a building or digital context, is often associated with visualizations: blueprints, sketches, specialized notations, and so forth. Drawings have been used to represent structures for likely as long as writing has existed.
Judging simply by its history, visualization is, therefore, an essential tool for humans dealing with large-scale complexity (and erecting buildings has always been one of the more complex domains of human activity). In digital and IT contexts, however, visualization has certain challenges and notable skeptics. Adrian Cockcroft, the former CTO of Netflix, stated: “Our architecture was changing faster than you can draw it … As a result, it wasn’t useful to try to draw it.” [37]
Even in construction and engineering trades that rely on blueprints as a source of truth, keeping them up-to-date requires considerable discipline and process. In faster-moving digital organizations, visual models are almost always out-of-date unless they have been specifically refreshed for a purpose, or unless there is a strong formal process in place (and the value of such a process may be difficult to establish). That doesn’t mean that diagrams will go away. Co-located teams use whiteboards and dry-erase markers and will continue to use them. There are important cognitive and human factor reasons for this that will not go away. Because of these facts, it is useful to understand some of the fundamentals of how humans interpret visual data.
Dan Moody notes [199]:
Visual representations are effective because they tap into the capabilities of the powerful and highly parallel human visual system. We like receiving information in a visual form and can process it very efficiently: around a quarter of our brains are devoted to vision, more than all our other senses combined [63]. In addition, diagrams can convey information more concisely [27] and precisely than ordinary language [8, 68]. Information represented visually is also more likely to be remembered due to the picture superiority effect [38, 70] … Visual representations are also processed differently: according to dual channel theory [80], the human mind has separate systems for processing pictorial and verbal material. Visual representations are processed in parallel by the visual system, while textual representations are processed serially by the auditory system …
As the above quote shows, there are clear neurological reasons for diagramming as a communication form. To expand a bit more on the points Dan Moody is making:
Human vision uses parallel processing. This means that a given image or visual stimulus is processed by many neurons simultaneously. This is how we can quickly recognize and act on threats, such as a crouching tiger.
A large percentage of our brain is devoted to visual processing. You will see figures quoted from 25% to 66% depending on whether they are “pure” visual tasks or vision-driven tasks involving other brain areas.
The old saying "a picture is worth a thousand words" is consistent with the science. Diagrams can be both faster and more precise at conveying information; however, this has limits.
Finally, pictures can be more memorable than words.
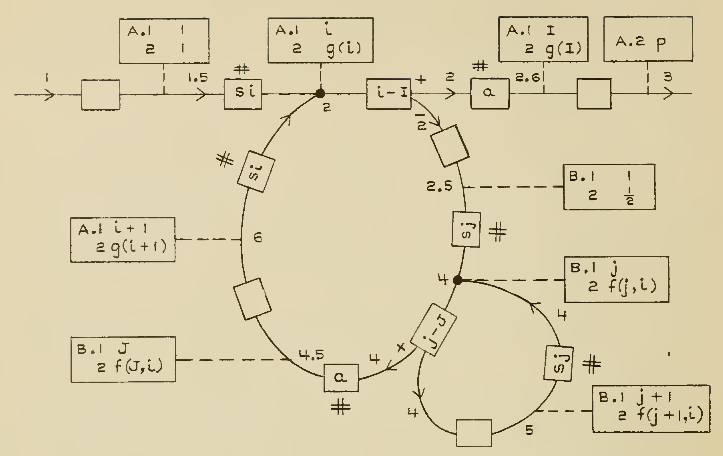
Architects and architecture are known for creating diagrams — abstract graphical representations of complex systems. The first known instance of applying graphical techniques to a digital problem was in 1947 (see Figure 150, “The First Software Flowchart” [11][294]), and visual notations have evolved along with the field of computing ever since. Notable examples include:
-
Early flowcharting templates
-
The Gane-Sarson data-flow diagram notation
-
The Chen entity-relationship notation
-
The Barker entity-relationship notation, including the “crow’s foot” to indicate cardinality
-
Harel state charts
-
The Unified Modeling Language™ (UML®)
(We touched on data modeling in Section 6.4.2, “Information Management”). We will examine the ArchiMate modeling language, a standard of The Open Group, for a current and widely-used notation, in more detail in a future Competency Category.
Research at Microsoft suggests that developers use diagrams for four purposes:
-
Sharing
-
Grounding (defining ambiguous interpretations)
-
Manipulating
-
Brainstorming
They argue “diagrams support communicating, capturing attention, and grounding conversations [4]. They reduce the cognitive burden of evaluating a design or considering new ideas [13]” [58].
But visual notations have been problematic in the Agile community; as Fowler notes [103]. There is no question that some IT professionals, including perhaps some of the most skilled software engineers, find little of use in diagrams. As Martin Fowler says: “people like Kent [Beck, eXtreme Programming originator] aren’t at all comfortable with diagrams. Indeed, I’ve never seen Kent voluntarily draw a software diagram in any fixed notation”. However, it seems likely that Kent Beck and others like him are members of a programming elite, with a well-honed mental ability to process source code in its “raw” form.
However, if we are building systems to be operated and maintained by humans, it would seem that we should support the cognitive and perceptual strengths of humans. Because diagrams are more readily processed, they are often used to represent high-level system interactions — how a given service, product, or application is related to peer systems and services. Building such depictions can be helpful to fostering a shared mental model of the overall system objectives and context. The more complex and highly-scaled the environment, the more likely such artifacts will be encountered as a means to creating the mental model.
The strength of human visual processing is why we will (probably) always use graphical representation to assist in the building of shared mental models. Specialists in the syntax and semantics of such designs will therefore likely continue to play a role in complex systems development and maintenance. Currently, if we seek to hire such a specialist, we recruit some kind of architect — that is, the professional role with the skills.
Note that flowcharts, data models, and other such diagrams tend to be associated more with the idea of “solutions” or “software” architecture. We will cover the architecture domains in the next Competency Category, including examples of Business Architecture diagrams.
Visualization has a number of limitations:
-
It may be better suited for static structures than for dynamic processes
-
Diagrams may have no real information content
-
Diagrams are difficult to maintain, and there are diminishing returns the more they are elaborated and refined (e.g., for archival purposes)
-
Conversely, diagrams become less accessible the more complex they are
-
Visualization can result in distorted understandings
-
Ultimately, diagrams rely on deeper shared understandings that must be understood and managed
Despite the familiarity of simple flowcharting, visual notations don’t scale well in terms of representing program logic. Therefore, for dynamic or procedural problems, they tend to be used informally, as sketch or whiteboarding, or at the business analysis level (where the flowchart represents business logic, not detailed software). Dynamic processes also change more often than the static structures, and so must be updated more frequently.
More static structures, including data and class models and systems interactions, are still often represented visually and in the case of data models can be transformed from conceptual representations to physical schema.
However, any diagram, whether of a dynamic or static problem, can reach a level of density where it is no longer useful as a visual explanation. As diagrams become more complex, their audience narrows to those most familiar with them. Past a certain point, they exceed the limits of human visual processing and then are of little use to anyone.
This brings up broader concerns of the limits of human cognition; recent research shows that it is difficult for humans to hold more than four things in working memory — this is lower than previous estimates [204]. Diagrams with more than four to seven elements risk being dismissed as unusable.
Another issue with some diagrams is that they do not give a good sense of perspective or scale. This is sometimes seen in the Business Architecture practice of “capability mapping”. For example, suppose you see a diagram such as shown in Figure 151, “Simple Capability Map”.
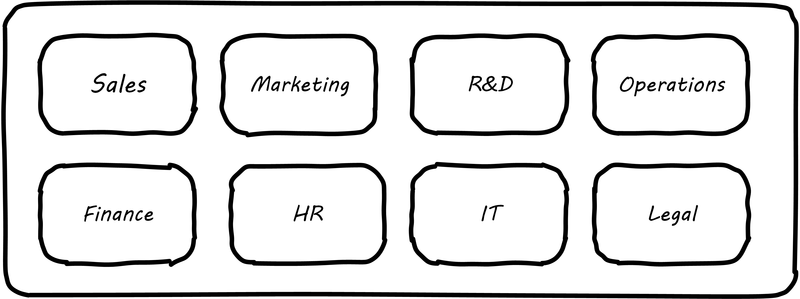
Diagrams like this are common, but what does it mean that all the boxes are equally sized? Are there as many lawyers as sales people? Operations staff? It is not clear what the advantage is to putting information like this into a graphical form; no interactions are seen, and the eight areas could more easily be expressed as a list (or “catalog” in the terms we will introduce below). This brings us to the final problem listed above: visualizations rely on some common ground understanding. If boxes and lines are used for communication, their meaning should be agreed — otherwise, there is a risk of misunderstanding, and the diagram may do more harm than good.
Regardless of the pitfalls, many architecture diagrams are valuable. Whether drawn on a whiteboard, in Powerpoint™ or Omnigraffle™, or in a repository-based architecture tool, the visualization concisely represents a shared mental model on how the organizations will undertake complex activities. The diagram leverages the human preference for visual processing, accessing the powerful parallel processing of the visual cortex. Ultimately, the discussions and negotiations the architect facilitates on the journey to driving organizational direction are the real added value. The architect’s role is to facilitate discussions by abstracting and powerfully visualizing so that decisions are illuminated and understood across the team, or broader organization.
6.4.3.2.4. Repositories and Knowledge Management
Artifacts are generally classified as catalogs (lists of things), matrices (showing relationships between things), and diagrams (pictures of things).
Version 9.2
The question was asked above: “why put things into a picture when a report is all that is needed?”. We know that sometimes a picture is worth a thousand words, but not always. And sometimes the picture’s components need more description than can conveniently fit on the actual diagram. This brings us to the topic of Enterprise Architecture as knowledge management. Knowledge management is a broad topic, with a scope far beyond this document. But in the context of a digital organization, architecture can serve as an important component of an overall knowledge management strategy. Without some common ground of understanding, digital organizations struggle, and Enterprise Architecture can help.
As the previous quote from the TOGAF standard indicates, architecture can elegantly be represented as:
-
Catalogs
-
Diagrams
-
Matrices
For example, consider the image shown in Figure 152, “Process and Function Diagram”.
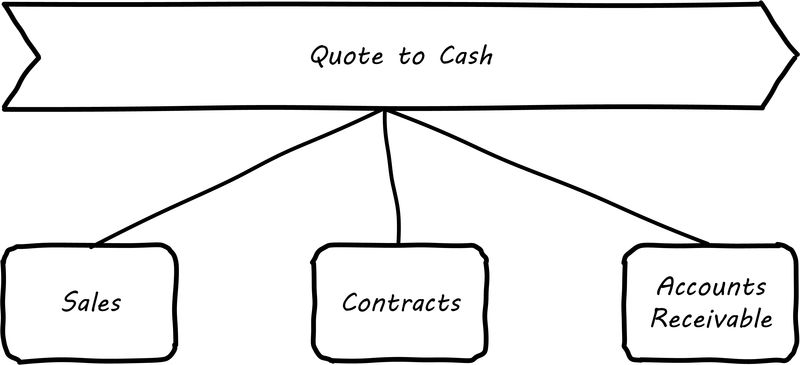
It can be read as saying that the “Quote to Cash” process depends on the following functions:
-
Sales
-
Contracts
-
Accounts Receivable
Notice that a matrix (see Figure 153, “Process and Function Matrix”) can be read in the same way.
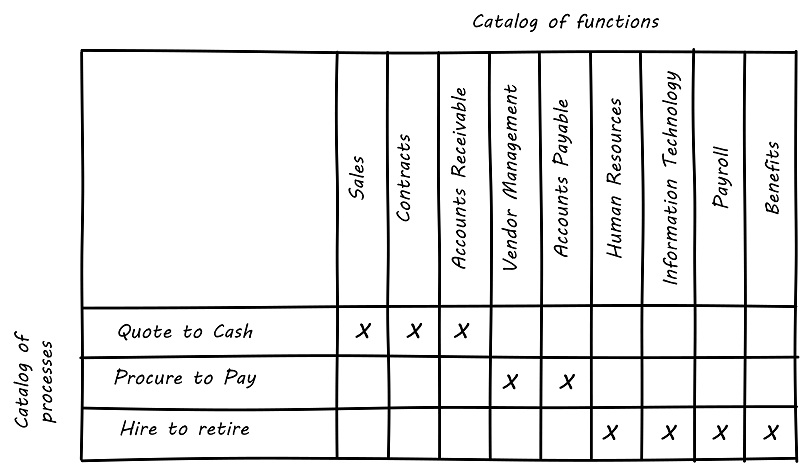
“Quote to Cash”, which appeared as a chevron in the diagram, is now one of a list:
-
Quote to Cash
-
Procure to Pay
-
Hire to Retire
This list can be called a “catalog”. Similarly, there is another catalog of functions:
-
Sales
-
Contracts
-
Accounts Receivable
-
Vendor Management
-
Accounts Payable
-
Human Resources
-
IT
-
Payroll
-
Benefits
The functions appeared as rounded rectangles in the diagram.
There are pros and cons to each approach. Notice that in about the same amount of space, the matrix also documented the dependencies for two other processes and six other functions. The matrix may also be easier to maintain; it requires a spreadsheet-like tool, where the diagram requires a drawing tool. But it takes more effort to understand the matrix.
Maintaining a catalog of the concepts in a diagram becomes more and more important as the diagram scales up. Over time, the IT operation develops significant data by which to manage itself. It may develop one or more definitive portfolio lists, typically applications, services, assets, and/or technology products. Distinguishing and baselining high-quality versions of these data sets can consume many resources, and yet managing the IT organization at scale is nearly impossible without them. In other words, there is a data quality issue. What if the boxes on the diagram are redundant? Or inaccurate? This may not matter as much with a tight-knit team working on their whiteboard, but if the diagram is circulated more broadly, the quality expectations are higher.
Furthermore, it is convenient to have data such as a master lists or catalogs of processes, systems, functions, or data topics. We might also want to document various attributes associated with these catalogs. This data can then be used for operational processes, such as risk management, as we have discussed previously. For these reasons and others, Enterprise Architecture repositories emerge.
When we establish a catalog of architectural entities, we are engaging in master data management. In fact, the architectural concepts can be represented as a form of database schema (see Figure 154, “A Simple Metamodel”).
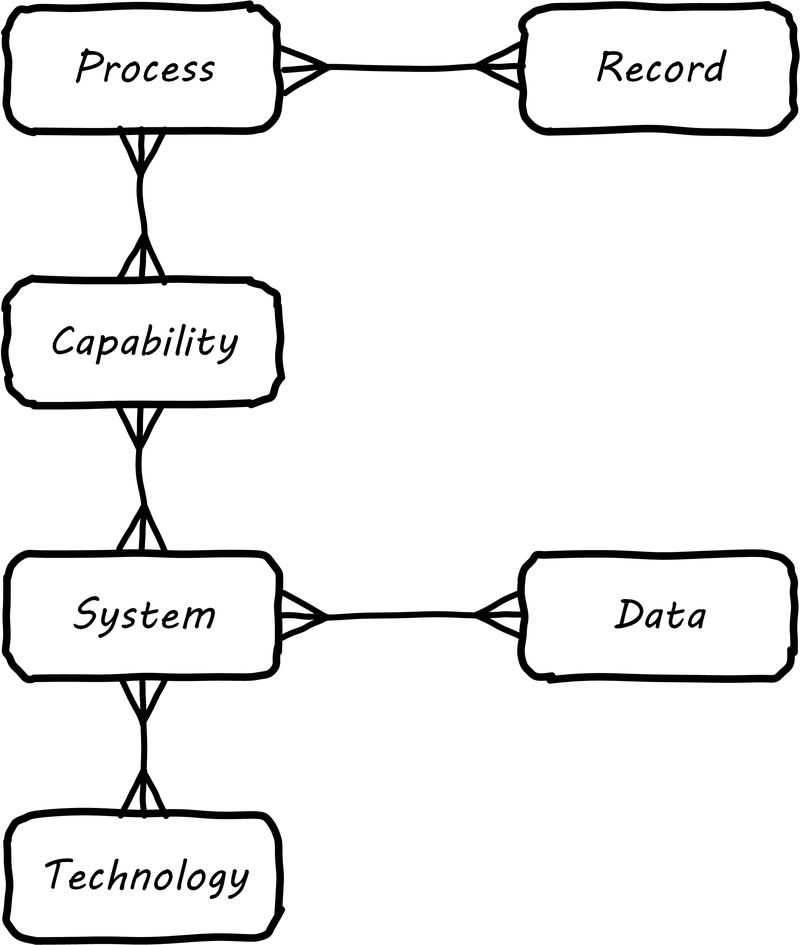
|
Note
|
A data model that organizes data about data and its related systems can be called a metamodel. |
Material that we first saw in diagram form can be stored in a database. Systems that enable this are called Enterprise Architecture repositories. Their data schemas are often called metamodels.
Architecture repositories require careful management. A common anti-pattern is to acquire them without considering how the data will be maintained. The concepts in the repository can be subjective, and if it is intended that they be of high data quality, investments must be made. Some kind of registration process or decision authority must exist for the creation of (for example) a new, official “system” record. Misunderstandings and disagreements exist about the very meaning of terms like “system” or “technology”. (We discussed some of the general issues in Section 6.4.2, “Information Management”, with the ontology problem.) Such issues are especially difficult when Enterprise Architecture repositories and metamodels are involved. Frequent topics:
-
Is an “application” different from a “service"? How?
-
What is the relationship between a “capability” and a “function"? Or a “capability” and a “process?”
-
How can we distinguish between “systems” and “technologies"?
-
What is the relationship between a “product” and a “service”, especially if the service is a market-facing digital one?
-
What is the relationship between:
-
Value chain
-
Value stream
-
Process
-
Activity
-
Task
-
And so on. We might expect that there would be industry standards clarifying such issues, and in some cases there are. In other cases, either there are no standards, or the standards are obsolete or conflicting.
Finally, there are a number of other systems that may interoperate with the architecture repository. The most important of these is the CMDB or CMS that underlies the ITSM tooling. These tools also need to know at least about systems and technologies and may be interested in higher-level concepts such as business capability. However, they usually do not include sophisticated diagramming capabilities or the ability to represent a system’s future state.
Other tools may include project management systems, portfolio management systems, risk management systems, service-level management systems, and others. Application and service master data, in particular, is widely used, and if the Enterprise Architecture repository is a System of Record for this data there will be many outbound interfaces.
|
Note
|
The discussion below also applies to the CMDB as well as other similar repositories. |
Part of the challenge of any repository is what data to manage. How do we think more systematically about this? First, we need to understand why we want to assemble this data in a ready-to-query repository. There are two major reasons why we store data:
-
There are no other sources for it - if we don’t establish a System of Record, the data will go unmanaged, and we won’t know what servers we have, or what applications we are running
-
There may be other sources for the data, even System of Record, but we need an operational data store to bring the various data sources together in a way that makes them more efficient to query
For either kind of data, you need to have an economic understanding of why you want it. Suppose you need to find out what applications you are running because you want to rationalize them. You could invest weeks of research into the question, costing perhaps tens of thousands of dollars worth of yours and others’ time, to create a one-time spreadsheet.
But what happens when there are multiple purposes for the data? You find out that the security group also wants a master list of applications and has been compiling a different spreadsheet, for example. What happens when the same engineers and managers are asked for the same data over and over again because there is no repository to maintain this organizational memory?
The challenge is, when does it make economic sense to pre-aggregate the data? The economic graph shown in Figure 155, “Economic Value of the Enterprise Architecture Repository” may assist in thinking about this.
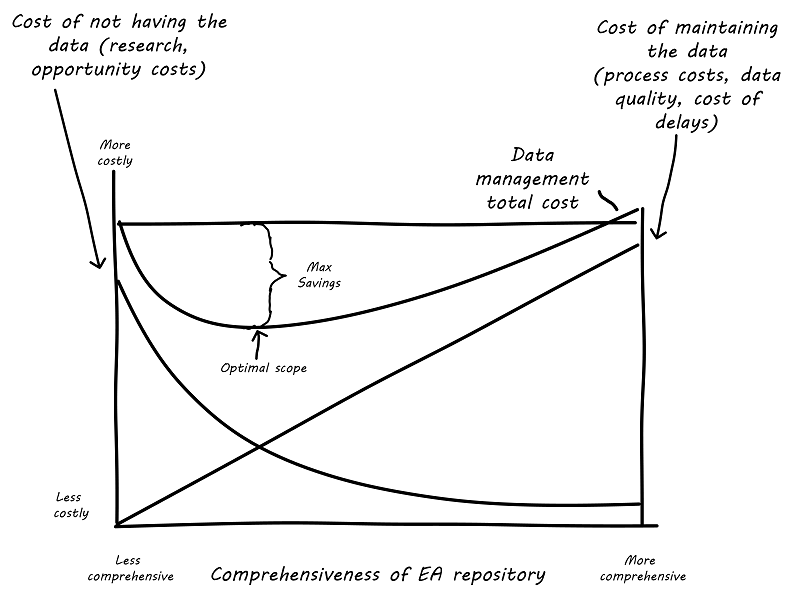
The graph may be familiar to those of you who studied economics. On the left, you have the assumption of no architecture repository, and on the right, you have a comprehensive architecture repository. With a less comprehensive architecture repository, you are paying some cost in research and outage impacts. You also are incurring more risk, which can be quantified. On the other hand, with a comprehensive architecture repository, you incur more costs in maintaining it. You need processes that have a direct cost to operate, as well as imposing indirect costs such as the cost of delay (e.g., if updating the architecture repository slows down the release schedule).
But in the middle is a sweet spot, where you have “just enough” architecture repository data. This optimal architecture repository scope represents the real savings you might realize from instituting the architecture repository and the necessary processes to sustain it.
This is not a complete business case, of course. Your projected savings must be offset against the costs of acquisition and operations, and the remaining “benefit” needs to exceed your organization’s hurdle rate for investments.
6.4.3.2.5. The IT lifecycles
We have discussed products and the various ways digital organizations deliver them, from simple work management to more sophisticated project and process management approaches. Now, we need to refine our understanding of the products themselves and how they are managed.
We previously discussed the relationship between feature versus component teams in Competency Area 4. In Competency Area 9, we touched on the idea of shared services teams. Both of these ideas are now expanded into what is called the "four lifecycle model”.
The four lifecycle model was first documented in [31]. The four lifecycles are:
-
The application service lifecycle
-
The infrastructure service lifecycle
-
The asset lifecycle
-
The technology product lifecycle
Each of these lifecycles reflects the existence of a significant concept, that is managed over time as a portfolio. (More on IT portfolio management practices in Competency Area 12.)
First, bear in mind that services are kinds of products. Digital value is usually delivered as a service, and shares standard service characteristics from an academic perspective, including the idea that services are produced and consumed simultaneously (e.g., an account lookup) and are perishable (a computer’s idle time cannot be recovered if it goes unused).
The first two concepts (application and infrastructure service) below reflect these characteristics; the second two (asset and technology product) do not.
An application service is a business or market-facing digital product, consumed by people whose primary activities are not defined by an interest in IT; for example, a bank customer looking up her account balance, or an Accounts Payable systems operator. In terms of “feature versus component”, the concept of application is more aligned to “feature”. An example would include an Online Banking system or a Payroll system.
The application service lifecycle is the end-to-end existence of such a system, from idea to retirement. In general, the realization such a system is needed originates externally to the IT capability (regardless of its degree of centralization). SaaS usage is also tracked here.
An infrastructure service is, by contrast, and as previously discussed, a digital or IT service primarily of interest to other digital or IT services/products. Its lifecycle is similar to that of the application service, except that the user is some other IT service. An example would be a storage area network system managed as a service or the integrated networking system required for connectivity in a data center. Product as a Service and IaaS are also tracked here.
Note that in terms of our service definition discussion, the above lifecycle concepts are service systems. The lifecycle of service offerings is a business lifecycle having more to do with the go-to-market strategy on the part of the firm. We covered this to some extent in Competency Area 4 and revisited it in Competency Area 12.
An asset is a valuable, tangible investment of organizational resources that is tracked against loss or misuse, and optimized for value over time. It can sit unused and still have some value. Examples would include a physical server or other device, or a commercial software license. Whether assets can be virtual is a subject of debate and specific to the organization’s management objectives (Given the licensing implications of virtual servers, treating them as assets is not uncommon.)
The asset lifecycle is distinct from the service lifecycles, following a rough order including standard supply chain activities:
-
Forecast
-
Requisition
-
Request quote
-
Order
-
Deliver
-
Accept
-
Install/configure
-
Operate
-
Dispose
A contract reserving cloud capacity is also an asset.
Finally, a technology product is a class of assets, the “type” to the asset “instance”. For example, the enterprise might select the Oracle relational database as a standard Technology Product. It might then purchase ten licenses, which are assets.
The technology product lifecycle is also distinct from both the service and asset lifecycles:
-
Identify technical requirement or need
-
Evaluate options
-
Select product (may kick off asset lifecycle)
-
Specify acceptable use
-
Maintain vendor relationship
-
Maintain product (e.g., patching and version upgrades)
-
Continuously evaluate product’s fitness for purpose
-
Retire product from environment
Cloud services need to be managed in terms of their version and interoperability concerns.
The challenge in digital management is “lining up the lifecycles” so that transactional value flows across them (see Figure 156, “Multiple Lifecycle Model”, similar to [31]).
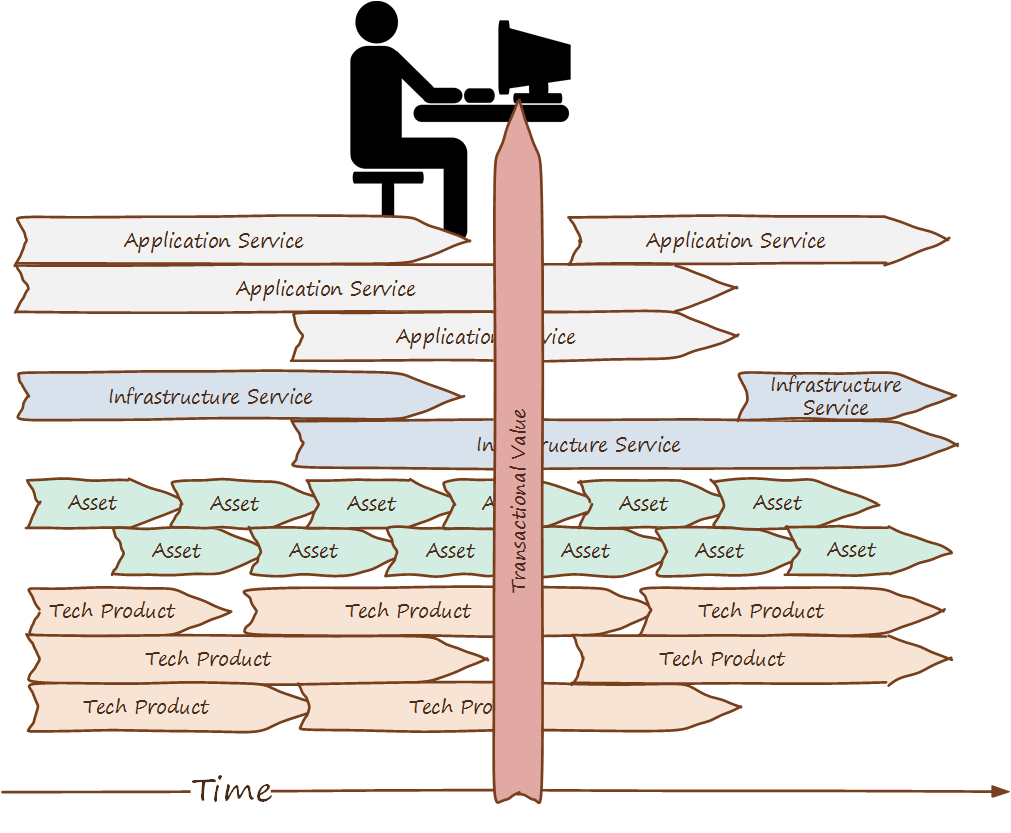
This can be very difficult, as each lifecycle has a logic of its own, and there may be multiple interdependencies. A technology product may come to the end of its market life and drive expensive changes up the stack. Conversely, new application requirements may expose deficiencies in the underlying stack, again requiring expensive remediation. Technology product vulnerabilities can prove disruptive, and the asset lifecycle (representing either physical depreciation and refresh cycles, or time-bound licensing) is a significant cost driver.
6.4.3.2.6. The “Rationalization” Quest
“Rationalization” is often listed as one of the major outcomes of Enterprise Architecture. What is meant by this? Let’s return to our scenario of one company acquiring another. As the newly merged company takes stock of its combined assets, it becomes clear that decisions need to be made. Among other areas, redundant systems exist for:
-
Marketing
-
Human resources
-
Accounting
The digital pipelines also are inconsistent, one being based on Github and Travis CI, the other being based on local Git and Jenkins.
Decisions need to be made as to which systems will be “go-forward”. While the teams involved will have strong input into the system decisions that affect them and will do most of the work, there is concern that some overall view and coordination of the effort is required. What if teams cannot come to a consensus? What if there is an opportunity to save money by standardizing on one vendor to support multiple diverse teams? For these reasons, the company assigns an architect to work closely with the overall merger program.
A merger is a dramatic example of a rationalization scenario. Established, ongoing companies, even without mergers, find that redundancy tends to accumulate. This is a normal outcome of the innovation and commoditization cycle; when technologies are new, organizations may experiment with several providers. When they become more standardized, and commoditized, the desire for efficiency drives rationalization.
One of the challenges for rationalization is whether the economics and business context of any given rationalization effort are well understood. Consistency as an end in itself is not necessarily valuable. The impacts on enterprise value must be established: will the organization actually benefit from improved vendor leverage, operational integration, or a reduced security attack surface? If not, perhaps seeking “rationalization” is not the best use of organizational resources.
Evidence of Notability
Architecture implies a set of practices that can be controversial. Its use as a management program, its use of repositories, and its emphasis on visualization are all notable aspects that are often debated as to their value.
Limitations
Architecture practices such as those discussed here are typically seen only in large organizations requiring institutional continuity.
Related Topics
6.4.3.3. Architecture Domains
In the last section, we discussed what architects do. The focus was primarily architects in a “team of teams” environment, not strictly at the level of a single product team. However, while this Competency Area has a strong Enterprise Architecture orientation, it is also about the practice of “architecture” more generally. In this Competency Category, we will break down the different forms of architecture and their relationships.
We have seen the Zachman Framework previously. The higher levels are considered “business” or “operating model” concerns. Meanwhile, the lower levels are more technical. In discussing the various domains of architecture, however, a simpler structure is useful. The numerous columns in the Zachman Framework don’t necessarily translate to specific architecture domains (for example, there are many data architects representing the “what” column, but not many who specialize strictly in questions of timing — the “when” column). Similarly, we can simplify the number of rows by consolidating them into three.
The ArchiMate modeling language, a standard of The Open Group, is discussed later in the Competency Area. It uses a framework that can be viewed as a simplification of the Zachman model (see Figure 157, “Simplified View of the ArchiMate Framework”).
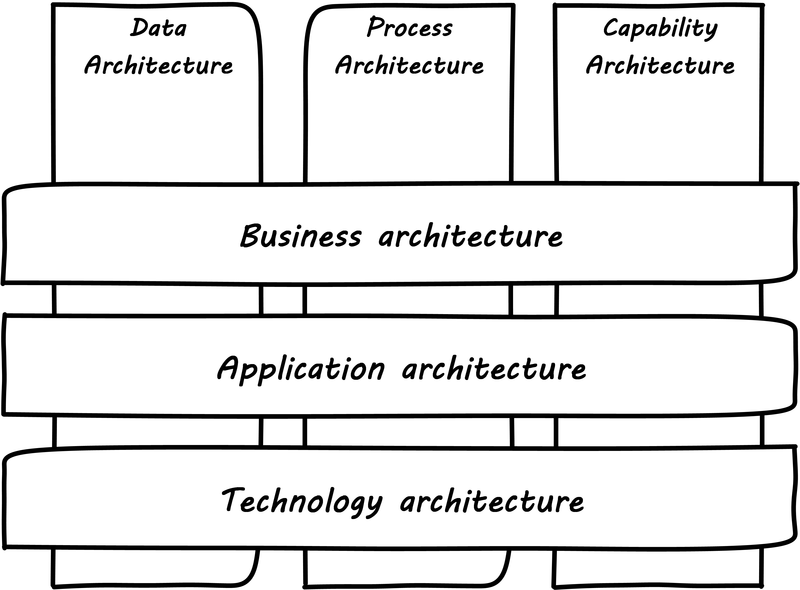
As we look at the overall structure of the architecture disciplines, we have three disciplines that correspond to the columns. We will call these “perspectives":
-
Data Architecture
-
Process Architecture
-
Capability Architecture
And three disciplines that correspond to the hierarchical layers:
-
Business Architecture
-
Application Architecture
-
Technology Architecture
Does this mean that we have nine flavors of architecture, one for each intersection? Not necessarily. Some intersections make more sense than others, and some tend to merge with their neighbors. For example, see the DMBOK [80], which covers the gamut of information and data topics from high-level glossaries all the way down to physical database administration. Data architects can and do work across all levels in their perspective.
6.4.3.3.1. Architecture Perspectives
From top to bottom, the data architecture (“what”) perspective includes concepts such as:
-
The universe or domain of discourse
-
Ontologies, semantics, and conceptual models
-
Logical data models
-
Data subjects and records
-
Classes
-
Entities/attributes/relationships
-
Tables/columns/constraints
We covered data architecture in depth in Section 6.4.2, “Information Management”.
Process architecture is concerned with why and how activities are performed. It includes the detailed, step-by-step understanding of activities, in a transparent way. From top to bottom, it includes concepts such as:
-
Value chain
-
Value stream
-
Business process
-
Algorithm
-
Workflow
-
Activity
-
Procedure
-
Task
-
Step
Importantly, processes cross organizations. An “onboard employee” process, as we have seen, may require participation from multiple organizations. We covered process management in depth in Section 6.3.1, “Coordination and Process”.
The last column in the figure Figure 157, “Simplified View of the ArchiMate Framework” represents steady-state activities. “Hire Employee” is a process; “Manage Human Resources” is a capability. We do not necessarily know all the steps or details; we just know that if we ask the function or capability for some result, it can produce it. This perspective includes:
-
Function and its relatives
-
Function
-
Capability
-
Service (sometimes)
We discussed functional organization previously in Competency Area 9. Note that there is little consensus (and as of the time of writing much industry debate) around whether functions are the same as capabilities; this document sees them as at least similar. Capability is an important concept in Business Architecture, as it has emerged as the preferred concept for investment. We do not invest in data, or process, except as they are realized by a supporting capability. A comprehensive graphical depiction of “capabilities” may be used to help visualize portfolio investments, sometimes using green/yellow/red color coding — this is called "capability heat mapping”.
6.4.3.3.2. Architecture Layers
The Open Group Open Business Architecture (O-BA) Standard defines Business Architecture as: "The formalized description of how an organization uses its essential competencies for realizing its strategic intent and objectives."
The TOGAF Standard, Version 9.2 defines Business Architecture as: "A representation of holistic, multi-dimensional business views of: capabilities, end-to-end value delivery, information, and organizational structure; and the relationships among these business views and strategies, products, policies, initiatives, and stakeholders."
The TOGAF Series Guide: Business Models covers the Osterwalder Business Model Canvas extensively. In so doing, it highlights that the concept of the business model is of interest for Business Architects. Because of this, it is helpful to view Business Architecture as the component of Enterprise Architecture most concerned with the business model, in addition to the operating model.
More specifically, there are a number of concerns that Business Architecture includes:
-
Value Streams
-
Capabilities
-
Organization
-
Information
-
Stakeholders
-
Vision, Strategies, and Tactics
-
Initiatives and Projects
-
Decisions and Events
-
Metrics and Measures
-
Products and Services
-
Policies, Rules, and Regulations
from [50 p. 2]. The reader might notice some overlap with governance elements, which also include Information, Policies, and Organization.
On the other hand, we do not expect to see in Business Architecture the following:
-
Specific technology products
-
Software architectures (design patterns, class models, etc.)
-
Detailed deployment diagrams
-
Specific project plans
-
Detailed flowcharts
-
Specific devices
Application, or application systems, like data, process, and capability, is a fundamental and widely-used architecture perspective, as well as a layer. It can be defined as "a fixed-form combination of computing processes and data structures that support a specific business purpose” [32 p. 125]. An application system is practically relevant, obtainable, and operable. (You can buy, or realistically build, one of these.)
Application architecture can have two meanings:
-
The architecture of a given application
-
The architecture of application interactions
For this document, we will leave the architecture of a given application for solutions and software architecture. Application architecture is the interaction of multiple applications (which may include digital products and/or services, depending on organization terminology). In a complex, multi-product environment, application architecture tends to focus on the interfaces and interactions between the application systems. It is often a concern when systems are considered for retirement or replacement (for example, when a comprehensive ERP solution is brought in to replace several dozen home-grown applications).
Application architecture is also concerned with the application lifecycle, as covered at the start of this section.
Where Business Architecture intersects with the business model, technical architecture overlaps with actual engineering and operations. In particular, technical architecture tends to be concerned with:
-
Identification of new technical platform capabilities: for example, does the organization need to bring in a NoSQL platform? Private cloud?
-
Choice of vendor products, once a technical need is established
-
Establishing infrastructure services as appropriate
-
Defining appropriate usage, including infrastructure design patterns
-
Tracking the lifecycles of the selected products and dependent services, and making appropriate plans
6.4.3.3.3. Other Forms of Architecture
There are other kinds of architecture that don’t fit neatly into this arrangement:
-
Solutions architecture
-
Software architecture
-
Information architecture (UX-related definition)
-
Adaptive systems architecture
Solutions architecture, especially, is a loose term. In general, it is restricted to one product, or a few products which are working together, as a “solution” to a business problem. Within that scope, it may incorporate concepts from infrastructure to Business Architecture. It also connotes more technical concerns.
Architecture represents the significant design decisions that shape a system, where significant is measured by cost of change.
The rapid evolution of software technology has fueled the growth of digital business. Following Internet giants’ lead, some enterprises from the old economy are framing themselves as tech companies; for example, Banco Bilbao Vizcaya Argentaria (BBVA): “If you want to be a leading bank, you have to be a technology company.”.
Internet giants did succeed at retaining the agility of startups while they grow at a fast pace and operate at a global scale. They paid special attention to loose-coupling and team autonomy and they learned how to master distributed computing at scale.
Since loose-coupling and distributed computing at scale are software architecture concerns, digital enterprises have to develop robust software architecture capabilities.
DDD has deeply influenced the software engineering discipline by shifting the attention to the domain. The most significant source of complexity of much software is not technical. It is in the domain itself, the activity or business of the user.
When this domain complexity is not dealt with in the design, it won’t matter that the infrastructural technology is well conceived. A successful design must systematically deal with this central aspect of the software.
The premise of DDD is that:
-
For most software projects, the primary focus should be on the domain and domain logic
-
Complex domain designs should be based on a model
DDD provides strategy patterns that help design loosely-coupled systems. The modular nature of a software system architected with DDD makes it cloud-native friendly by design. The code quality improves because domain concepts are made explicit.
The code is more readable (even by business people) and easier to maintain. Value objects drive a coding style that promotes immutability which makes distributed systems safer. Domain code is more immune from future technology obsolescence because it isolates and protects "domain" code from "technical" code which is more subject to technology obsolescence.
Marc Andreessen once wrote: "Software is eating the world." Evidence of this is the increasing scope of software technology usage. For example, IT infrastructure is becoming a software discipline. Infrastructure as Code and SDNs handle computing and networking resources as software objects. From a DDD perspective this opens domain modeling well beyond business into technology domains.
AI technologies such as Deep Machine Learning push the limits of automation. Software can now perform more and more activities that used to be exclusively performed by human beings such as driving a car or performing a medical diagnosis.
Software becomes a key component of complex product and service systems; for example, an automated parking or a self-service system. This has two implications:
-
Software architecture is morphing into system architecture (systemic meaning of system)
-
Business people have to understand software engineering as they understand marketing or finance
Information architecture may mean the higher, more business-relevant levels of data architecture. However, the term also is used in relation to application architecture, in the sense of how the user understands the meaning and data represented by a website or application, or even just the navigation structure of a website.
Complex Adaptive Systems (CAS) are composed of elements, called agents, that learn or adapt in response to interactions with other agents … The activities of semi-autonomous agents are only partially controlled by current input. So agents can examine different courses of action prior to execution. [130]
In a digital world, aligning business and IT is no longer sufficient. You have to architect the enterprise in such a way that it can adapt to emerging customer and business needs.
The information systems of large organizations are becoming more complex which increases coordination efforts, raises failure rates of large transformation projects, or lowers the enterprise’s agility.
The CAS theory provides key concepts to help design systems that can evolve while complexity is maintained under control (i.e., co-evolution, interconnected autonomous agents, self-organization).
Enterprise Architecture needs to evolve toward an Adaptive Enterprise Model that facilitates its co-evolution with the environment and delegates decision-making to the lowest possible level.
The enterprise develops and delivers products and services that meet the ever-changing needs of customers and markets. Cross-functional features teams or squads led by product owners are given the autonomy to experiment and evolve products and services.
At the enterprise level, strategy defines the purposes that help align autonomous teams. Business models define how the enterprise will co-evolve within its eco-system. Operating models define how the required business capabilities will be supported.
The emergence of product platforms helps reuse capabilities that several products or services need. Product platforms accelerate the creation of new products and lower their development and production costs.
Figure: Figure 158, “Toward an Adaptive Enterprise Model” represents an evolution of the classical enterprise model. It complements it with concepts borrowed from Agile requirements, Lean Start-up and LPPD.
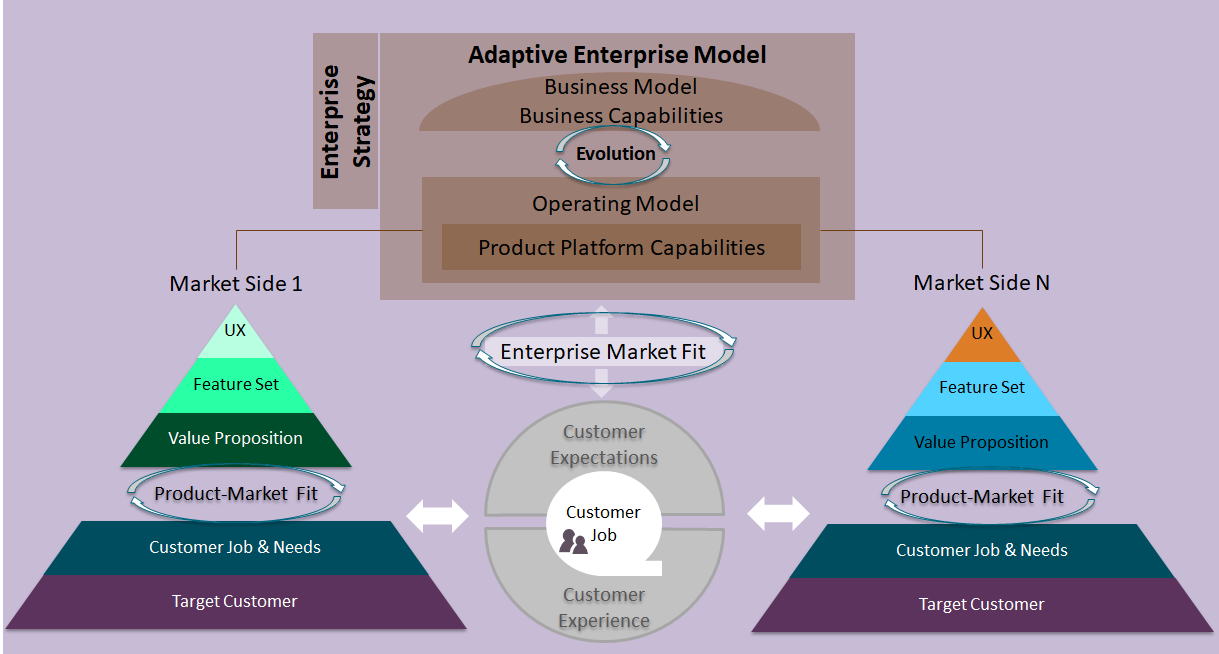
Let’s now zoom in on customer experience. In the old paradigm the enterprise would capture customer requirements and build products and services that meet those. The approach is mainly driven by market studies that try to "guess" what customers need.
In the digital world, guessing is replaced by observation and experimentation. The focus shifts to modeling the "Jobs to be Done" [61] by customers. The rapid development and experimentation of an MVP helps the enterprise confirm its direction or pivot to a different concept.
The art of architecting itself moves from a pure top-down role to a coaching role where capability modeling and modularity principles help define the Minimum Viable Architecture (MVA).
Figure: Figure 159, “The Customer Experience’s Paradigm Shift” illustrates the shift toward an outside-in approach. It has the following benefits:
-
Distinguishing the problem space from the solution space opens innovation opportunities
-
Focusing on capabilities helps improve the enterprise’s business and operating models
-
Fast iterations transform the enterprise into a learning organization capable of adapting to changing customer expectation
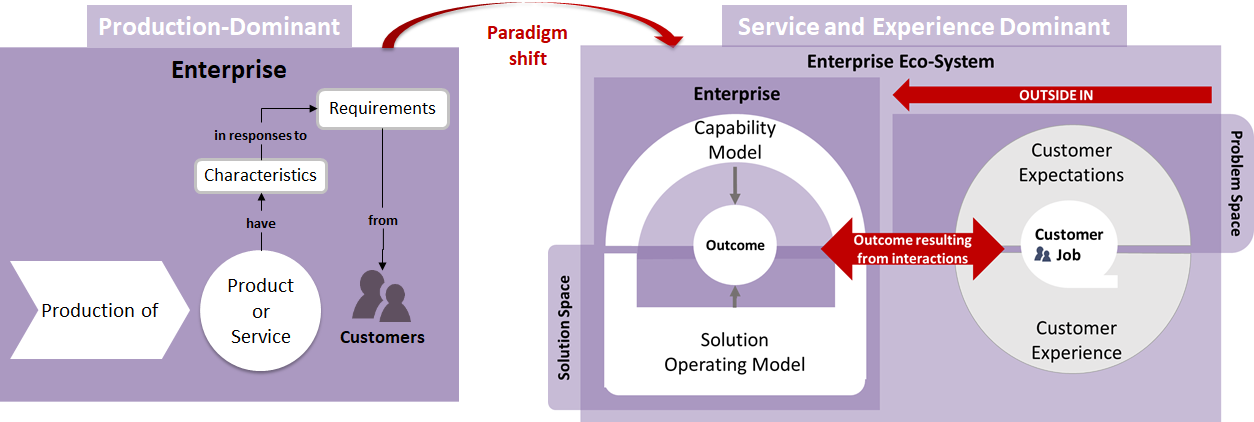
Evidence of Notability
There are a wide variety of architectural practices and approaches frequently addressed and debated within industry. They are codified within the TOGAF standard [279] as well as other literature.
Limitations
Architecture often manifests as an impulse to plan in advance; however, in complex situations it is difficult to plan before a full understanding of the problem is achieved. This is a well-known problem in software engineering.
Related Topics
6.4.3.4. Agile and Architecture
Description
The relationship between architecture (both “enterprise” and other forms of architecture) and current Agile, DevOps, and digital product development approaches is too often troubled. However, the hope is that this document has given you a set of tools for resolving these concepts in a productive way.
6.4.3.4.1. The Agile Critique of Architecture
The goal of Enterprise Architecture is to act as a guide, perhaps a pathfinder, who takes the enterprise on a transformational journey - from an incoherent and complex world with LOB separation, product-specific stovepipes, legacy systems estate, and costly operation to a more rationally organized and useful state with multiservice, revenue-generating platforms and an efficient operational regime. On the way, radical surgeries may be required to eliminate duplication, reduce costs, improve reliability, and increase agility in the business. Enterprise Architecture acts as a strategic foundation for business enablement. [28 p. 9]
Product development organizations often experience architecture and its goals as unwarranted interference, imposing a high cost of delay with little apparent return on investment. Architecture approvals can be required on:
-
Application designs
-
Database designs
-
Selection of technology products
and other such topics. When development cannot proceed without those approvals - or if the approvals come at the cost of expensive rework - the experience can often be challenging. Bente et al. warn: “if Enterprise Architects claim to be the only decision-making body in technical matters, there is a huge risk that they create a bottleneck … The practical consequence is that projects deliberately circumvent the Enterprise Architects …” [28 p. 19].
Enterprise Architecture has presented itself as a solution to complexity, long IT time scales, business frustration, and other various IT problems. These issues are at this writing being solved, but not by architecture — at least not visibly. Instead, visible and publicized progress has come through the increasing adoption of Agile and DevOps practices rethinking open-loop, slow feedback, batch-oriented delivery. Architecture has been challenged on several fronts:
-
It failed to realize the emergent issue of too much enterprise work-in-process, instead championing the proliferation of enterprise processes and their associated queues
-
Architects' motivation for “efficiency” and interest in capability mapping did not help the cause of cross-functional teams
-
Instead, functional silos were reinforced as supply-centric “capabilities”, and the project-centric anti-pattern of “bringing the team to the work” was promoted as enterprise standard operating procedure — despite the growing evidence of Scrum and Agile success. The iterative, experimental narrative of Lean Startup did not originate from Enterprise Architecture.
-
-
Despite a professed interest in systems theory, architecture has failed to adopt a workable systems perspective on digital delivery
-
It did not recognize the fundamental problems of stage-gated delivery, big bang releases, queue proliferation, and so forth. Architecture “gap” analysis resulted in project recommendations, again “bringing the team to the work”.
-
-
Architecture has often deserved the criticism of “top-down planning”, which in complex systems domains too often doesn’t work
-
Architects frequently fall into the trap of the HiPPO. A sense of Lean Startup experimentation, of placing bets on options and testing hypotheses, is not part of the mainstream Enterprise Architecture culture. Instead, the architecture is presented as an established fact, with “governance” to ensure conformity. Hypothetical “synergies” emerging from “common platforms” are often offered as justification for architecture, with little follow-up in measuring actual value delivered.
-
Justifications for architecture often invoke “complexity” in the portfolio of systems. In response, architecture has often given in to the desire for a complete “radical surgery” systems re-engineering, the temptation of the “clean slate”. But as Jez Humble accurately notes:
A common response to getting stuck in a big ball of mud is to fund a large systems replacement project. Such projects typically take months or years before they deliver any value to users, and the switchover from the old to the new system is often performed in “big bang” fashion. These projects also run an unusually high risk of running late and over budget and being canceled. Systems re-architecture should not be done as a large program of work funded from the capital budget. It should be a continuous activity that happens as part of the product development process. [137], Chapter 10.
Architecture methodology, with its focus on identifying capability gaps for feeding into the project portfolio process, has perhaps been too prone to supporting these large, troubled programs. As we know from our earlier Competency Areas, large system changes are inherently risky, and any intervention into a complex system is better undertaken as a series of smaller, incremental changes with frequent monitoring and assessment.
6.4.3.4.2. The Architecture Critique of Agile
The Agile community has its own blind spots and challenges. Speed is seen as a good in itself, too often without an economic model. Agile teams often clash with enterprise governance processes that have sound compliance and financial benefits. Phrases like “you aren’t gonna need it” are used to justify lapses of due diligence on critical capabilities, and standard platforms and vendors are seen as unreasonable limitations on team autonomy — to the point where it seems some teams' interest is primarily in padding their resumes with as many new technologies as possible, regardless of the long-term consequences for the organization.
Cost of delay is a real and often overlooked issue, in understanding the net value of architecture. But it is only a factor and does not eliminate the value proposition of architecture. If the cost of delay is only a few hundred dollars a month, but the risk or technical debt represents millions, then the delay may be appropriate. Don Reinertsen, who has done more than anyone to promote the idea of cost of delay, emphasizes that all decision-making must take place within an economic framework and that means that the other architectural impact factors on organization value must also be considered [230], Chapter 2.
Documentation has been a core concern of the Agile movement, being mentioned in one of the four core principles of the Agile Manifesto:
"Working software over comprehensive documentation.” [8]
When documentation primarily takes the form of secondary artifacts, it is appropriate to question the need for it. “The code is the documentation”, some will argue. While it is true that good coding practices result in easier-to-understand (and maintain) source code, the code cannot be the only documentation. As Ruth Malan notes:
… for systems of sufficient scope and complexity to warrant teams (of teams) working on (incremental) implementation and evolution, the sheer mass of code can make it hard to discover the essential structure from bottom-up decisions made entirely through the medium of code. [186]
In terms of systems theory, a complex software system has emergent behavior, not obvious from just looking at its components. Because the system’s behavior can’t be reduced to its pieces, “self-documenting code” can only go so far. The behavior of the assembled components as a system needs to be represented somehow, in a way that transcends the mere mechanics of the pieces. Abstraction is necessary to understand and communicate emergent behavior, and this leads inevitably to visual representation. Without some attention to documenting overall context and systemic intent and behavior, the effectiveness of the overall human/computer system degrades. For example, Alistair Cockburn reports that the Chrysler Comprehensive Compensation project, one of the first widely reported Agile projects, was eventually halted, and:
… left no archived documentation … other than two-sentence user stories, the tests, and the code. Eventually, enough people left that the oral tradition and group memory were lost. [65 pp. 41-43]
In short, failure to sustain a shared mental model of a complex system is a risk that may result in loss of that system’s value.
Agile and DevOps are software development-centric, and have transformed that world. However, digital organizations don’t always build everything. There is a complex web of supplier relationships even for organizations with robust software development capabilities, and many organizations would still prefer to “buy rather than build”. Software may be consuming the world, but that doesn’t mean everyone employs — or should employ — software developers. Agile has not had a primary focus on sourcing, and evaluating commercial software is not a common Agile topic.
Suppose you have an idea for a digital product, and you know that you will be (at least in part) assembling complex services/products produced by others? Suppose further that these provided services overlap (the providers compete)? You need to carefully analyze which services you are going to acquire from which provider. You will need a strategy, and who is it that analyzes these services and their capabilities, interfaces, non-functional characteristics, and makes a final recommendation as to how you are going to bring them all into one unified system?
It is easy to say things like: “the teams get to define their own architecture”, but at some point, the enterprise must reckon with the cost of an overly diverse supplier base. This is a very old topic in business, not restricted to IT. At the end of the day, supplier and sourcing fragmentation costs real money. Open source, Commercial-Off-The-Shelf (COTS), cloud, in-house … the options are bewildering and require experience. In a sense, the supplier base itself is an inventory, subject to aging and spoilage. (We can consider this another way of understanding technical debt.) A consistent evaluation approach is important (preferably under an economic framework; see Reinertsen & Hubbard). And at some point, product development teams should not have to do too much of their own R&D on possible platforms for their work.
The Agile Manifesto is well known for saying: “The best architectures, requirements, and designs emerge from self-organizing teams” [8]. This is one of the more frequently discussed Agile statements. Former Netflix CTO Adrian Cockcroft has expressed similar views (quote above).
A key question is whether “architecture” is considered at the single product or multi-product level. At the single product level, collaborative teams routinely develop effective software architectures. However, when multiple products are involved, it is hard to see how all the architectural value scenarios are fulfilled without some investment being directed to the goals of cross-product architectural coordination. It helps when rules of the road are established; both Amazon and Netflix have benefited from having certain widely-accepted platform standards, such as “every product communicates through APIs”. Netflix had for a long time a long-term commitment to Amazon cloud services; it was not acceptable for teams there to decide on a whim to deploy their services on Google Compute Engine™ or Microsoft Azure™, so at least in that sense Netflix has an architecture. The question gets harder when layered products and services with complex lifecycle interactions are involved.
Microservices can reduce the need for cross-team coordination, but coordination needs still do emerge. For example, Mike Burrows of Google provides a detailed description of the Chubby lock service [49], which is a prototypical example of a broadly-available internal service usable by a wide variety of other products.
The purpose of a lock service is to “allow its clients to synchronize their activities and to agree on basic information about their environment”. Chubby was built from the start with objectives of reliability, availability to a “moderately large set of clients”, and ease of understanding. Burrows notes that even with such a cohesive and well-designed internal service, they still encounter coordination problems requiring human intervention. Such problems include:
-
Use (“abuse”) in unintended ways by clients
-
Invalid assumptions by clients regarding Chubby’s availability
Because of this, the Chubby team (at least at the time of writing the case study) instituted a review process when new clients wished to start using the lock manager. In terms of Competency Area 7, this means that someone on the product team needed to coordinate the discussions with the Chubby team and ensure that any concerns were resolved. This might conceivably have involved multiple iterations and reviews of designs describing intended use.
Thus, even the most sophisticated microservice environments may have a dependency on human coordination across the teams.
6.4.3.4.3. Towards Reconciliation
So how do we reconcile Agile with architecture practices, especially Enterprise Architecture and its concerns for longer lifecycles, aggregate technical debt, and governance? We need to understand why we look to architecture, what utilizing it means, and how it ultimately adds value, or doesn’t, in the organization.
One principle throughout this document has been “respect the team”, because true product value originates there. If teams are constantly fragmented and their cohesion degraded by enterprise operating models and governance mandates, their ability to creatively solve business problems is hampered. Command and control replace emergence, motivation declines, and valuable creativity is lost. Enterprise Architecture must first and foremost protect the precious resource that is the high-performing, collaborative, creative team. As we have discussed, imposing multiple governance checkpoints itself adds risk. And while it is inevitable that the team will be subject to organization-wide mandates, they should be given the benefit of the doubt when autonomy collides with standardization.
When Enterprise Architecture takes on true Business Architecture questions, including how digital capabilities are to be enabled and enhanced, Agile insights become an input or kind of requirement to Business Architecture. What capabilities require high-performing, cross-functional teams? What capabilities can be supported by project-based temporary teams? And what capabilities should be outsourced? The more valuable and difficult the work, the more it calls for the careful development of a common mental model among a close-knit team over time. Driving organizational capability investment into long-running team structures becomes a strategy that organizational architects should consider as they develop the overall organizational portfolio.
Architecture adds value through constraining choices. This may seem counterintuitive, but the choice is often between re-using a known existing platform or engaging in risky R&D of alternatives. R&D costs money, and itself can impose a delay on establishing a reliable digital pipeline. But ultimately, the fundamental objective remains customer and product discovery. All other objectives are secondary; without fulfilling customer needs, architectural consistency is meaningless. Optimizing for the fast creation of product information, tested and validated against operational reality, needs to be top of mind for the architect.
The digital pipeline ultimately is a finely-tuned tool for this creation of information. It, itself, has an architecture: business, application, and technical. It operates within an economic framework. To understand the architecture of the digital pipeline is in a sense to understand the “architecture of architecture”.
As we have discussed above, architecture, like staff functions generally, is in part a coordination mechanism. It collects and curates knowledge and sustains the organization’s understanding of its complex systems. Architecture also identifies gaps and informs the investment process, in part through collecting feedback from the organization.
If architecture’s fundamental purpose is enabling the right emergent behavior, there are still questions about how it does so. Architecture adds value in assisting when:
-
Systems are too big for one team
-
Features are too complex to be implemented in one iteration
-
Features require significant organizational change management
As a coordination mechanism, it can operate in various ways including planning, controlling, and collaborating. Each may be appropriate for a given challenge or situation. For example, different approaches are required depending on whether the product challenge is flower or cog. A flower is not engineered to fill a gap. A cog is. Market-facing experiments need leeway to pivot, where initiatives intended to fill a gap in a larger system may require more constraints and control. And how do architects know there is a gap? It should be an hypothesis-driven process, that needs to establish that there is a valuable, usable, feasible future state.
As an executing capability, architecture operates in various ways:
-
Planning and analysis
-
Governance and approvals
-
Collaboration and guidance
Ideally, planning and analysis occur “upstream” of the creation of a product team. In that guise, architecture functions as a sort of zoning or planning authority — “architecture” is not a process or organization directly experienced by the product team. In this ideal, there is no conflict with product teams because once the team is formed, the architect’s job is done. However, this assumes that all the planning associated with launching a new product or capability was done correctly, and this itself is a kind of waterfall assumption. Some form of feedback and coordination is required in multi-product environments.
It is in the “governance and approval” kind of activity that conflict is most likely to emerge. Cadence and synchronization (e.g., coordination strategies) with the potential to block teams from pursuing their mission should be very carefully considered. If there is a process or a queue of architecture approvals, it at least should be operated on cost of delay of the work it is blocking. And more generally, across the organization, the process should be tested against an economic model such as establishing a nominal or portfolio-level cost of delay. Like other processes, architecture itself can be assessed against such a baseline.
Queued approvals are only one way of solving issues. A rich and under-utilized approach is using internal market-type mechanisms, where overall rules are set, and teams make autonomous decisions based on those rules. Don Reinertsen, in the Principles of Product Development Flow, discusses how Boeing implemented distributed decision-making through setting trade-off rules for cost and weight. Rather than constantly routing design approvals through a single control point, Boeing instead set the principle that project managers could “purchase” design changes up to $300 per unit, to save a pound of weight. As Reinertsen notes:
The intrinsic elegance of this approach is that the superiors didn’t actually give up control over the decision. Instead, they recognized that they could still control the decision without participating in it. They simply had to control the economic logic of the decision. [230 p. 42]
One particular work product that architects often are concerned with is documentation. The desire for useful documentation, as mentioned above, reflects architecture’s goals of curating a common ground for collaboration. As Bente notes: “In an Agile project, explicit care must be taken to ensure proper documentation; for example, by stating it as part of the condition of satisfaction of a user story or in the definition of done.” [28 p. 170]
Toyota Kata was discussed in Section 6.3.3, “Organization and Culture”. In Lean Enterprise, Jez Humble et al. argue that it can provide a useful framework for architecture objectives. Toyota Kata emphasizes end-state goals (“target conditions”) and calls for hands-on investigation and response by participating workers, not consultants or distant executives. Architecture can benefit by understanding “gaps” in the sense of Toyota’s target conditions, and then support teams in their collaborative efforts to understand and achieve the desired state. The architectural impact model can assist in thinking through suitable target conditions for architecture:
-
Top-line impact through re-use (lowering cost of delay)
-
Bottom-line impact through portfolio rationalization
-
Risk impact through minimizing attack surface and re-use of known good patterns and platforms
Keeping the target operating condition specific is preferable. When architecture scopes problems too broadly, the temptation is to undertake large and risky transformation programs. As an alternative, Humble suggests the "strangler pattern”, proposed by Martin Fowler in 2004 [102]. This pattern uses as a metaphor Australian “strangler” vines that grow around trees until the original tree dies, at which point the strangler vine is now itself a sturdy, rooted structure.
To use the strangler pattern is not to replace the system all at once, but rather to do so incrementally, replacing one feature at a time. This may seem more expensive, as it means that both the old and new systems are running (and cost savings through sunsetting the old system will be delayed). But the risk of replacing complex systems is serious and needs to be considered along with any hoped-for cost savings through replacement. Humble and Molesky suggest:
-
Start by delivering new functionality - at least at first
-
Do not attempt to port existing functionality unless it is to support a business process change
-
Deliver something fast
-
Design for testability and deployability
The strangler pattern is proven in practice. Paul Hammant provides a large number of strangler pattern case studies, including:
-
Airline booking application
-
Energy trading application
-
Rail booking application
and others [120].
Of course, there are other ways architecture might add value beyond system replacement, in which case the strangler pattern may not be relevant. In particular, architects may be called on to closely collaborate with product teams when certain kinds of issues emerge. This is not a governance or control interaction; it is instead architecture as a form of shared consulting “bench” or coordination mechanism. Not every product team needs a full-time architect, the reasoning goes, so architects can be assigned to them on a temporary basis; e.g., for one or a few sprints, perhaps of the technical “spike” (discovery/validation/experimentation) variety.
6.4.3.4.4. The Challenge of the “Hands-On” Architect
Architect is a broad category. It includes individuals who are talented at single-product designs, as well as those tasked with managing the overall interactions between hundreds of systems.
The solution architect needs to have hands-on technical ability. Many Agile authors are dismissive of “ivory-tower” architects who do not do “hands-on” work and, in fact, if an architect is going to sit with a technical team as a solutions advisor they clearly need the technical skills to do so. On the other hand, not all architects operate at the solutions level, nor are the problems they face necessarily programming problems.
It is well and good for architects to maintain some technical facility, but in the case of true, portfolio-level Enterprise Architects, how to do so may not be obvious. What if someone’s portfolio includes multiple platforms and languages? It is simply not possible to be hands on in all of them. Some of the most challenging systems may be a complex mix of commercial product and customization; e.g., ERP or core banking systems. Choosing to be “hands on” may not even be welcomed by a given team, who may see it as meddlesome. And other teams may feel the architect is “playing favorites” in their choice of platform to be “hands on” with.
Clearly, if the organization is running primarily on (for example) Node.js, having strong JavaScript skills is important for the architect. But in more heterogeneous environments the architect may find strong data management skills to be more useful, as often interfaces between systems become their primary concern.
Another form of being “hands on” is maintaining good systems administration skills, so that the architect can easily experiment with new technologies. This is different from being adept in a given programming language. One recent positive trend is lightweight virtualization. In years past, experimenting with new products was difficult on two fronts:
-
First, obtaining high-performance computing resources capable of running demanding software
-
Sometimes these resources needed unusual OSs (e.g., “in order to try our software, you have to run it on a specific version of a well-known OS on a specific hardware platform” — not a capability most architects had in their back pocket).
-
-
Second, obtaining a demonstration version of software from vendors, who would usually start a sales cycle if you asked for it
Times have changed. Demonstration versions of software are increasingly available with little overhead or risk of triggering unwanted sales calls. Platform requirements are less diverse. And lightweight virtualization (e.g., the combination of Vagrant and Virtualbox) now makes it possible for architects to be hands on; modern laptops can run multiple virtual machines in cluster architectures. Significant experimentation can be carried out in working with systems of various characteristics. Being able to evaluate technologies in such a virtual lab setting is arguably even more useful than being a “coding architect”. Product team developers do the programming; the architect should be more concerned with the suitability and feasibility of the integrated platform.
Finally, how do we evaluate architecture outcomes? If an organization adopts an experimental, Toyota Kata approach, it may find that architecture experiments run on long time horizons. Maintaining an organizational focus on value may be challenging, as the experiments don’t yield results quickly. Curating a common ground of understanding may sound like a fine ideal, but how do we measure it?
First, the concept of Net Promoter Score is relevant for any service organization, internal or external. Its single question: “Based on your experience, on a scale of 1-10 would you recommend this product or service to a friend?” efficiently encapsulates value in a single, easy to respond to query.
As digital pipelines become more automated, it may be possible to evaluate their digital exhaust impact on architecture services:
-
Are architecture standards evident in the source and package managers?
-
Are platform recommendations encountering performance or capacity challenges?
In a world of increasing connectivity and automation, there is no reason for architects in the organization to lack visibility into the consequences of their recommendations. Ultimately, if the cost of operating the coordination mechanism that is architecture exceeds the value it provides, then continuing to operate it is irrational.
Evidence of Notability
Agile, DevOps, and architecture often come into contact and even conflict. This friction carries many consequences for organizations wishing to digitally transform, yet not abandon the benefits of architecture.
Limitations
The intersection of Agile and architecture is most significant in organizations that are performing their own digital R&D (i.e., software development).
Related Topics
6.4.3.5. Architecture, Digital Strategy, and Portfolio
Description
The aggregate digital investments of any large enterprise are massive. Whether capital or expense, whether internally hosted or externally sourced, the IT portfolio consumes tremendous amounts of time, money, and expertise. In this chapter, we have discussed architecture in terms of catalogs, diagrams, and matrices, sometimes stored in architecture repositories. But architecture repositories are in general not analytic tools. Nor is architecture an analytic discipline (it is not usually strongly quantitative). Architecture too often relies heavily on interviews and expert opinions, approaches that are sometimes critiqued as relying on the “HiPPO”. Portfolio management can be a means to bring in a more quantitative approach.
We first discussed portfolio management in Section 6.3.2.3, “Portfolio Management”. How do we define portfolio? [32] defines it as: “things of consequence managed over a long time horizon”. The concept of the TOGAF catalog is a good place to start. Frequently, portfolio management starts at the application level; the application portfolio can be seen as a sort of alternate “chart of accounts” by which digital investments can be grouped.
Portfolios are intended to provide a consistent basis for comparison and understanding. Items in the portfolio should be comparable. They may rely on both objective and subjective data points:
-
Objective data
-
Business revenue/value
-
Cost
-
Risks
-
Staffing
-
Service levels, changes, incidents
-
Product obsolescence (quantifiable technical debt)
-
-
Subjective data
-
Usability
-
Customer satisfaction (net promoter score)
-
Engineering assessments (subjective perceptions of technical debt)
-
Digital investments and costs typically include some or all of the following:
-
Hardware investment, depreciation or leasing
-
Software licensing (typically 15%-20% annually of initial acquisition, required for vendor support)
-
Floor space; i.e., real estate charges
-
Facilities infrastructure: power, High Volume Air Conditioning (HVAC), raised floor, racks, etc.
-
Network connectivity and related infrastructure (e.g., directory services software, security perimeters, and the like)
-
Operational software infrastructure: monitoring systems, batch schedulers, backup systems, and so on, all with their own associated costs
-
Operations and support staff; staffing typically can come in various flavors:
-
Data center operations monitors
-
Help desk operators
-
Application specialists
-
Senior engineers
-
Senior IT executives and customer relationship managers
-
Business-side lead users and process and information specialists
-
Vendor relationship owners and contract managers
-
6.4.3.5.1. Application Value Analysis
APM may concern itself with any or all of the following:
-
Business or financial value of applications in terms of what they support/enable
-
Application functions (examined for redundancy)
-
Application total cost of ownership
-
Application complexity
-
Fitness and currency of underlying technical products
-
Application service performance
-
Application customer feedback
A four-box is often used for application value analysis:
| Low Technical Fitness | High Technical Fitness | |
|---|---|---|
High Business Value |
Re-engineer or replatform Consider outsourcing carefully |
Invest as needed to exploit value |
Low Business Value |
Retire if possible or outsource |
Improve understanding of customer requirements Retire service if no longer serving a purpose but reclaim/re-use platform, capabilities, and assets |
6.4.3.5.2. Application Rationalization
What does it mean to rationalize"? There are three steps:
-
Take an inventory of the items to be rationalized
-
Categorize them to identify redundancy
-
Consolidate redundancy
This implies some basis for classification so that the investments can be compared. This is where industry taxonomies, such as found in industry reference architectures, may help. You may call your application “Peoplesoft HR”, “Workday”, or even an internal brand like “HR2020”, but a reference taxonomy categorizes it as simply a “Human Resources Management System”.
Data integrations may also be a way to identify redundancy. When two systems start exchanging more and more data, a useful question is whether there is still a need for both or if a more economical, integrated solution is possible. Just beware of the risk of overly ambitious consolidation efforts.
Through analysis and understanding of redundancy and business and technical value, applications (and related concepts such as services and capabilities) can be managed as a coherent investment strategy. For further information, see the books referenced at the end of this chapter.
Evidence of Notability
Architecture is often called on to rationalize complex assemblies of systems; for example, in the case of an organizational merger. This is some of the most challenging and high-value work in the digital/IT industry.
Limitations
A fully rational, planned approach to portfolio rationalization is extremely difficult, as complex portfolios are dynamic sociotechnical systems and radical interventions frequently give rise to unexpected, emergent responses.
Related Topics
6.4.4. Context IV and DPBoK Conclusion
At this writing, there is much debate on how to unify the value and insights of team-based Agile development, with the coordination and governance needs of the large enterprise. Thinking in terms of the following is recommended as the digital enterprise experience requires their formalization:
-
Governance
-
Information
-
Architecture
However, it is critical not to lose track of the product vision and value you started with at the outset of our emergence journey. Without fast feedback enabling responsive digital services for the customer, none of the rest of it matters.
6.4.4.1. Context IV Architectural View
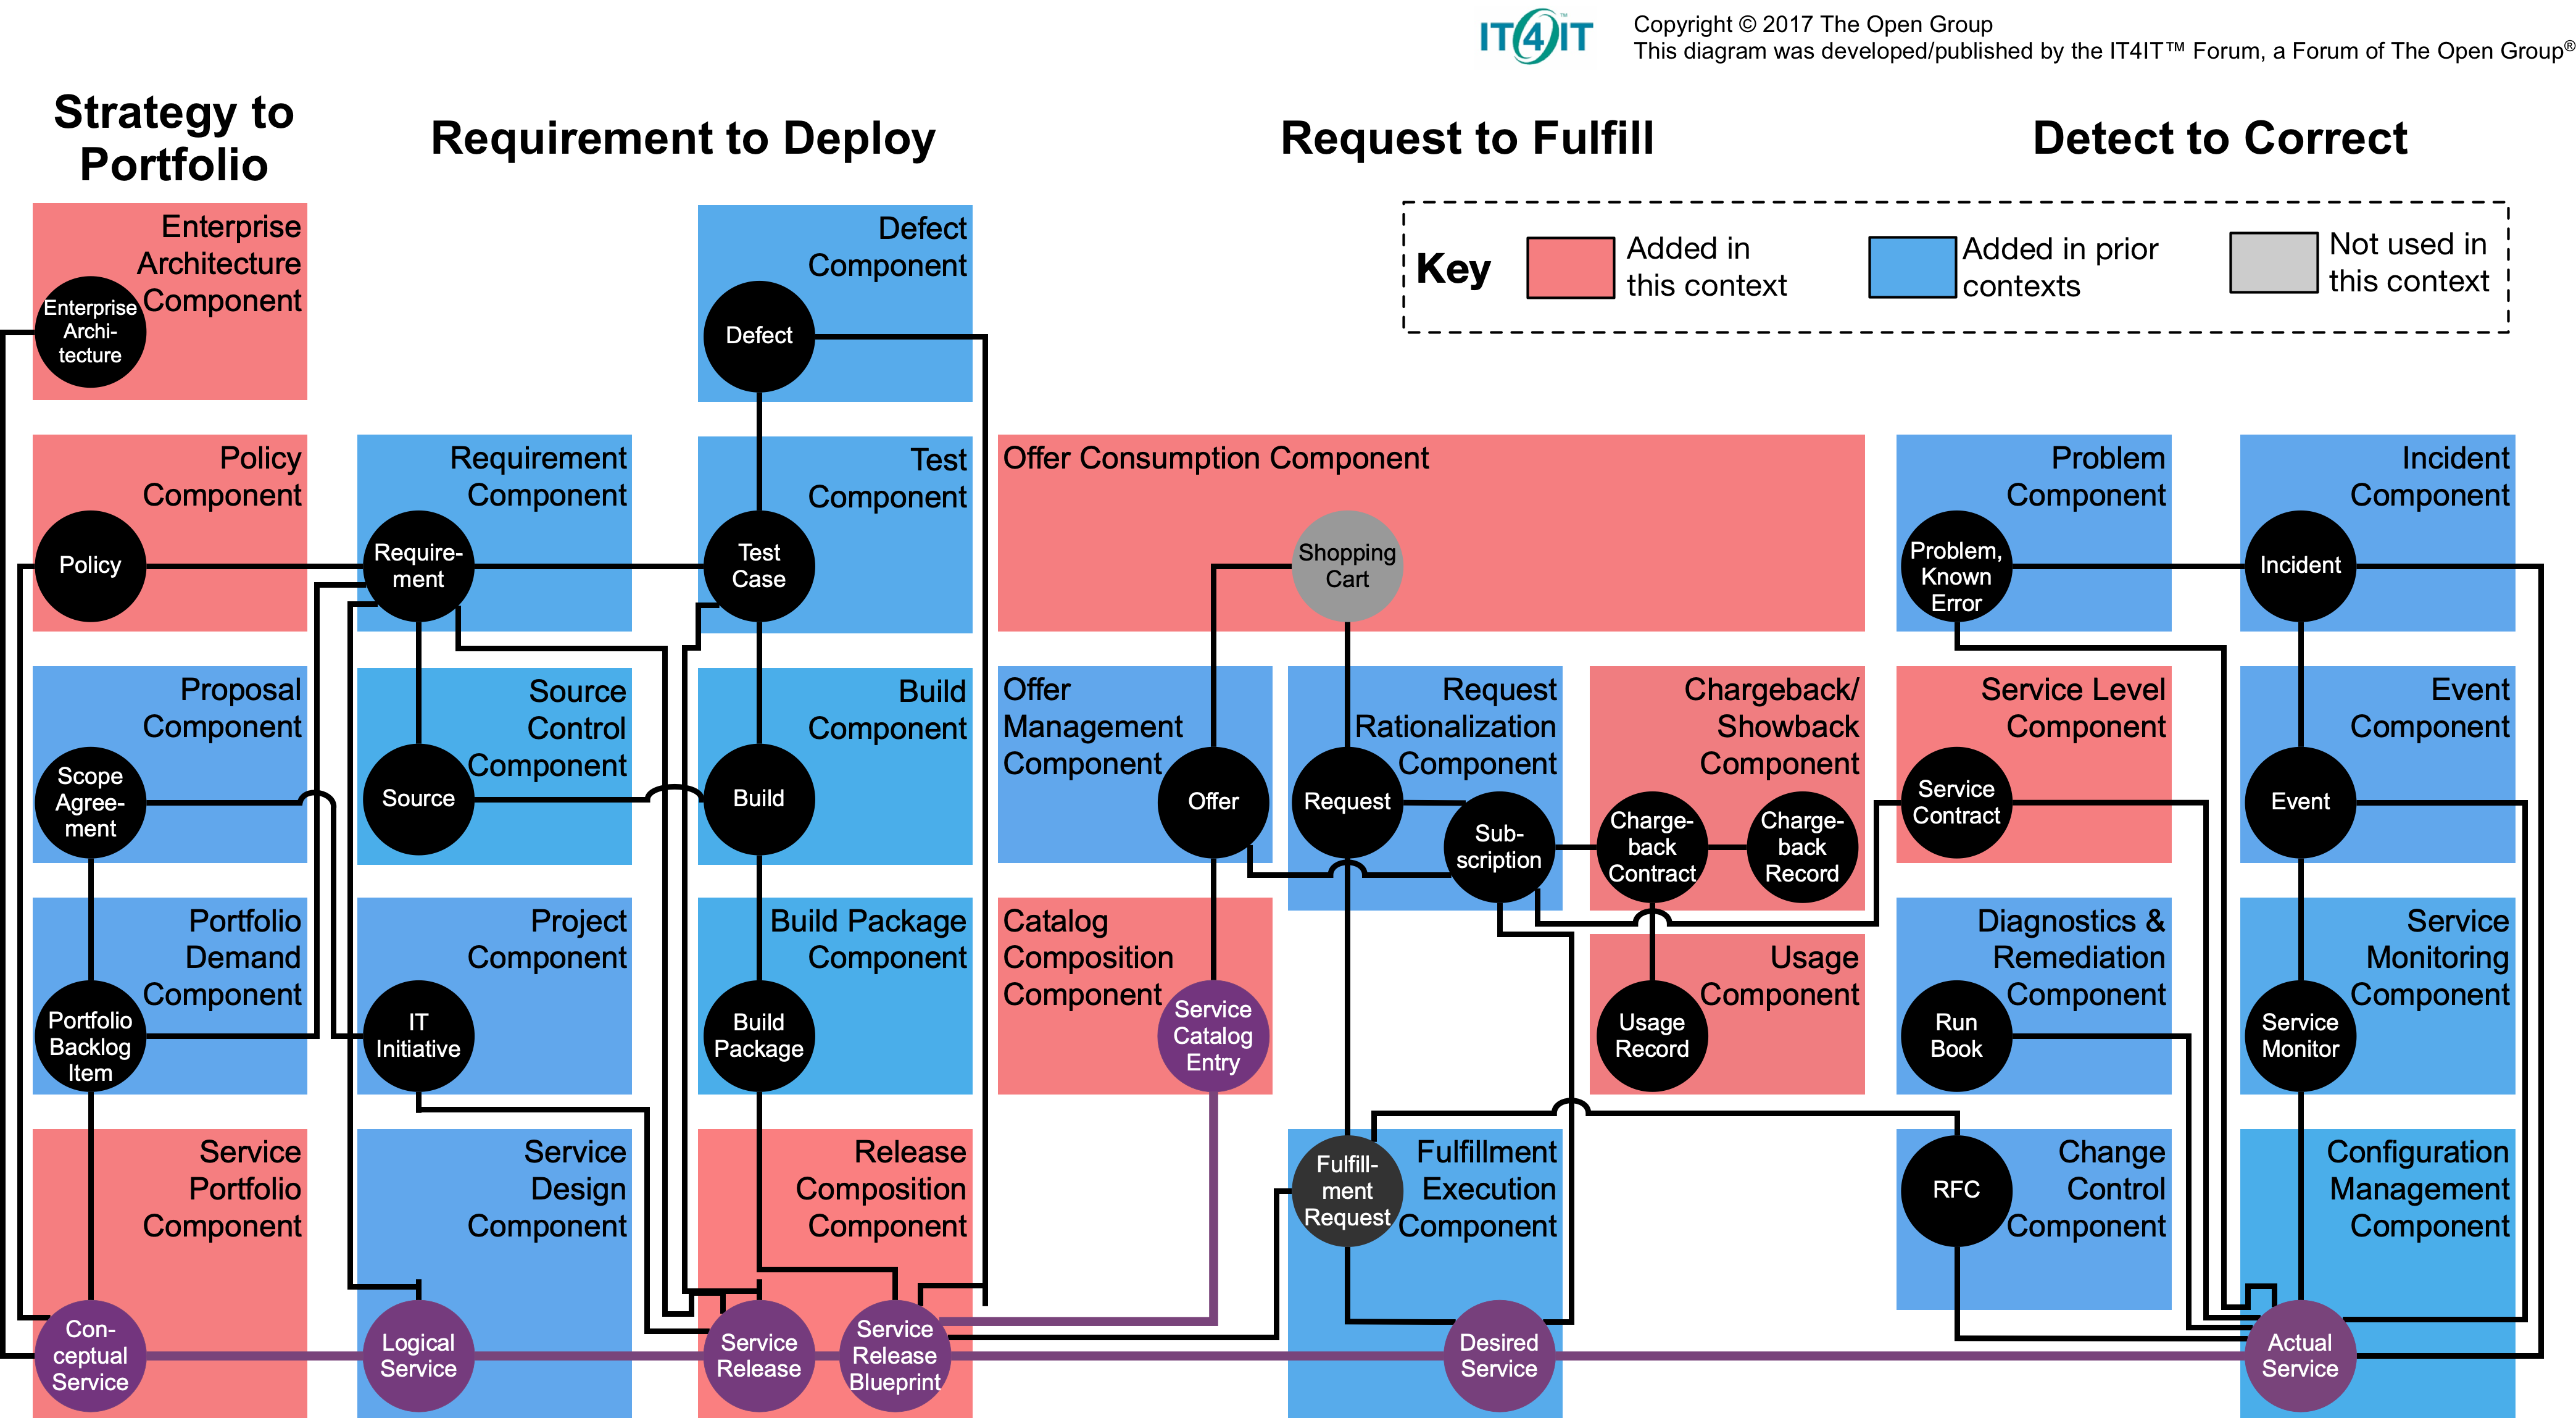
As the organization grows to the largest scale and the longest time horizons (forward and backward), additional components are required for architecture, governance/policy, assurance, portfolio management, service brokering, Supplier Integration and Management (SIAM), and advanced IT financial management. Suggested components at this final context are:
-
Enterprise Architecture Component
-
Policy Component
-
Service Portfolio Component
-
Offer Consumption Component
-
Catalog Consumption Component
-
Chargeback/Showback Component
-
Usage Component
-
Service Level Component
Some of these might arguably appear in earlier phases. Correctly assigning them should be based on empirical research, not anecdote.
Context IV "Architectural View" Learning Objectives
-
Identify the IT4IT components suitable for Context IV
Related Topics
Appendices
Appendix A: Abbreviations
- ADM
-
Architecture Development Method
- AI
-
Artificial Intelligence
- ALM
-
Application Lifecycle Management
- API
-
Application Programming Interface
- APM
-
Application Portfolio Management
- BABOK
-
Business Analysis Body of Knowledge
- BAI
-
Build, Acquire, and Implement
- BI
-
Business Intelligence
- BIM
-
Business Integration Method
- BPA
-
Business Process Automation
- BPM
-
Business Process Management
- BPMN
-
Business Process Modeling Notation
- BPO
-
Business Process Outsourcing
- BPR
-
Business Process Re-engineering
- BYOD
-
Bring Your Own Device
- CAP
-
Consistency, Availability, and Partition-tolerance
- CAS
-
Complex Adaptive System
- CIO
-
Chief Information Officer
- CISSP
-
Certified Information Systems Security Professional
- CLD
-
Causal Loop Diagram
- CMDB
-
Configuration Management Database
- CMM
-
Capability Maturity Model
- CMMI
-
Capability Maturity Model Integration
- CMO
-
Chief Marketing Officer
- CMS
-
Configuration Management System
- CNCF
-
Cloud Native Computing Foundation
- COBIT
-
Control Objectives for Information Technology
- COO
-
Chief Operating Officer
- COTS
-
Commercial Off-The-Shelf
- CPU
-
Central Processing Unit
- CRM
-
Customer Relationship Management
- CSA
-
Cloud Security Alliance
- CSP
-
Cloud Service Provider
- CTO
-
Chief Technical Officer
- CVE
-
Common Vulnerability and Exposures
- CWE
-
Common Weaknesses Enumeration
- DBA
-
Database Administrator
- DDD
-
Domain-Driven Design
- DEEP
-
Detailed, Estimated, Emergent, Prioritized
- DMBOK
-
Data Management Body of Knowledge
- DPM
-
Digital Product Management
- DSS
-
Deliver, Service, and Support
- DW
-
Data Warehouse
- EBM
-
Enterprise Business Management
- EDM
-
Evaluate, Direct, and Monitor
- EDP
-
Electronic Data Processing
- EDPAA
-
Electronic Data Processing Auditors Association
- ERM
-
Enterprise Resource Management
- ERP
-
Enterprise Resource Planning
- ESM
-
Enterprise Service Management
- ETL
-
Extract, Transform, Load
- FOSS
-
Free and Open-Source Software
- GPL
-
GNU General Public License
- GRC
-
Governance, Risk Management, and Compliance
- HIPAA
-
Health Insurance Portability and Accountability Act
- HiPPO
-
Highest Paid Person’s Opinion
- HVAC
-
High Volume Air Conditioning
- IaaS
-
Infrastructure as a Service
- IaC
-
Infrastructure as Code
- IDEF
-
Integration DEFinition
- IGOE
-
Input/Guide/Output/Enabler
- I&O
-
Infrastructure and Operations
- I/O
-
Input/Output
- IoT
-
Internet of Things
- ISACA
-
IS Audit and Control Association
- ITGC
-
Information Technology General Control
- ITIL
-
IT Infrastructure Library
- ITPA
-
IT Process Automation
- ITSM
-
IT Service Management
- JVM
-
Java Virtual Machine
- KPI
-
Key Performance Indicator
- LOB
-
Line of Business
- LPPD
-
Lean Product and Process Development
- MEA
-
Monitor, Evaluate, and Assess
- MVA
-
Minimum Viable Architecture
- MVP
-
Minimum Viable Product
- NIST
-
National Institute of Science and Technology
- NVD
-
National Vulnerability Database
- OODA
-
Observe, Orient, Decide, Act
- OS
-
Operating System
- OWASP
-
Open Web Application Security Project
- PaaS
-
Platform as a Service
- PaaS
-
Product as a Service
- PCI
-
Payment Card Industry
- PDCA
-
Plan–Do–Check–Act or Plan–Do–Check–Adjust
- PLM
-
Product Lifecycle Management
- PMBOK
-
Project Management Body of Knowledge
- PMI
-
Project Management Institute
- PMO
-
Project Management Office
- POS
-
Point of Sale
- PSI
-
Potentially Shippable Increment
- R&D
-
Research and Development
- RACI
-
Responsible, Accountable, Consulted, Informed
- RAM
-
Random Access Memory
- RDS
-
Relational Database Service
- RFI
-
Request for Information
- RFP
-
Request for Proposal
- RFQ
-
Request for Quote
- SaaS
-
Software as a Service
- SBCE
-
Set-Based Concurrent Engineering
- SAFe
-
Scaled Agile Framework
- SCM
-
Supply Chain Management
- SDLC
-
Software Development Lifecycle
- SDN
-
Software-Defined Network
- SIAM
-
Service Integration and Management
- SLA
-
Service-Level Agreement
- SOA
-
Service-Oriented Architecture
- SOX
-
Sarbanes-Oxley (Act)
- SPM
-
Service Portfolio Management
- SQL
-
Structure Query Language
- SRE
-
Site Reliability Engineering
- SSDLC
-
Secure Software Development Lifecycle
- STPA
-
Systems Theoretic Process Analysis
- TBM
-
Technology Business Management
- UML
-
Unified Modeling Language
- URI
-
Uniform Resource Identifier
- UX
-
User Experience
- VLAN
-
Virtual LAN
- VSM
-
Value Stream Map
- WBS
-
Work Breakdown Structure
- WSJF
-
Weighted Shortest Job First
- XP
-
eXtreme Programming