Previous section.
UMA Data Pool Definition (DPD)
Copyright © 1997 The Open Group
Data Capture Overview
The following is a brief overview of the data capture process
from obtaining the raw data to producing a finished metric for
use by a Measurement Application Program (MAP).
Data Capture Modes
The modes of capturing data for either presentation as reports or
subsequent use by other tools includes:
- Note:
- Event and interval extension headers meet the needs of
all four data capture modes.
Interval messages represent both sampled and interval data,
and event messages represent both event and trace data.
Metrics
The end metrics that the MAPs see are usually formed from
raw counters that are kept by the system, subsystem or application.
For interval data,
the metric is formed by taking the difference of two samples
of a counter which is continually incremented since the last restart.
For sampled data,
two metrics are formed for an interval: a count of events and the
number of samples.
- Note:
- Data items in this document are the end metrics that the
MAPs see and not the raw counter data.
From Raw Data to End Metric
The process of providing, collecting, transforming and delivering
the data to the MAPs is one of the main concerns for the UMA.
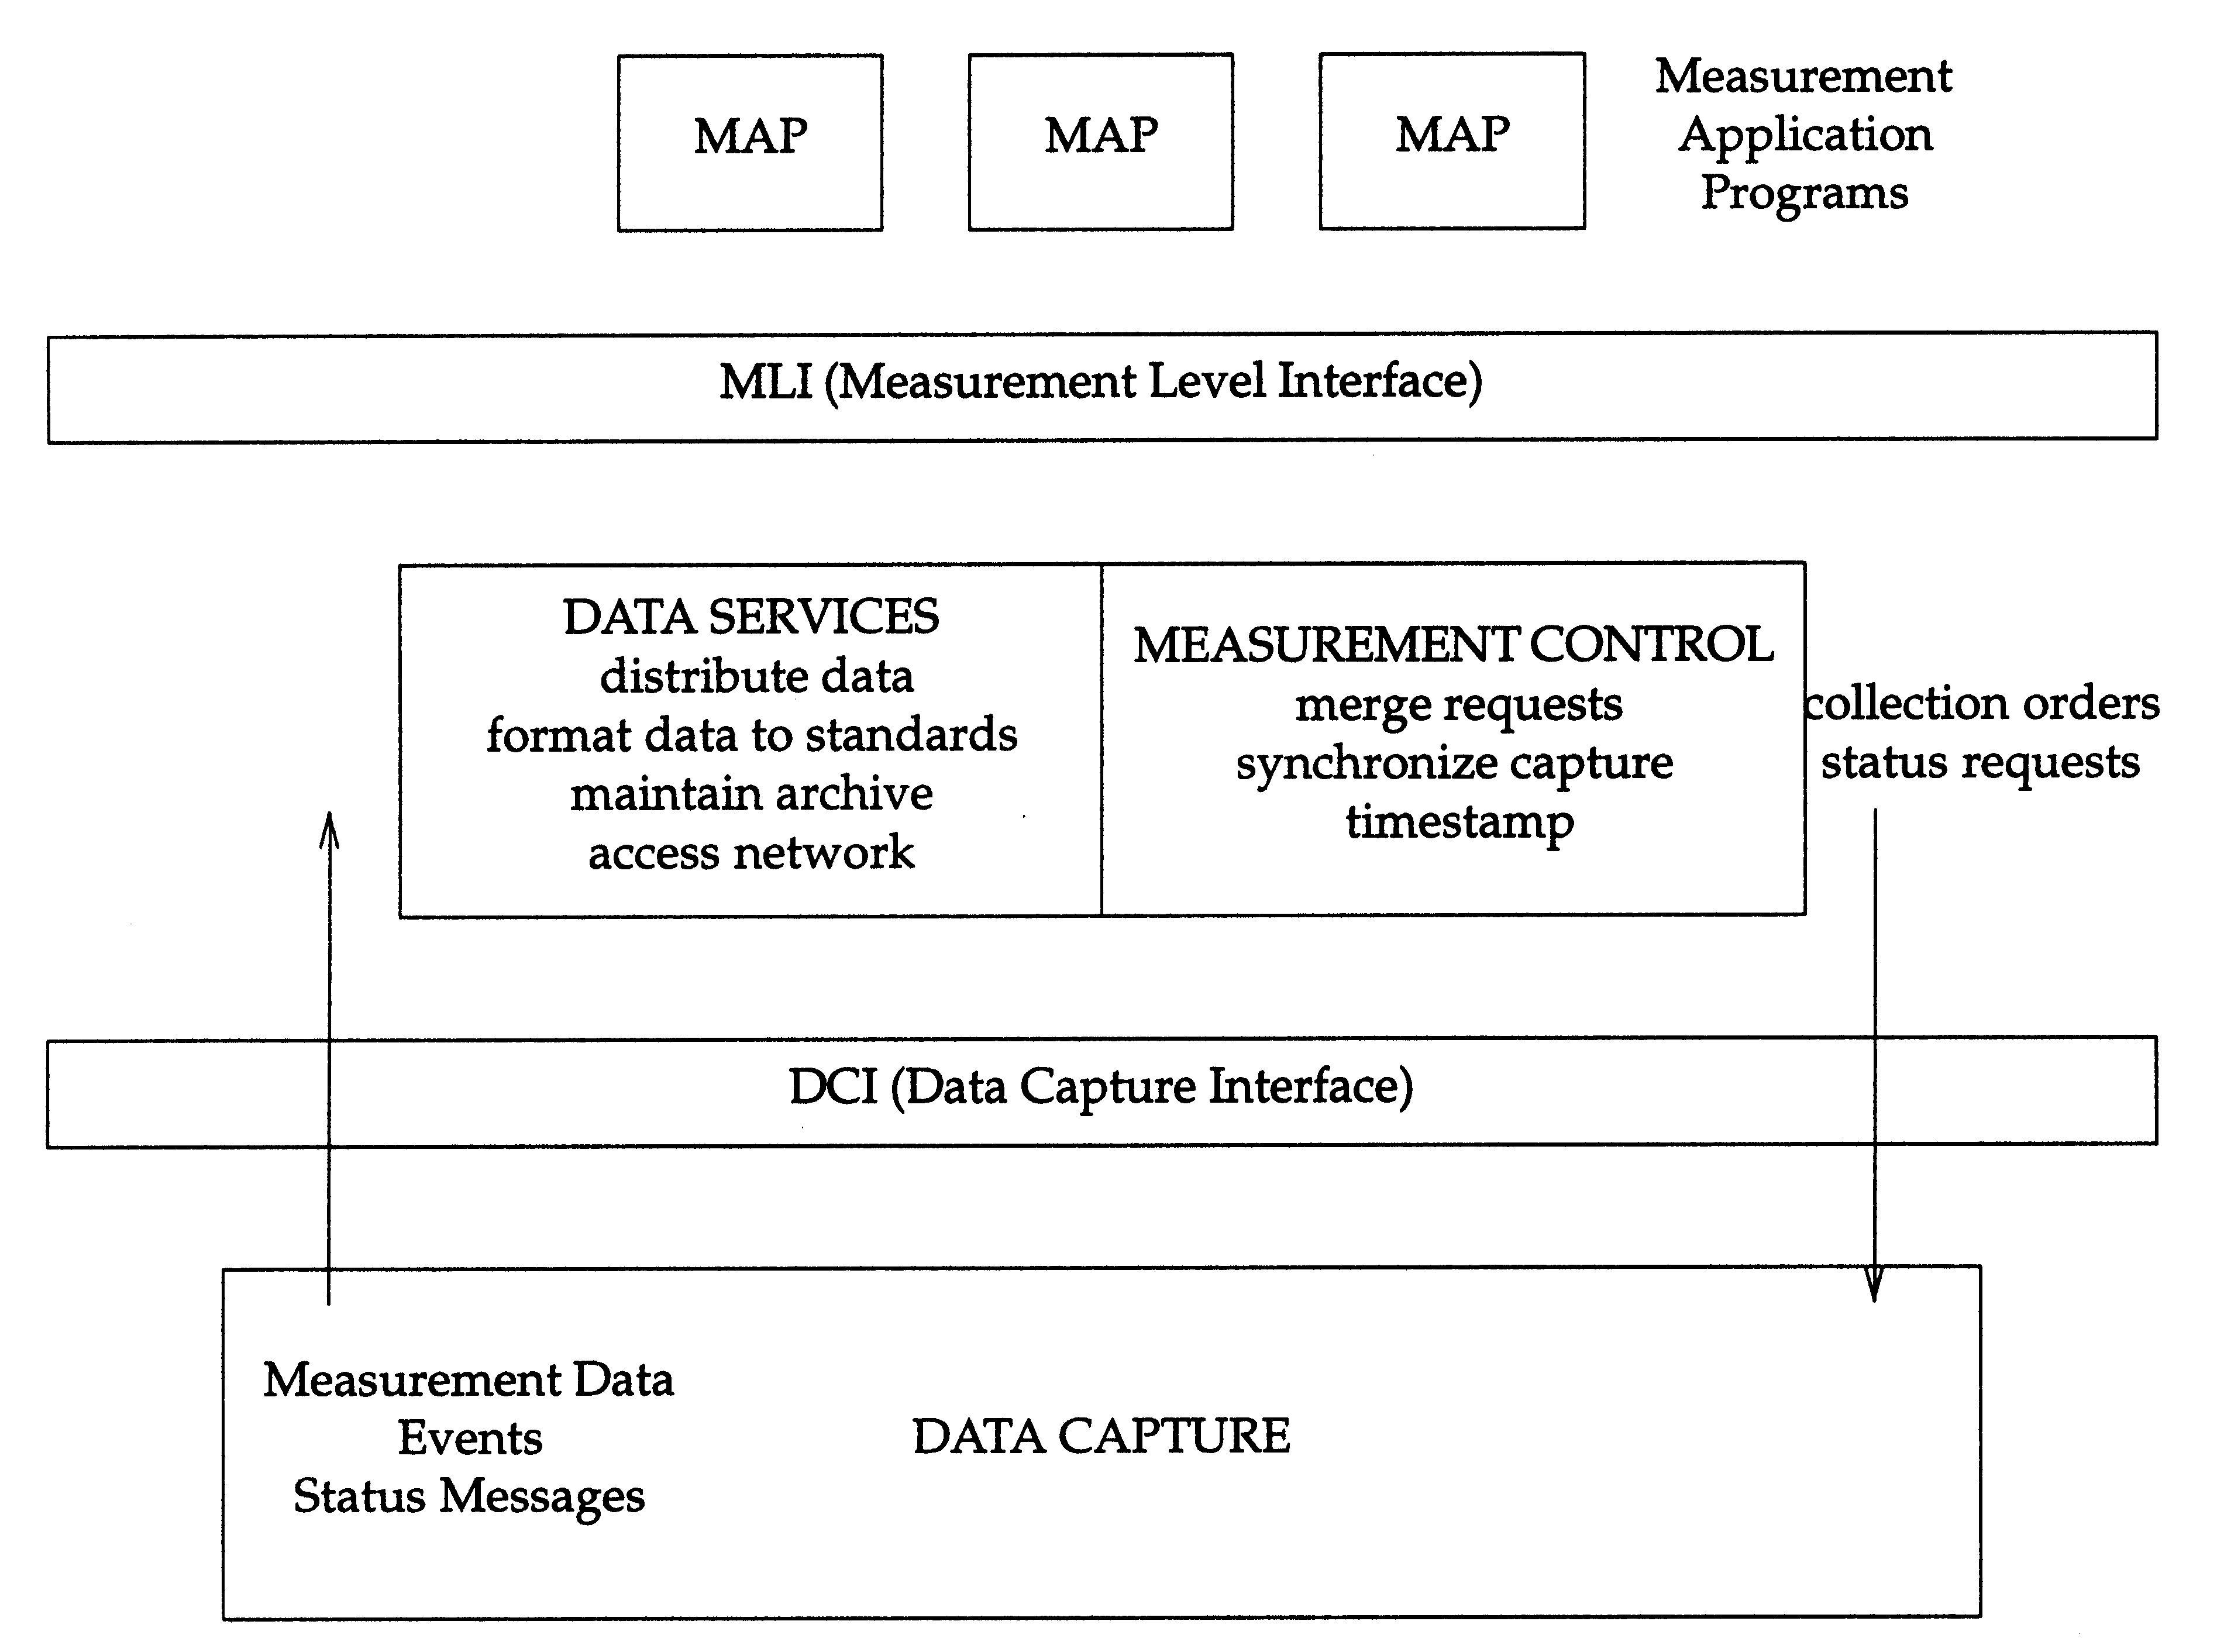
The Layers and Interfaces for the UMA
depicts the basic architecture.
The following is a very simplistic overview of the process
under discussion.
The MAPs request a class/subclass of metrics through
the Measurement Level Interface (MLI) to the data
services/measurement control layer.
Measurement control merges the requests,
synchronizes the capture,
provides headers and timestamps
and requests the current raw counter data through the
Data Capture Interface (DCI).
Once it has the data, measurement control/data services
can difference interval data,
transform the machine dependent data to a standard form and
provide other services.
The Data Capture Layer is basically responsible for gathering
the counter data from the kernel, subsystem or application and
passing it through the DCI.
The DCI document explains the different
approaches for gathering the data and the necessary programming
interfaces for the kernel, subsystems and applications to provide
the data.
To address the problem of generating too much data at the per
process/thread level,
a MAP can request granularity levels higher than a process.
This higher granularity is based on the user, session, transaction,
fair share group, etc, identifiers in the UMAWorkInfo structure.
Messages/records would only be cut for the level(s) of granularity requested,
with the lowest levels requested only during emergencies or testing.
Another control on the volume of data produced is the selection
of event or interval data. Event data may be fine for rudimentary
accounting (that is, end of process, job, session, login) whereas
interval data would provide near real-time knowledge of long
or never ending processes for accounting, resource management,
problem resolution, etc.

Figure: The Layers and Interfaces for the UMA
-
-
From Raw Data to Statistics
Most of the end metrics in the data pool are interval data which
are easily calculated by taking two samples of the raw counters
(usually from the kernel, which have been incremented since the last boot)
and taking the difference (while watching for overflow conditions).
This sampling and differencing according to the UMA is
done at the data services layer and not inside the kernel.
These interval values then could be used by the MAPs
to calculate metrics such as rates (for example, blocks/sec), service times
(for example, sec/block) and utilization (for example, 50% busy)
for the interval.
The MAPs could also take a set of these interval
samples for a given period (for example, 1st, 2nd and 3rd shifts, peak hours
during prime shift, a benchmark run) and produce statistics
about the distribution of the values such as the following:
mean, maximum, variance, standard deviation, 95th percentile, and
distribution histograms.
Such statistics can provide valuable information about the distribution
of a set of data.
But, except for the mean, these statistics based on interval values are
incorrect and misleading unless the underlying raw counters are
"well behaved" so that the distribution of the interval values
reflect the distribution of the raw data.
Variable Metrics and Sum of Squares
As indicated above, when a kernel counter can change by widely
different values during an interval (for example, one logical
read could request a
gigabyte while the next might be for a single byte), the statistics based
on a set of interval values based on this counter will almost always
be false.
But, since information about the distribution is needed to understand a
variable metric, it will be necessary for metric providers (the
kernel in the case of logical read requests) to provide additional
counters to support distributional statistics.
The simplest such addition is to add a counter that accumulates a
"sum of squares" of the changes to the primary counter.
This can be done with very small overhead to the provider of a multiply,
an add, and some memory references.
For the logical read request example, the kernel will already have two
counters, the number of requests and the sum of number of bytes per
request; the additional counter would be the sum of the square of the
number of bytes per request.
The addition of such counters will allow the true calculation of
variance and standard deviation for a metric like the number of bytes
per request.
So far the sum of squares counter is the only one included in the
UMA data pool.
The inclusion of additional counters to support other distributional
statistics is still an open issue.
In the following sections that describe metrics in UMA subclasses,
sum of squares metrics have been defined for certain metrics
that are based on counters
that can change by a variable amount during
an interval.
They are are listed in the optional data segment for a message subclass
in which they occur.
Statistics Across Multiple Intervals
To calculate the mean over multiple intervals, two counters must be
incremented by the kernel. One is the count of occurrences of the value being
measured and the other is the sum of the values.
For example, if read statistics are required,
one counter is the number of reads during the interval; the second counter is
the sum of the number of bytes read with each read during the interval.
For a single interval, the mean is
the sum of the number of bytes read divided by the number of reads for that
interval. The maximum of a metric over multiple intervals is easily
calculated as the maximum of the set of maximums for each interval.
The mean for multiple intervals, however, cannot be computed as
the mean of the set of means for each interval. It is calculated as the
total over multiple intervals of the sum of the number of bytes read with each
read divided by the total over multiple intervals of the number of reads.
To compute the variance and standard deviation over a single interval as well
as multiple intervals, a third counter, which is the sum of the squares of the
value, must be incremented by the kernel.
Using the example of read statistics, this counter is the sum of squares of
the number of bytes read with each read during the interval.
The variance then is calculated as the mean of the sum of squares
minus the square of the mean, that is, the sum of squares of the number of
bytes read divided by the number of reads minus the square of the sum of the
number of bytes read divided by the number of reads.
As in the case above for the mean, the variance over multiple intervals
requires all three counters described above,
each summed over the multiple intervals.
Kernel Level Sampling versus Data Services Level
Some sampling data can be broken down into basic kernel counters
and gathered as interval data.
Two such metrics are the average run-queue length and
occupancy.
At every clock tick, a sample count is incremented,
the number of runnable but unloaded processes added to
a running counter,
and a count incremented for the samples when the runnable
but unloaded process count was not zero.
The average run-queue length is the sampled sum of runnable but unloaded
processes divided by the non-zero sample count.
The run-queue occupancy is the non-zero sample count divided by
the sample count.
This kernel-level sampling technique should only be used when
the overhead is justified by the frequency of change of the metric
and the metric importance.
Some sampling data should not be collected by the kernel.
One example is the current number of logins in a fair share group,
on a system or on a particular front-end-processor.
Here the sample data that does not change frequently enough
to justify kernel level tracking.
Several metrics have been proposed
which request the peak values for a given interval.
If the kernel kept this value, it could only keep one measure
and would need to reset the value at the beginning of the interval
(the smallest of several intervals requested).
(Note that peak value since last boot would not be useful.)
Instead an adequate number of samples (30 minimally) of
instantaneous values should be collected (possibly at the end of
the interval) for the period in question
(for example, a shift, test period, peak period).
Then the 95th percentile or maximum of these samples
could be determined by the MAP for that period.
Resource versus Workload Analysis
It is likely that in the future there will be a shift of focus
from system oriented resource analysis to an end-user oriented
workload analysis.
The typical analysis focuses on the
resources (CPU, memory, disk, networks, etc.) being consumed
but nothing about the applications consuming them.
These resources can be tuned against some rules of thumb but one
will never know what positive or negative impact this has on the
end-user transaction response time.
A more effective approach would be to monitor for worsening
application transaction response and then tune the resources
that are causing the problem.
This requires collection of the transaction response time components
(that is, delays at the CPU, disks, memory, networks, etc.).
The importance of end-user workload analysis
has and will continue to have a profound
influence on the selection of metrics and the formation of
classes and subclasses.
Note that some classes center around key system resources
(for example, processor, memory, disks, streams, IPC, networks).
The global or device subclasses attempt to tell whether a
particular resource may be in trouble.
The per process subclasses attempt to tell what resources may be
causing an application trouble.
In many cases, the connection from the process to the resource
passes through several buffers where direct tracking
for the individual process is lost.
For example, one cannot track the I/O for a process through
a memory buffer cache to a disk or through streams to other I/O devices.
Where this connection is lost,
one must rely on some statistical correlation
between the individual process response and the global resource response.
To form this correlation,
the per process data must be collected on the same interval as
the global resource data.
Although this is a pragmatic answer, one should demand
(long term) real measurements even if they are hard to develop.
Tracing response to resource is necessary for true capacity planning.
The end goal is a transaction model at the application level.
Why not acquire a nicely bound hard copy?
Click here to return to the publication details or order a copy
of this publication.

