Preface
The Open Group
The Open Group is a global consortium that enables the achievement of business objectives through technology standards. With more than 870 member organizations, we have a diverse membership that spans all sectors of the technology community – customers, systems and solutions suppliers, tool vendors, integrators and consultants, as well as academics and researchers.
The mission of The Open Group is to drive the creation of Boundaryless Information Flow™ achieved by:
- Working with customers to capture, understand, and address current and emerging requirements, establish policies, and share best practices
- Working with suppliers, consortia, and standards bodies to develop consensus and facilitate interoperability, to evolve and integrate specifications and open source technologies
- Offering a comprehensive set of services to enhance the operational efficiency of consortia
- Developing and operating the industry’s premier certification service and encouraging procurement of certified products
Further information on The Open Group is available at www.opengroup.org.
The Open Group publishes a wide range of technical documentation, most of which is focused on development of Standards and Guides, but which also includes white papers, technical studies, certification and testing documentation, and business titles. Full details and a catalog are available at www.opengroup.org/library.
The TOGAF® Standard, a Standard of The Open Group
The TOGAF Standard is a proven enterprise methodology and framework used by the world’s leading organizations to improve business efficiency.
This Document
This document is a TOGAF® Series Guide to Organization Mapping. It has been developed and approved by The Open Group.
More information is available, along with a number of tools, guides, and other resources, at www.opengroup.org/architecture.
About the TOGAF® Series Guides
The TOGAF® Series Guides contain guidance on how to use the TOGAF Standard and how to adapt it to fulfill specific needs.
The TOGAF® Series Guides are expected to be the most rapidly developing part of the TOGAF Standard and are positioned as the guidance part of the standard. While the TOGAF Fundamental Content is expected to be long-lived and stable, guidance on the use of the TOGAF Standard can be industry, architectural style, purpose, and problem-specific. For example, the stakeholders, concerns, views, and supporting models required to support the transformation of an extended enterprise may be significantly different than those used to support the transition of an in-house IT environment to the cloud; both will use the Architecture Development Method (ADM), start with an Architecture Vision, and develop a Target Architecture on the way to an Implementation and Migration Plan. The TOGAF Fundamental Content remains the essential scaffolding across industry, domain, and style.
Trademarks
ArchiMate, DirecNet, Making Standards Work, Open O logo, Open O and Check Certification logo, Platform 3.0, The Open Group, TOGAF, UNIX, UNIXWARE, and the Open Brand X logo are registered trademarks and Boundaryless Information Flow, Build with Integrity Buy with Confidence, Commercial Aviation Reference Architecture, Dependability Through Assuredness, Digital Practitioner Body of Knowledge, DPBoK, EMMM, FACE, the FACE logo, FHIM Profile Builder, the FHIM logo, FPB, Future Airborne Capability Environment, IT4IT, the IT4IT logo, O-AA, O-DEF, O-HERA, O-PAS, Open Agile Architecture, Open FAIR, Open Footprint, Open Process Automation, Open Subsurface Data Universe, Open Trusted Technology Provider, OSDU, Sensor Integration Simplified, SOSA, and the SOSA logo are trademarks of The Open Group.
A Guide to the Business Architecture Body of Knowledge, BIZBOK, Business Architecture Guild, CBA, and Certified Business Architect are registered trademarks of the Business Architecture Guild.
All other brands, company, and product names are used for identification purposes only and may be trademarks that are the sole property of their respective owners.
About the Authors
(Please note affiliations were current at the time of approval.)
Steve DuPont – Associate Technical Fellow, Boeing
Steve has been contributing to The Open Group standards since 2009 and is a Certified Business Architect® (CBA®). He is an Associate Technical Fellow and Senior Enterprise Architect with the Boeing Company providing Enterprise Architecture leadership to strategic aerospace initiatives such as new commercial airplane programs, global business development initiatives, and mergers and acquisitions.
J. Bryan Lail – Business Architect Fellow, Raytheon
J. Bryan Lail is a Business Architect Fellow at Raytheon. He is a Certified Business Architect® (CBA®) with the Business Architecture Guild®, a Master Certified Architect with The Open Group, and a Raytheon Certified Architect applying strategic business architecture methods in the defense industry. His career has spanned physics research, engineering for the Navy and Raytheon, and multiple publications in the application of architecture to business strategy.
Stephen Marshall – Strategy Consultant, IBM
Stephen Marshall is a Certified Business Architect® (CBA®) with the Business Architecture Guild®, a Master Certified Architect with The Open Group, and a Senior Management Consultant with the IBM Institute for Business Value (IBV). He currently leads the IBV Global C-suite Study program in Asia-Pacific, co-authoring several pieces of thought leadership.
Acknowledgements
The Open Group gratefully acknowledges the authors of this document:
- Steve Dupont
- J. Bryan Lail
- Stephen Marshall
The Open Group gratefully acknowledges members of The Open Group Architecture Forum past and present for their contribution in the development of this document, including the following key enablers:
- Sonia Gonzalez
- Mike Lambert
Referenced Documents
The following documents are referenced in this TOGAF® Series Guide.
- A Guide to the Business Architecture Body of Knowledge® (BIZBOK® Guide), Version 8.0, Part 1: Introduction, published by the Business Architecture Guild®, August 2018; refer to: https://www.businessarchitectureguild.org/page/002
- Organigraphs: Drawing How Companies Really Work, by Henry Mintzberg and Ludo Van der Heyden, September-October 1999, published by the Harvard Business Review; refer to: www.hbr.org/1999/09/organigraphs-drawing-how-companies-really-work
- The TOGAF® Standard, 10th Edition, a standard of The Open Group (C220), published by The Open Group, April 2022; refer to: www.opengroup.org/library/c220
- TOGAF® Series Guide: Business Capabilities, Version 2 (G211), published by The Open Group, April 2022; refer to: www.opengroup.org/library/g211
- TOGAF® Series Guide: Business Models (G18A), published by The Open Group, April 2022; refer to: www.opengroup.org/library/g18a
- TOGAF® Series Guide: Business Scenarios (G176), published by The Open Group, April 2022; refer to: www.opengroup.org/library/g176
- TOGAF® Series Guide: Information Mapping (G190), published by The Open Group, April 2022; refer to: www.opengroup.org/library/g190
- TOGAF® Series Guide: Value Streams (G178), published by The Open Group, April 2022; refer to: www.opengroup.org/library/g178
The organization map is a key element of Business Architecture because it provides the organizational context for the whole Enterprise Architecture effort. While capability mapping exposes what a business does and value stream mapping exposes how it delivers value to specific stakeholders, the organization map identifies the business units or third parties that possess or use those capabilities, and which participate in the value streams.
As one of the four core elements of Business Architecture,[1] the organization map provides a key perspective: the organizational context for Enterprise Architecture. For example, it provides visibility of what organization units are relevant for a particular architecture design or solution. These key insights mean that the organization map becomes foundational for Enterprise Architecture and the deployment of strategy.
Taken together with the methods outlined in Phase B of the TOGAF® framework as well as the associated Business Architecture-focused Guides,[2] the organization map provides an understanding of which organizational units to involve in the architecture effort, who with and when to talk about a given requirement, and how to measure the impact of various decisions.
An organization map is a Business Architecture blueprint that shows:
- The main organizational units, partners, and stakeholder groups that comprise the ecosystem of an enterprise.
- The working relationships (informal as well as formal) between each of those entities.
These two primary characteristics also reflect what distinguishes organization maps from traditional organization charts, which are more likely to portray the reporting lines that exist between named individuals who are in charge of each department (refer to Chapter 3 for a more detailed explanation). Instead of describing the business in terms of a top-down hierarchy that is focused on people and titles, an organization map depicts it in more fluid terms – as a network of relationships and interactions between business entities that may extend beyond the legal boundaries of the enterprise.
The lack of fluidity with organization charts, along with the broadening of what constitutes an enterprise in today’s business world, are what led to the creation of the concept of organization mapping by Mintzberg and Van der Heyden (see Referenced Documents). They saw the organization chart as increasingly irrelevant to understanding a business, and for strategy and planning. Instead, they proposed the web concept (something that is not too dissimilar to how social networks function) as being more suited to describing how organizations actually operate across formal boundaries and siloes.
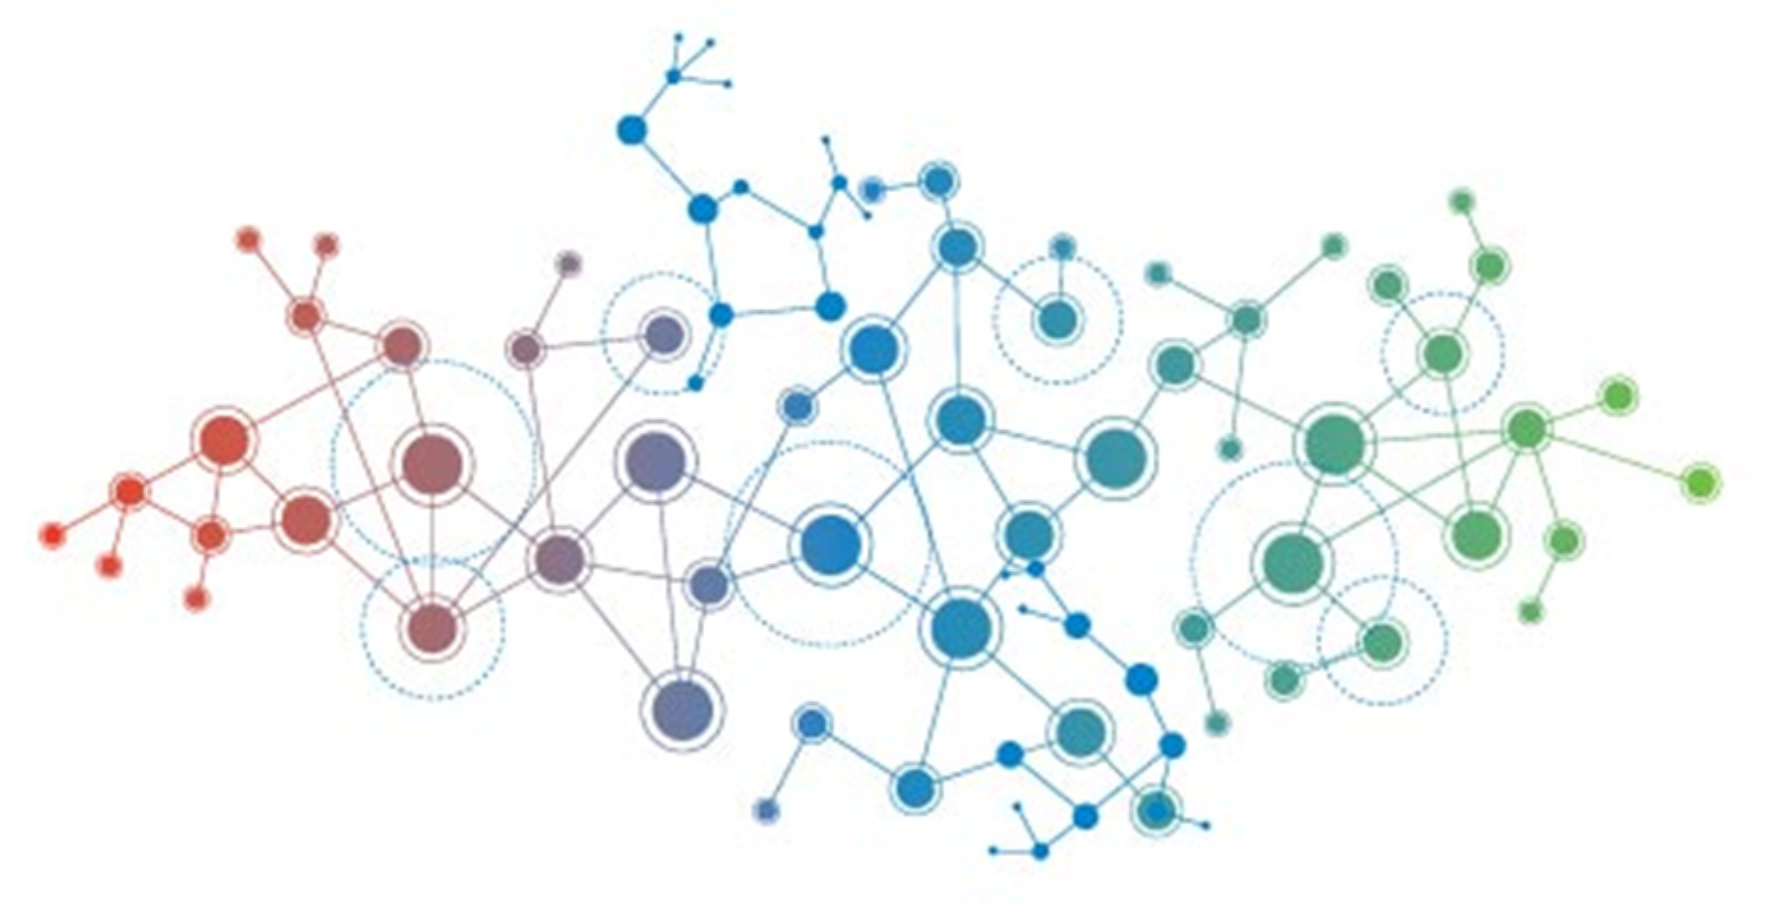
Figure 1: Web-Styled Organigraph
The notion that an organization is something that is unconstrained by corporate or legal boundaries may require redefining the organization concept as being “a social unit of people that is structured and managed to meet a need or to pursue collective goals.”.[3] By not constraining organizational boundaries, it follows that organization mapping is similarly unconstrained. That is, the organization map covers the entire enterprise including the broader ecosystem of suppliers, partners, and stakeholders. If there is a formal working relationship, it can even extend to customers. The organization map therefore provides greater visibility of the enterprise as a whole, rather than just the formal, legal business entity.
Each node in an organization map represents an organization unit. An organization unit can be a business unit or service line, a functional area or department that operates within the business unit, a third-party partner or supplier, or a less formally recognized group such as a collaborative team. Collaborative teams are typically cross-functional and have a relatively temporary lifespan – much shorter than a business unit or department that is shown on the organization chart. Table 1 shows the various types and levels of organization units that may be shown in an organization map.
Table 1: Organization Unit Types and Levels
|
Organization Level |
Organization Unit |
Organization Type |
Description |
|
0 |
<name> |
Enterprise |
Name of overarching entity (the scope of the map) |
|
1 |
<name> |
Line of business |
Major lines of reporting within the enterprise |
|
2 |
<name> |
Function |
A functional area such as Marketing or Finance |
|
2 |
<name> |
Partner |
External partners with key relationships inside the enterprise |
|
3 |
<name> |
Collaborative team |
A program or team created by and operating across two or more organizational units |
To the uninitiated, organization maps can appear to be similar to organization charts. Both can have similar structural elements, and both can be represented by artifacts that use similar representations (such as a node relationships diagram). However, there are significant differences between organization maps and organization charts.
Traditional hierarchical models of a business (an example of which is shown in Figure 2) focus on formal, top-down reporting structures rather than how the business actually operates. In doing so, they fail to depict the many horizontal, peer-to-peer, or many-to-many relationships that enable the business to function on a day-to-day basis through project teams and working groups that form across different business units and often include external parties.
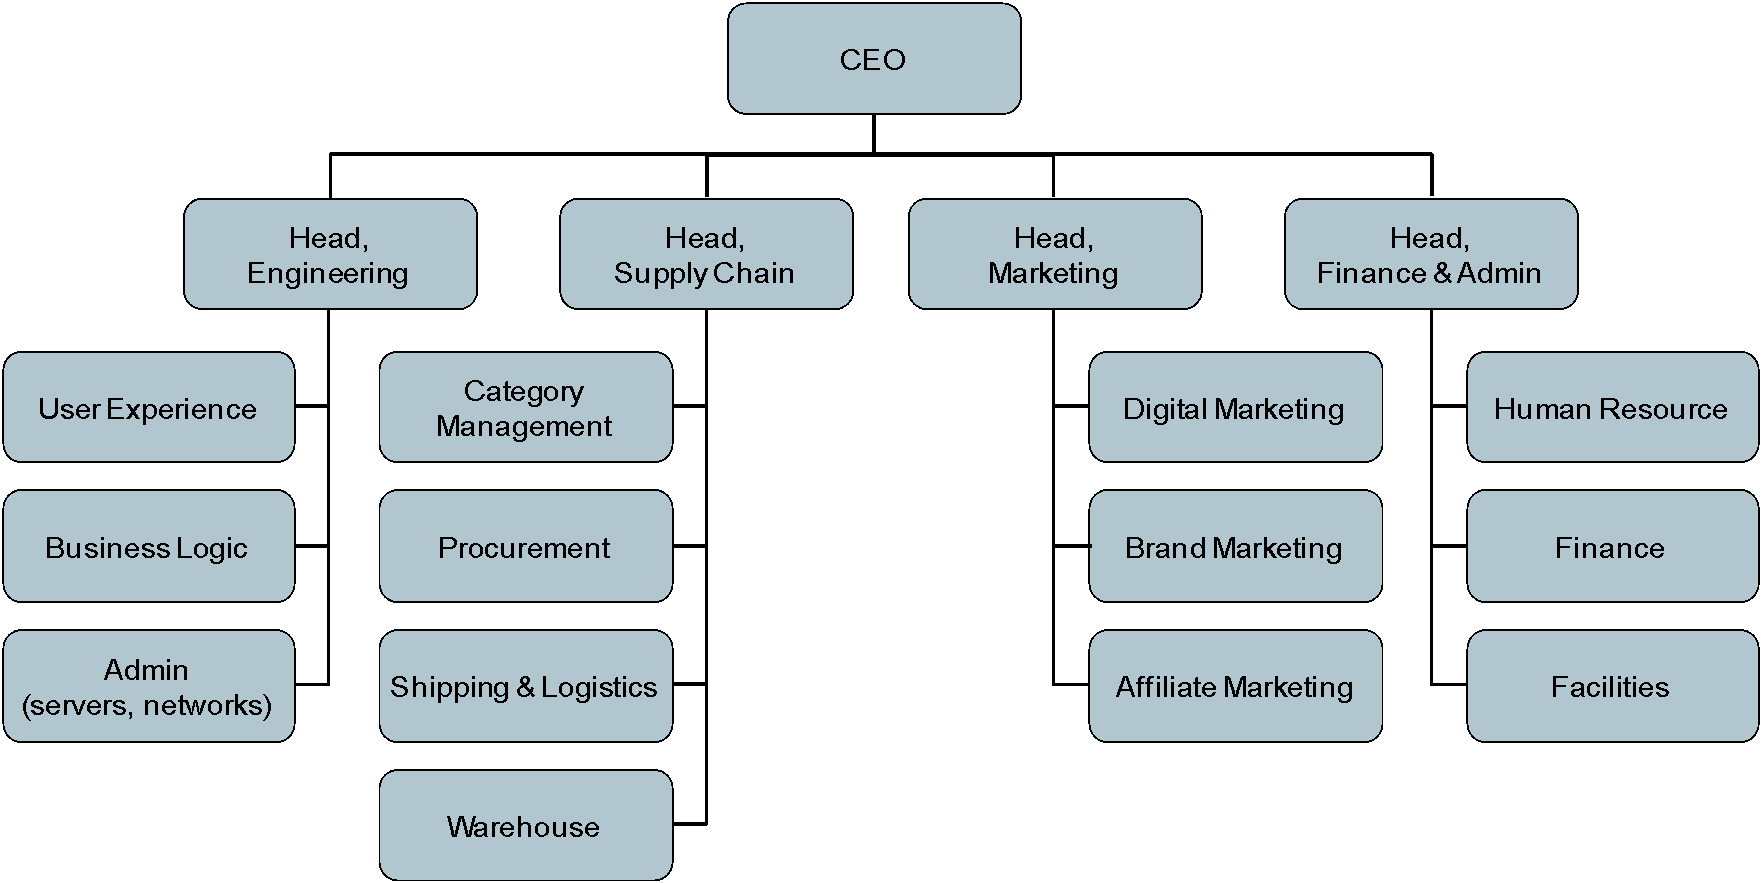
Figure 2: Standard Organization Chart
Organization maps, as shown in Figure 3, go much further by depicting internal and external relationships as well as the collaborations from across the enterprise and beyond to include its ecosystem of business partners and stakeholders. The central oval (the enterprise) should be interpreted as denoting the total scope to be represented in the map, not just as the name of the legal entity. Also note that all of these entities are organization units, while the term business unit is being used to denote the next level below the enterprise (in this case representing business functions).
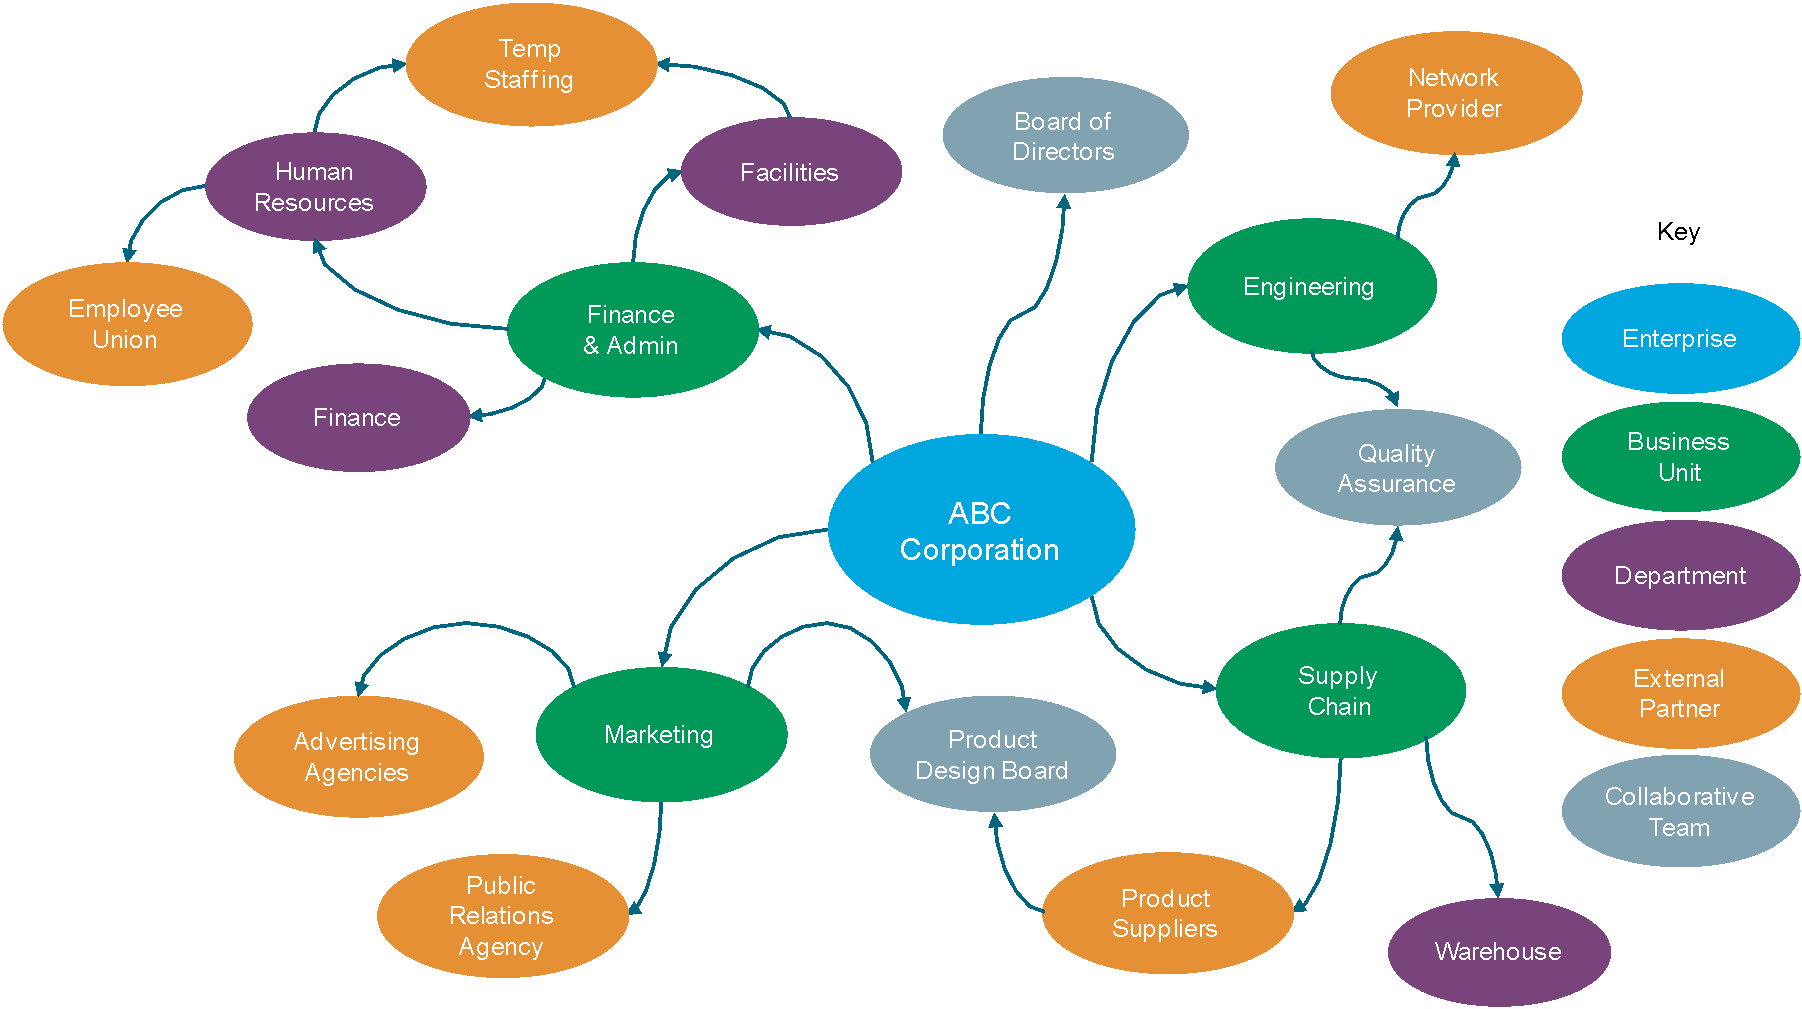
Figure 3: Generic Organization Map
Organization maps and organization charts also differ in terms of their underlying purpose. Typically, organization charts are tools used by senior management and Human Resources (HR) to depict the formal structure of an organization, including the reporting relationships and relative ranks of its parts and positions/jobs. In contrast, an organization map is used by analysts, planners, and architects to depict a richer model of the organization – to communicate both internal and external relationships and collaborations from an organizational unit or business entity perspective.
In summary, the key differences between organization maps and organization charts are as follows:
- Scope
Organization charts are internally focused and used to communicate basic structures and reporting relationships of the business to its stakeholders. Organization maps are whole-system-oriented in order to accurately represent all the relationships, internal and external, between each of the key participants in the business model of the enterprise.
- Complexity
Conventional organization charts reveal little about the complex interactions and relationships that exist within an organization. Organization maps more accurately describe cooperative and collaborative relationships among business units and external parties. This richer description of critical relationships provides a better tool for understanding how changes in business conditions or business model dynamics may affect the overall operation and the ability of the organization to deliver.
- Explicitness
Organization charts are typically limited to explicit and formal relationships between named individuals who are responsible for running each business unit. In contrast, organization maps include implicit relationships that are critical to the business; e.g., participants in a proposed business model change that will influence a value exchange.
- Lifecycle
Organization charts and organization maps have different lifecycles and degrees of fluidity. For example, a change to a business model could affect the organization map yet not impact the organization chart, which is more internally focused and relatively stable.
The benefits of organization mapping include:
- Improves understanding of the organization
Conventional organization charts reveal little about the interactions and relationships of an organization. For example, an organization chart, with its typical internal focus, doesn’t lend itself to describing cooperative or collaborative relationships among business units and external parties. By relying on simple organization charts, the lack of organizational knowledge can sub-optimize an organization’s understanding of which business units may be impacted by changes in business conditions and how they may be impacted. Planners typically have to rely on their collective wisdom to fill in the gaps of missing knowledge about the organization. The organization map provides transparency of the organization necessary to identify and appropriately engage impacted business units.
- Improves strategic planning
The organization map is an essential part of a holistic and integrated approach to strategic planning and investment analysis. Business units historically often plan in isolation and miss opportunities to understand how the change initiatives they sponsor affect other organizations and vice versa. This results in initiatives that are often sub-optimized or even fail due to the lack of cross-organizational planning, coordination, and funding. Organization mapping provides a means for the organization to identify and engage all business units impacted by strategic change early on. This greatly improves strategic planning and investment analysis for the organization.
- Provides organizational context for deployment
The organization map provides the foundation for describing the applicability of business capabilities, architecture designs, and solutions to impacted business units. This is especially critical for large organizations that aim to maximize asset reuse across numerous diverse business units. The organization map helps to answer questions like: What business units do a particular requirement, architecture design, or solution apply to? What business units are impacted for a given requirement, architecture design, or solution? How should business capabilities be deployed across multiple business units?
- Improves communication and collaboration
As a core element of Business Architecture, the organization map plays a key part in providing the transparency required for effective communication and collaboration. One of the main objectives of the organization map is to identify what organizations are impacted by a particular planning activity or change initiative. This information is a key input into the communication plan and stakeholder analysis. Another objective is to identify which organizations need to collaborate to realize the goals and objectives of the initiative.
- Improves the effectiveness of organizational change management
By providing transparency into the business units affected by the proposed change, the organization map helps prepare and support impacted business units and individuals to successfully adopt change. Combined with more detailed artifacts such as the business interaction matrix, role catalog, and the actor/role matrix, the organization map is a key input to identifying organizational change management impacts, defining job functions, and executing training.
The first step is to set out a tabular description of elements that are often related to organizational elements such as the organization unit. As shown in Table 2, the organization map starts with a central construct that names the scope of the enterprise to be mapped. In the second row, organization units (or lines of business or divisions) are the elements that directly make up that enterprise. The next step is often to describe business capabilities, to outline which organization units have which business capabilities (with a many-to-many mapping); a powerful construct that can help understand many issues around authority, investments, information flow, and change management.
Independent of mapping to business capabilities, however, organization units can also have relationships to location or other attributes that make meaningful distinctions between the units but are not themselves an organizational element. In the fifth row, value flows are shown and labeled between organization units in tangible or intangible forms. Here, key information types can be shown flowing between organization units. Examples for some of these are shown in Chapter 7. Note that it is expected that some of these relationships will be built based on the needs of the architecture effort, but rarely all of them. Finally, a table of this form can provide an understanding of possible relationships between artifacts in the architectural knowledge base, including whether those relationships are direct, or derived through the use of other artifacts.
Table 2: Organization Map Relationships to Other Domains
|
Element |
Type |
Relation |
Purpose |
Examples |
|
Scope of enterprise |
Organization |
Direct |
Basis of the organization map that sets the scope for boundaries |
Name of the business entity and extended team including customers and strategic partners |
|
Organization unit |
Organization |
Direct |
The enterprise decomposes into organization units |
Marketing, Finance, Supply Chain, HR |
|
Business capability |
Capability |
Direct |
Organization units have one or more business capabilities |
Market Management, Financial Management, Supplier Management |
|
Location |
Geographical |
Direct |
Organization units have one or more locations |
Global versus regional locations |
|
Value flow |
Value |
Derived |
Characterized through labeled lines between organization units, naming the value that flows from one to the other |
Product Delivery, Payment Approval, Personalized Service |
|
Information flow |
Information |
Derived |
Characterized through labeled lines between organization units, naming the information that flows from one to the other |
Product Attributes, Payment Terms, Agreement |
To the Business Architect focused solely on blueprints for the business, an organization map can be a pure business construct articulating the relationships between the primary entities that make up the enterprise, its partners, and stakeholders. To the Enterprise Architect, for whom Business Architecture is a phase to fully characterize business needs and concerns to then be addressed by technologies, an organization map is a means to an end of identifying stakeholders for solutions resulting from the architecture phases.
With the definition of a stakeholder as an individual, team, organization, or class thereof, having an interest in a system, the TOGAF framework focuses on the organizational understanding needed to drive the focus and scope of Enterprise Architecture,[4] as well as identifying stakeholders key to the acceptance and use of technology solutions. The organization map of the Business Architect also relates to TOGAF operating issues such as business actors, roles, or processes, in the context of using technology solutions.
The TOGAF framework supports the use of organization maps in both contexts, with the introduction of the topic in Phase A and Phase B. In Phase A, the architect searches for and uses existing organization descriptions, even if only in the form of conventional organizational charts. In Phase B, the architect builds out the organization map with the detail and relationships to other views needed to ensure the business needs are understood. The metamodel also introduces the organization entity with relationships to other entities, using the term organizational unit. This entity has relationships to others such as delivering business capabilities, delivering products, and realizing business functions.
Applying this guide, the Enterprise Architect can draw a much richer relationship between organizational entities, business capabilities, and information concepts to shape the path for implementing systems, applications, data models, and infrastructure. This blueprint, such as the general examples in Chapter 5 or the applied examples in Chapter 7, guides how a business capability gap that might be partly addressed by a new or refreshed technology also relates to the organizational elements that may call out critical stakeholders, and the key information concepts that should be supported by the technology solution. Note the caveat “partly” addresses another key role for developing Business Architecture before designing solutions, that very few business problems can be addressed by technology alone. As in the associated TOGAF® Series Guides for Business Capabilities, Information Mapping, and Value Streams, (see Referenced Documents), an organization map that is well thought out and then linked to those other domains will help ensure that the real business problem is solved with the best combination of process changes, roles and responsibilities, data capture, and technologies enabling them through applications and infrastructure.
Continuing with the retail business examples that have been used throughout the Business Architecture TOGAF® Series Guides (see Referenced Documents), a typical organization map for a global retail corporation might look like that shown in Figure 4.
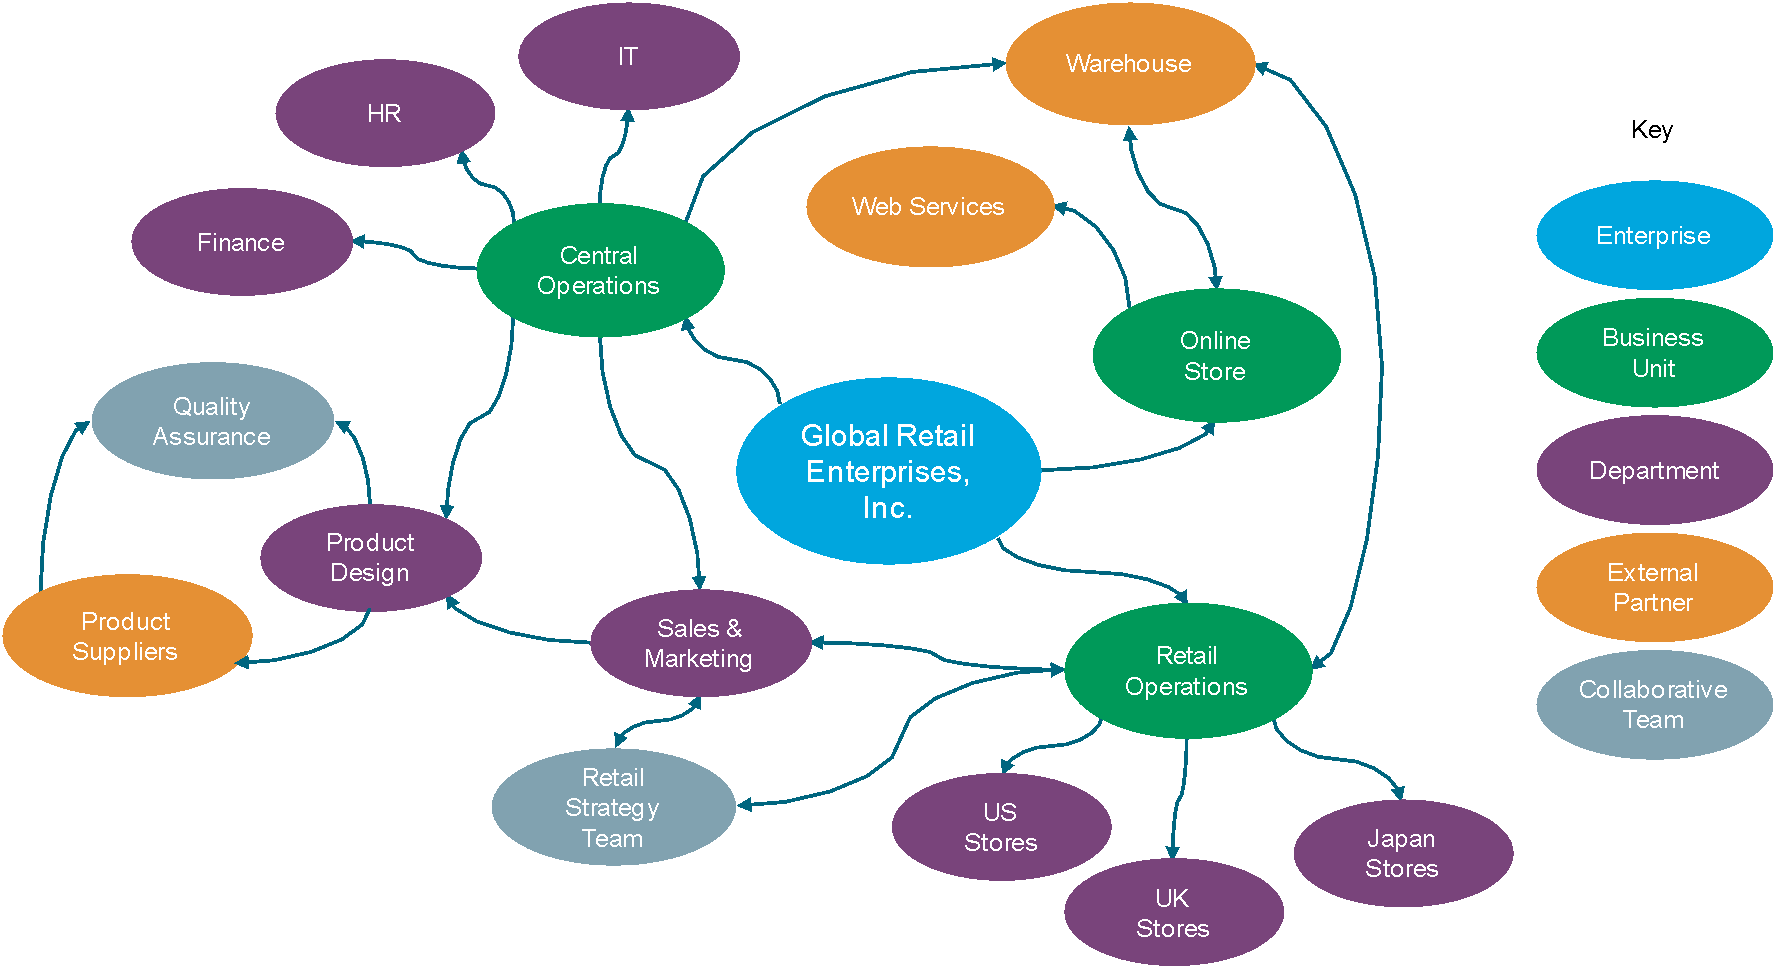
Figure 4: Retail Business Organization Map
As a reminder, the central oval (the enterprise) should be interpreted as denoting the total scope to be represented in the map, not just as the name of the legal entity. Also note that all of these entities are organization units, while the term business unit is being used to denote the next level below the enterprise (in this case representing lines or channels of business).
Not only is it immediately apparent how the business functions at an organizational as well as operational level, but the organization map can be extended to show the relationships between organization units and other Business Architecture domains such as business capabilities. Figure 5 shows an example of cross-mapping the Project Management of the IT organization unit and the Learning Management of Sales & Marketing. Note the ability to also apply heat mapping to each capability to provide a visual indication of performance, maturity, or some other relevant attribute.
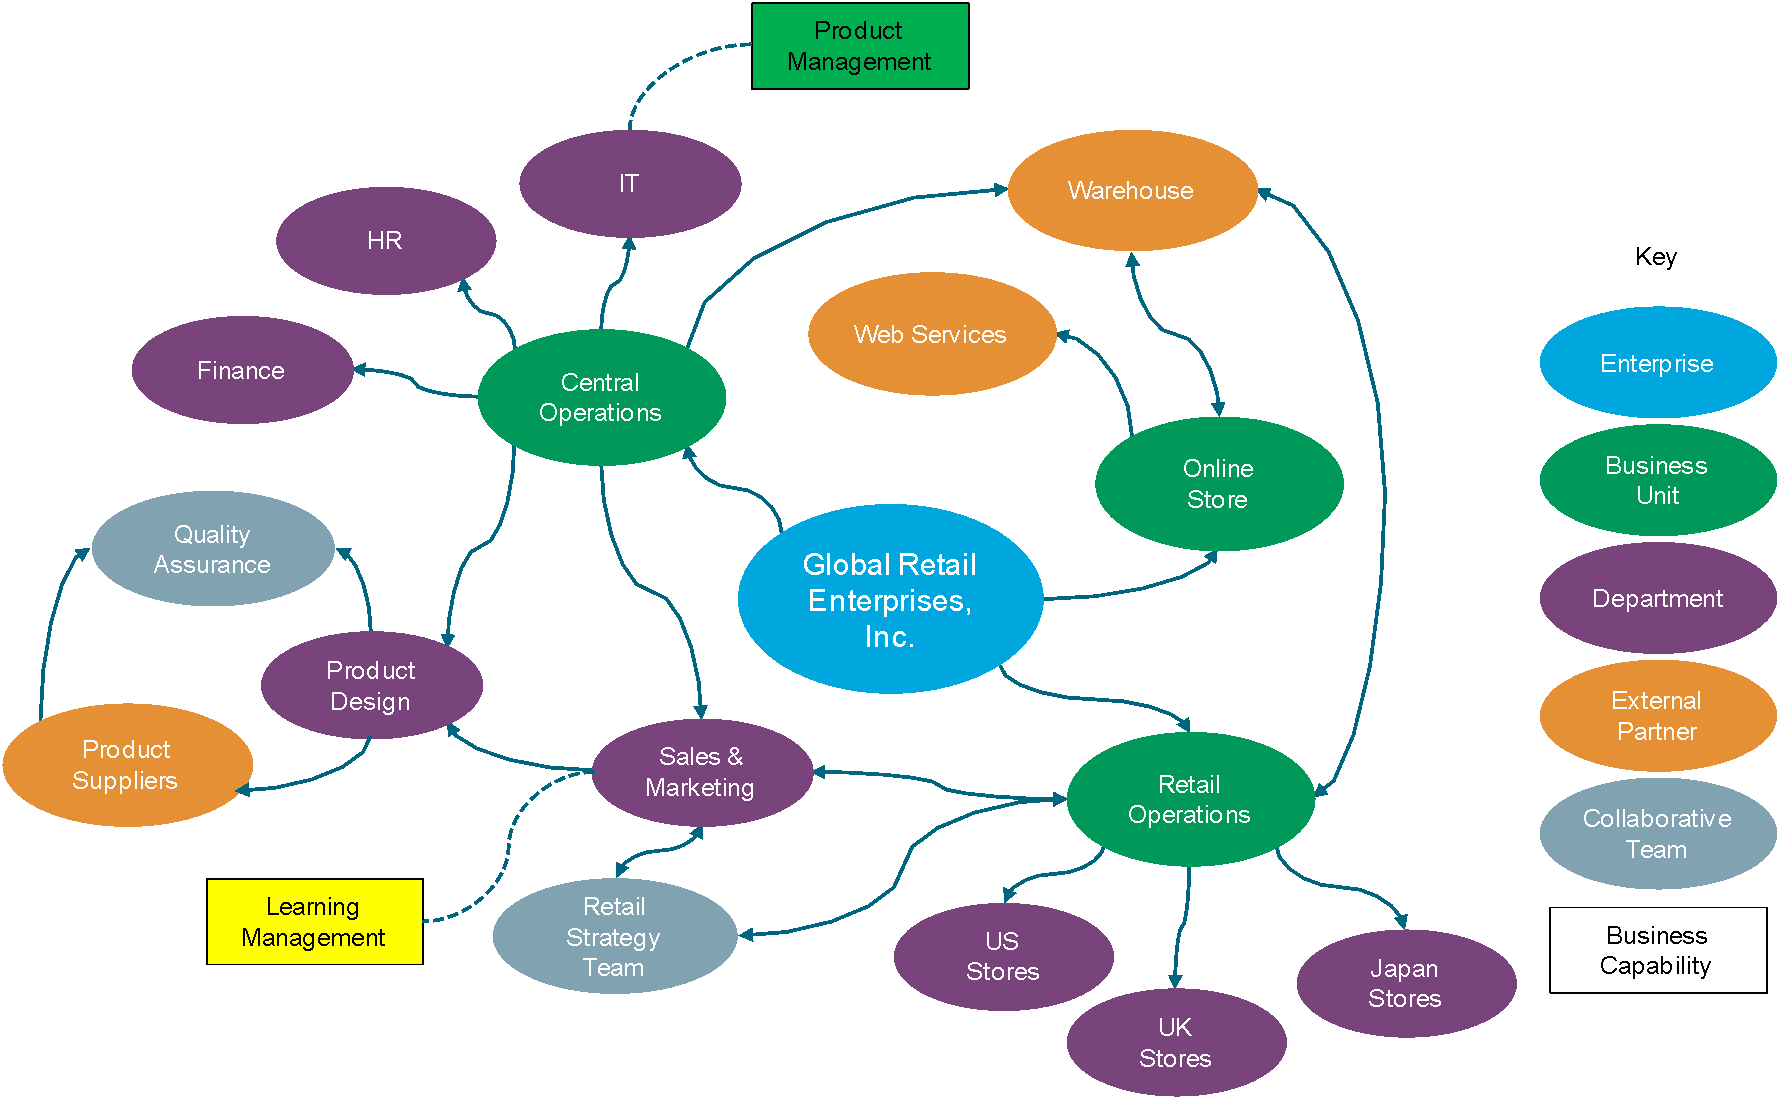
Figure 5: Organization Unit-to-Business Capability Cross-Mapping
An organization map is a Business Architecture blueprint that shows the key organizational units, partners, and stakeholder groups that comprise the ecosystem of an enterprise. The identification of organization units and relationships among them provides one of the four critical pillars of Business Architecture. The organization map identifies the business units or third parties that possess or use business capabilities, which participate in the value streams and have a relationship with business information concepts. These four pillars with identified maps within the scope of the Enterprise Architecture effort and appropriate relationships mapped across the pillars ensure that the scope and reach of the full Enterprise Architecture is understood in order to set the stage for later solutions across processes, roles, technologies (applications, infrastructure), and data models.
Footnotes
[1] A Guide to the Business Architecture Body of Knowledge® (BIZBOK®), Part 1: Introduction, Figure 1.1 (see Referenced Documents).
[2] The TOGAF® Series Guides to Business Capabilities, Business Models, Business Scenarios, Information Mapping, and Value Streams (see Referenced Documents).
[3] Definition of “Organization”, WebFinance Inc., www.businessdictionary.com/definition/organization.html.
[4] The TOGAF® Standard – ADM Techniques, Stakeholder Management (see Referenced Documents).