Previous section.
Universal Measurement Architecture Guide
Copyright © 1997 The Open Group
Introduction
Performance Measurement in Open Systems
The commercialisation of POSIX-based computing is continuing at a rapid pace,
adding
capabilities not just expected, but desperately needed by MIS shops and new commercial
users. One such feature is performance management. The users familiar with mainframe
data processing environments are used to having sophisticated tools available to determine
resource utilisation, predict system capacities and growth paths, and even to compare
CPU models for making purchase decisions.
Although the open system concept is creating a revolution in applications development
and system migration paths, certain capabilities (such as
performance management) have
not been standardised.
Currently there is generally insufficient performance
management functionality in Open Systems, and even where it
does exist it is often provided in a different way on
systems from different vendors.
Key areas of work in the development of the UMA specifications
include performance data availability and interfaces for
its collection.
Until the data and interfaces are standardised, each computer vendor,
performance software vendor, or large end user is faced with the task of kernel
modification to collect the necessary data, development of a proprietary kernel
interface to
move the data to user-space, and development of custom
performance monitoring and management software.
Until such interfaces are standardised, few
performance management tools will be built because of the cost of their migration between
operating system versions or POSIX-based system implementations.
As open systems become the operating systems of choice for larger, faster, and more
complex computer systems, there is an increased need to effectively manage these
systems. But there exists little software to support performance management of these
complex systems. For example, administrators of standard UNIX systems must rely
on the
system activity reporter (sar)
data to manage their systems.
However, such information is often insufficent in scope,
inadequate in depth and cannot be properly controlled,
especially by multiple performance management applications
in distributed environments.
Performance management of large applications, including
databases, often has to rely on accounting data to measure
activity, but such data can be inappropriate since it was
intended for a different purpose.
There are several reasons for the lack of performance management software. One reason
is that many of the desired metrics are not available. Another reason is the fear that
release-to-release kernel changes will make it necessary to frequently
modify performance-related applications.
This discourages developers from using any
but the most basic
metrics or developing any but the most basic applications, particularly in cases where the
application must execute on platforms supplied by different vendors. There are,
furthermore, no well-defined interfaces for obtaining even the existing performance data
from the kernel, and the current access methods are restrictive and expensive.
Issues addressed by the UMA
In this section, the reasons for the definition of the UMA are
outlined in terms of the issues that have arisen with existing
performance facilities in Open Systems.
Kernel Data
Extracting performance data from the kernel of an Open System has
traditionally been done by methods which involve user level utilities
accessing the kernel data structures. An example of this is the UNIX
/dev/kmem
interface which has historically been the primary interface
used by UNIX System performance measurement utilities for extracting
data from the kernel. This mechanism generally relies on the user level
performance utility using the name of a particular data structure to
derive from the symbol table the virtual address of the structure. It
can then access the kernel data (using
/dev/kmem
in the case of UNIX) to
seek to and read the value of that data structure. The advantage of this
approach is its generality: if the address of a data structure can be
found, its value can be read. But its generality is also a disadvantage.
Since almost any data structure can be used to provide performance data,
the tendency is to do so without regard to whether it is supported. This
makes it very difficult to maintain a performance application across
releases when data structures change. For example, programs such as
ps
and
sadc
have been notoriously difficult to maintain from release to
release.
Processing Cost
The retrieval of each virtually contiguous piece of information requires
a seek system call and a read system call to extract the information
from the kernel. If there are many such pieces, the central
processing unit (cpu) costs of
gathering the information can be very high. Also, since each piece
requires a separate seek and read, it is very hard to guarantee that the
data obtained is consistent.
Access Permissions
For security reasons kernel data is not set to be readable by ordinary
users. Thus performance utilities (such as
ps
and
sadc
in the case of
UNIX) must be run as privileged programs. Ordinary programs must invoke
the performance utilities and read data either through pipes or files.
This adds to the cost of accessing this information.
Binary Compatibility
In order to reduce the number of seeks and reads necessary to obtain the
data, many metrics are combined into a single data structure (for
example,
sysinfo
in UNIX). The result is that programs must be aware of
the layout and contents of the data structure. If the data structure
layout or content change significantly between releases, binary
compatibility cannot be maintained; the programs must be recompiled with
new headers that reflect the new data structure layout and contents.
Data Synchronisation
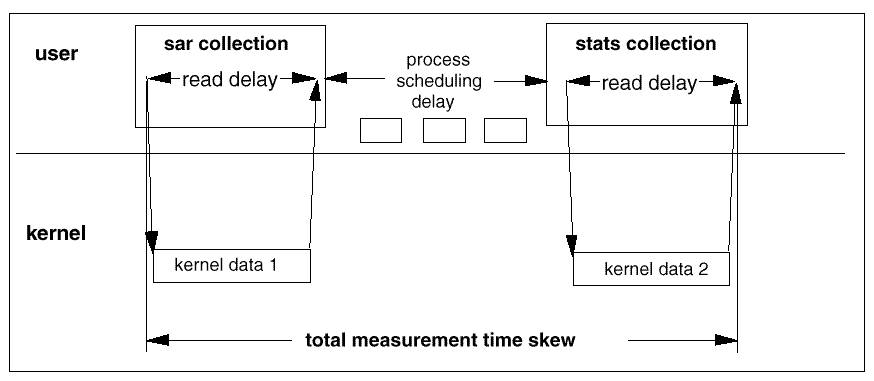
Using a variety of user space collectors to gather data can result in
skewed collection times due to the scheduling delays for each process
(see
Collection Time Skew from Separate Collection Components
for a UNIX example).
Hence if two user level utilities (for example
sar
and
stats
in the case
of UNIX) obtain performance information that is then analysed as if it
refers to the same time period, this skew means that the usefulness
of the data is impaired. A common source of user level collection would
reduce such time skews.

-
-
 sar   |______|_______|_____|______|______|_____|______|_____|_______|

 stats |______|______|_______|_____|______|______|_______|___ ___|______|

 clock |______|______|______|______|______|______|______|______|______|
Figure: Collection Time Skew from Separate Collection Components
Data Applicability
The privileged utilities that collect kernel information needed for
performance analysis is often oriented towards a particular use for
the data. An example of this is the use of accounting information for
performance analysis. The effect of this is that performance
applications often get information they do not want, get it in the wrong
form or cannot get it at all.
Measurement Applications
Existing performance measurement applications suffer from the lack of
facilities specific to their requirements to obtain performance information.
The issues in the previous section concerning kernel data obviously
contribute to the problems faced by these applications but in addition
there are general issues that apply.
Multiple Data Collection
There may be several measurement applications running, performing
different analyses of performance information. It is commonly the case
that there is no common collection mechanism between such applications,
resulting in the same data being collected, distributed and stored
separately by each application.
Control of Collection
Where there are several measurement applications running, each may
try to control the way in which performance data is collected resulting
in a conflict. So, for example, where a privileged program is invoked
to collect performance information, one application may set the collection
interval to one value and another may set it to a different value.
Methods of Collection
Where measurement applications have to use a variety of mechanisms to
effect the collection of performance information, the writing of such
applications is unnecessarily complex. Different methods have to be
written to collect very similar data from different sources and provision
must be made for additional methods to appear for different systems
and new release.
Real Time Data
Measurement applications that wish to have access to real time data
as opposed to historical data have to use different mechanisms. The
effect of this is that data may be collected, distributed and stored
more than once and that it is difficult to write an application that
will work on both real time and historical data.
Events
By the nature of the mechanisms that are used to obtain performance
information it is difficult to integrate events, and the information
they contain, into the pool of performance information. Measurement
applications should be able, if they wish, to access events as well
as synchronously requested data.
New Information
Increasingly systems are becoming capable of dynamic reconfiguration
(for example hot pull discs) and measurement applications need to be
able to find out dynamically the objects that exist and the performance
information they can supply. Measurement applications also need to have
a mechanism by which they can be notified of changes that have occurred
(that is, an event mechanism).
Data Description
Generic measurement applications need to be able to handle classes of
objects without necessarily being aware of detailed differences between
different classes of the same general type. So, for example, it should
be possible for a measurement application to be able to use the
performance information from any make and type of disc device.
However, specialised applications should be able to make use of detailed
information from a particular make of device.

Figure: Components of a Distributed Transaction
Distributed systems
Finally, we must consider the distributed environment. In the past, performance analysis
activities of a single platform at a time were meaningful because most, if not all, of the
processing of a user interaction took place on a single platform. In the emerging open
systems environment, however, this is no longer the case.
Components of a Distributed Transaction
illustrates
the situation
where a user interaction is serviced by processing on a number of platforms and
in
addition, these platforms may be supplied by a variety of vendors. In this case, the
response time experienced by the user is dependent on the response times of the
individual
service platforms and on the response times of various network components. To be able
to perform an analysis of response time requires that data be captured and tagged with
identification at least at a transaction level and that there be a mechanism that can gather
this data from distributed systems where it is captured1.
Scope and Purpose of UMA
To help address the above data collection issues and limitations, the
following three specifications for Universal Measurement Architecture
(UMA) have been developed:
-
UMA Performance Measurement Data Pool (DPD)
-
UMA Data Capture Interface (DCI)
-
UMA Measurement Layer Interface (MLI).
This Guide describes the benefits and features of the Universal Measurement
Architecture, and serves as an introduction to these
UMA specification documents for those new to this architecture.
The Universal Measurement Architecture (UMA)
provides support for the collection,
management and reporting of performance data and events.
Its goals include:
-
standardisation and portability of interfaces and data
-
collection from both kernel and application sources
-
distributed access - multiple system images
-
control of collection overhead through common collection, configurable
metrics and threshold filtering of data
-
improved data capture synchronisation
-
scalable and extensible services
-
seamless access between historical and current data
-
simple specification of interval and event data reporting.
UMA, therefore, may be considered as a powerful agent
for collecting and managing performance data.
The following Chapters describe the interfaces and services in more detail.
Footnotes
- 1.
- The tagging of workload components is predominately the concern of provider instrumentation and the
analysis of performance data is an issue for measurement applications; both are
formally outside of the
scope of UMA itself, which is focused on the control of data acquisition and on
the delivery and
management of performance data.
UMA does provide a mechanism (UMAWorkInfo instances) for
containing and transmitting a flexible number of workload identifiers which may
include a transaction ID.
It will be necessary to track emerging instrumentation methodologies
and standards efforts from DCE, ISO, and OMG working groups
to ensure that UMA remains capable of appropriate functionality in this area.
Why not acquire a nicely bound hard copy?
Click here to return to the publication details or order a copy
of this publication.


