Bonus Section B: Business Architecture
B.1 Value Stream Stage Definition Assignments
Meeting: The Business Architecture
Date: The next day
Present: Nick Ross (NR), Terri Nichols (TN), Rakesh Gupta (RG), Greg Morrison (GM), Philip Potter (PP), Jamar Johnson (JJ), Chris Keller (CK)
NR welcomes everyone and introduces the two Solution Architects that KS has assigned to work with the team. He explains his intention to assign a Business Architect to each one of the four value stream stages and, due to the linkages between the value streams, he is following TN’s suggestion of getting a couple of Solution Architects well-versed in IoT and Big Data to float between the teams to start putting together solution alternatives and have them ready by the end of the three weeks. NR also states that he anticipates a need to have at least a daily stand-up meeting to keep all of the architects in sync.
NR starts by going through a few diagrams he has put together to show the organizational view, see Organization Decomposition Diagram and Organization Decomposition (Nested).
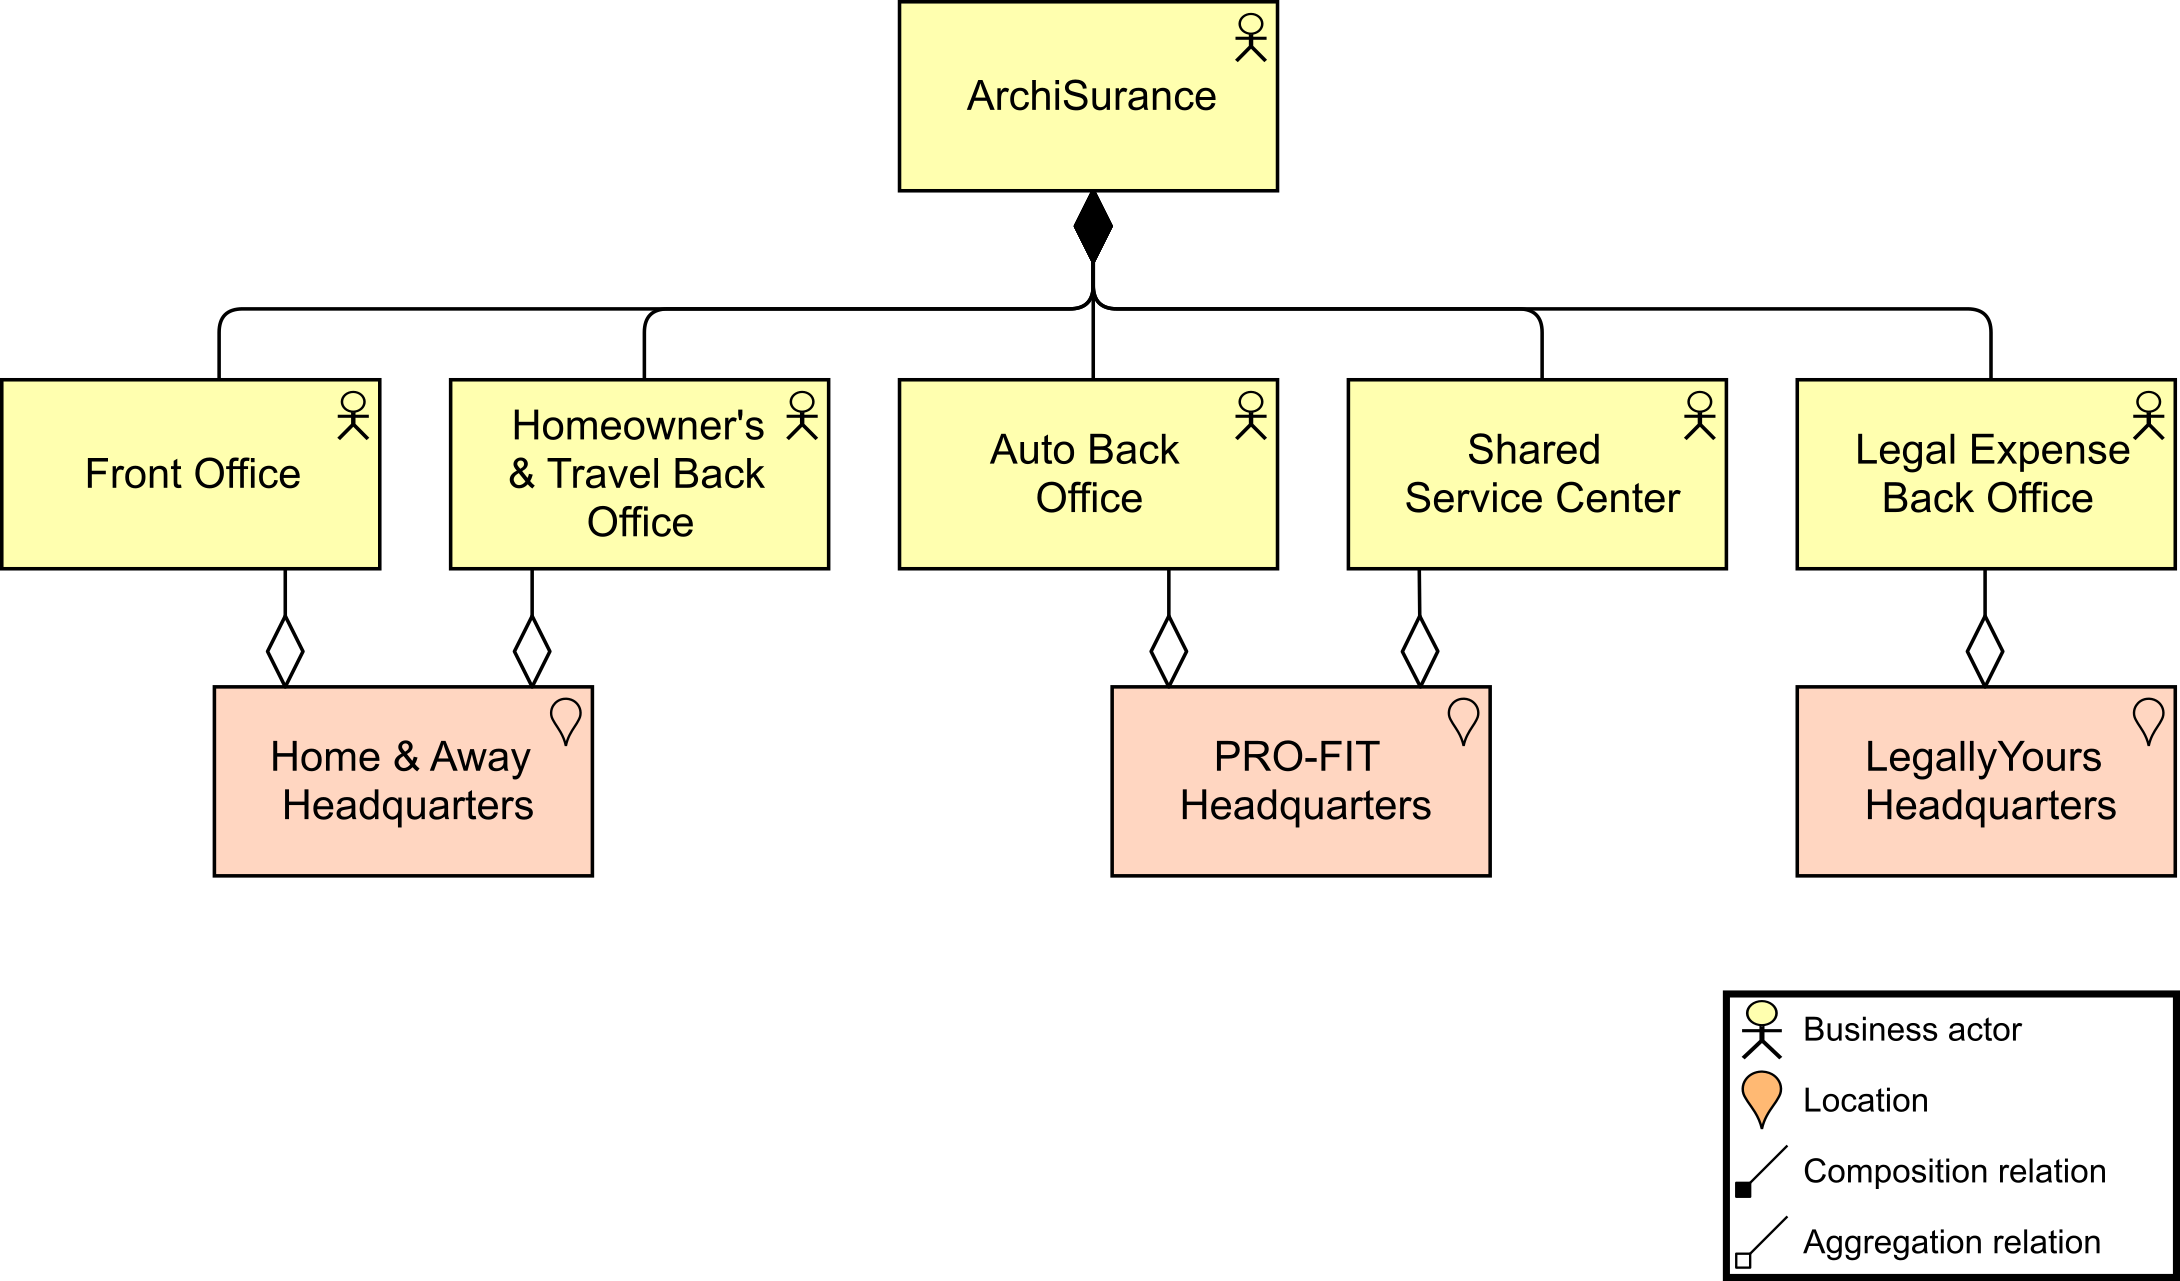
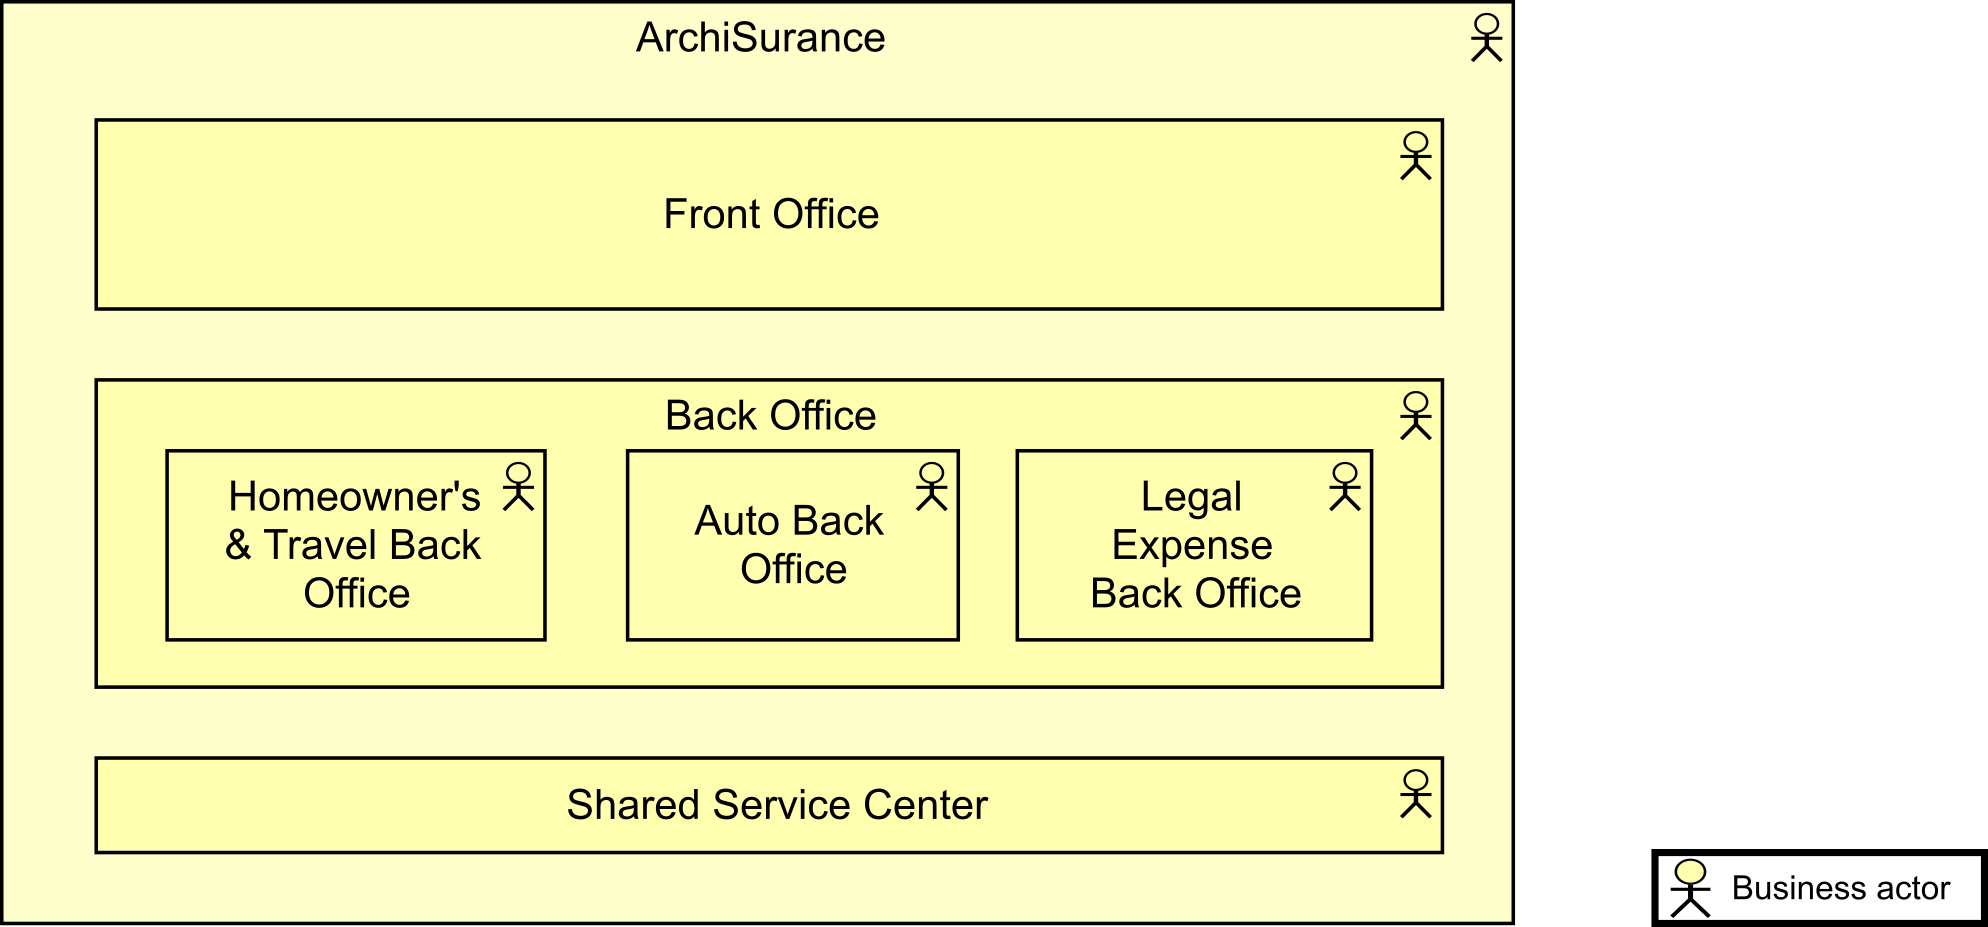
NR explains that an organization viewpoint focuses on the organization of a company, a department, a network of companies, or of another organizational entity. It is possible to present models in this viewpoint as nested block diagrams, but also as organization maps.
NR refers to Organization Decomposition Diagram, which shows the high-level organization structure of ArchiSurance, with its main locations and departments. He will expand upon this later with an Organization Decomposition diagram and eventually traditional organization charts.
NR emphasizes, while on the subject of organization, that the cross-functional teams are as important as the toolset we end up with. He explains that the aim is to ensure a good flow of processes that will enable the best use of the toolset. He encourages the teams that as they work on building out the roles, processes, information, and tools as capabilities that enable their value stream stage, we will begin to see the roles that need to be included in the cross-functional stream-aligned team.
NR reassures the teams that we are already close with the teams that have been organized for the transformation and that it may be as simple as repeating the pattern for our other key company value streams.
He also explains that instead of having to transfer support from a project like we have in the past, the stream-aligned team will also become responsible for sustaining the solution. In other words, they will build the value stream and then support what they built to continue optimizing it.
NR presents the value stream map (Value Stream Map) the team would be using as it has a direct tie to the strategic theme “Digital Customer Intimacy”. NR and TG developed this value stream late last year with several key stakeholders but have not yet had the chance to build it out stage by stage.
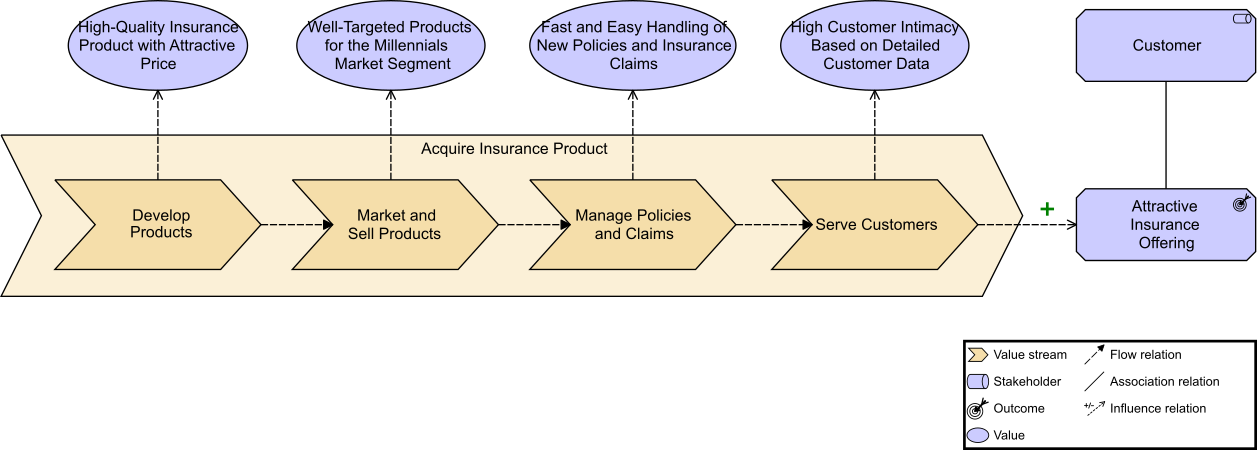
NR explains that the value stream viewpoint allows the Business Architect to create a structured overview of a value stream, the capabilities supporting the stages in that value stream, the value created, and the stakeholders involved.
He points to the model of the main, high-level value stream for acquiring insurance products (Value Stream Map) and explains that it depicts three things:
-
The stages in the value production
-
The value contribution of each value stream stage
-
The resulting outcome(s) for the customer
NR shows his suggested assignment list to the team:
-
Terri Nichols: Develop Products
-
Rakesh Gupta: Market and Sell Products
-
Greg Morrison: Manage Policies and Claims
-
Philip Potter: Serve Customers
-
Jamar Johnson: IoT
-
Chris Keller: Big Data
The team agrees that these assignments are good and that they are confident in their ability to meet the ten-day timeline to complete the Business Architecture and have opportunities identified. The last three days would be used to ensure the work is consistent across the value stream.
CK mentions that he has been working with Marketing for a couple of years, so this would be a great fit for him. GM says he feels positive about it as well, because he has been working with the Claims group for the past nine months on an initiative.
PP says he does not feel quite as confident, as Customer Service is a new area for him, but says he is always up for a challenge. PP has been reading a lot of Forrester® articles to gain context in this area and, coincidentally, read one just last week where they mentioned the IT4IT Standard.
TN says she also saw that article and has also read a lot of books and articles in this area. She is very involved with The Open Group and the IT4IT Forum, so she offered to help PP with the “Serve Customers” value stage.
PP mentions that he could help her as well on the “Develop Products” assignment since it is one of his areas of expertise. NR asks if TN and PP should switch, but they decided they would prefer to keep the assignments as-is and would work together to ensure they are not missing any key aspects.
NR suggests that all of the team work very closely with each other to peer review each other’s work.
ACTION: TN to set up peer review meetings.
NR explains that the two Solution Architects – Jamar Johnson (expert on IoT) and Chris Keller (expert on Big Data) – will float between the groups.
ACTION: JJ and CK to be invited to all stakeholder meetings.
B.2 Architecture Deliverables for Each Value Stream Stage
NR continues and presents the deliverables expected for each value stream stage:
-
Baseline State
-
Business Capability Gaps
-
Identified Opportunities
-
Target State
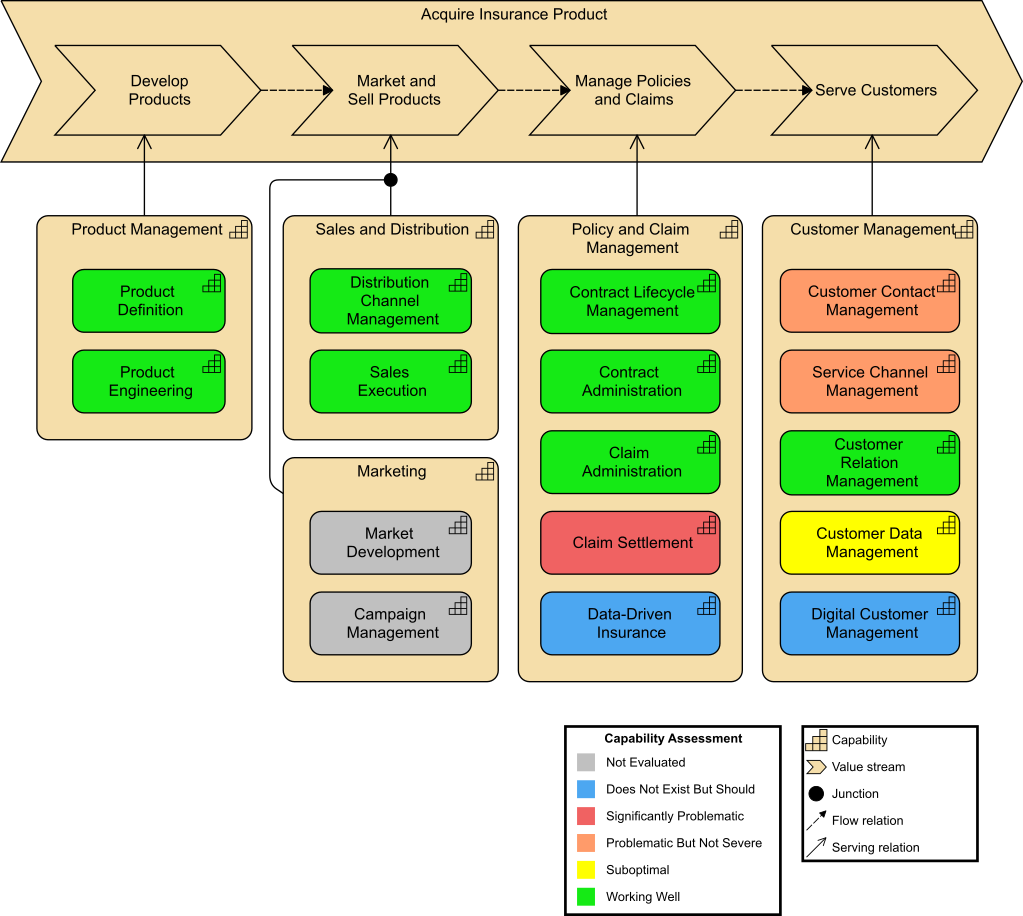
NR shows the Business Capabilities that he and TN came up with when creating the value stream (Capability Map Baseline).
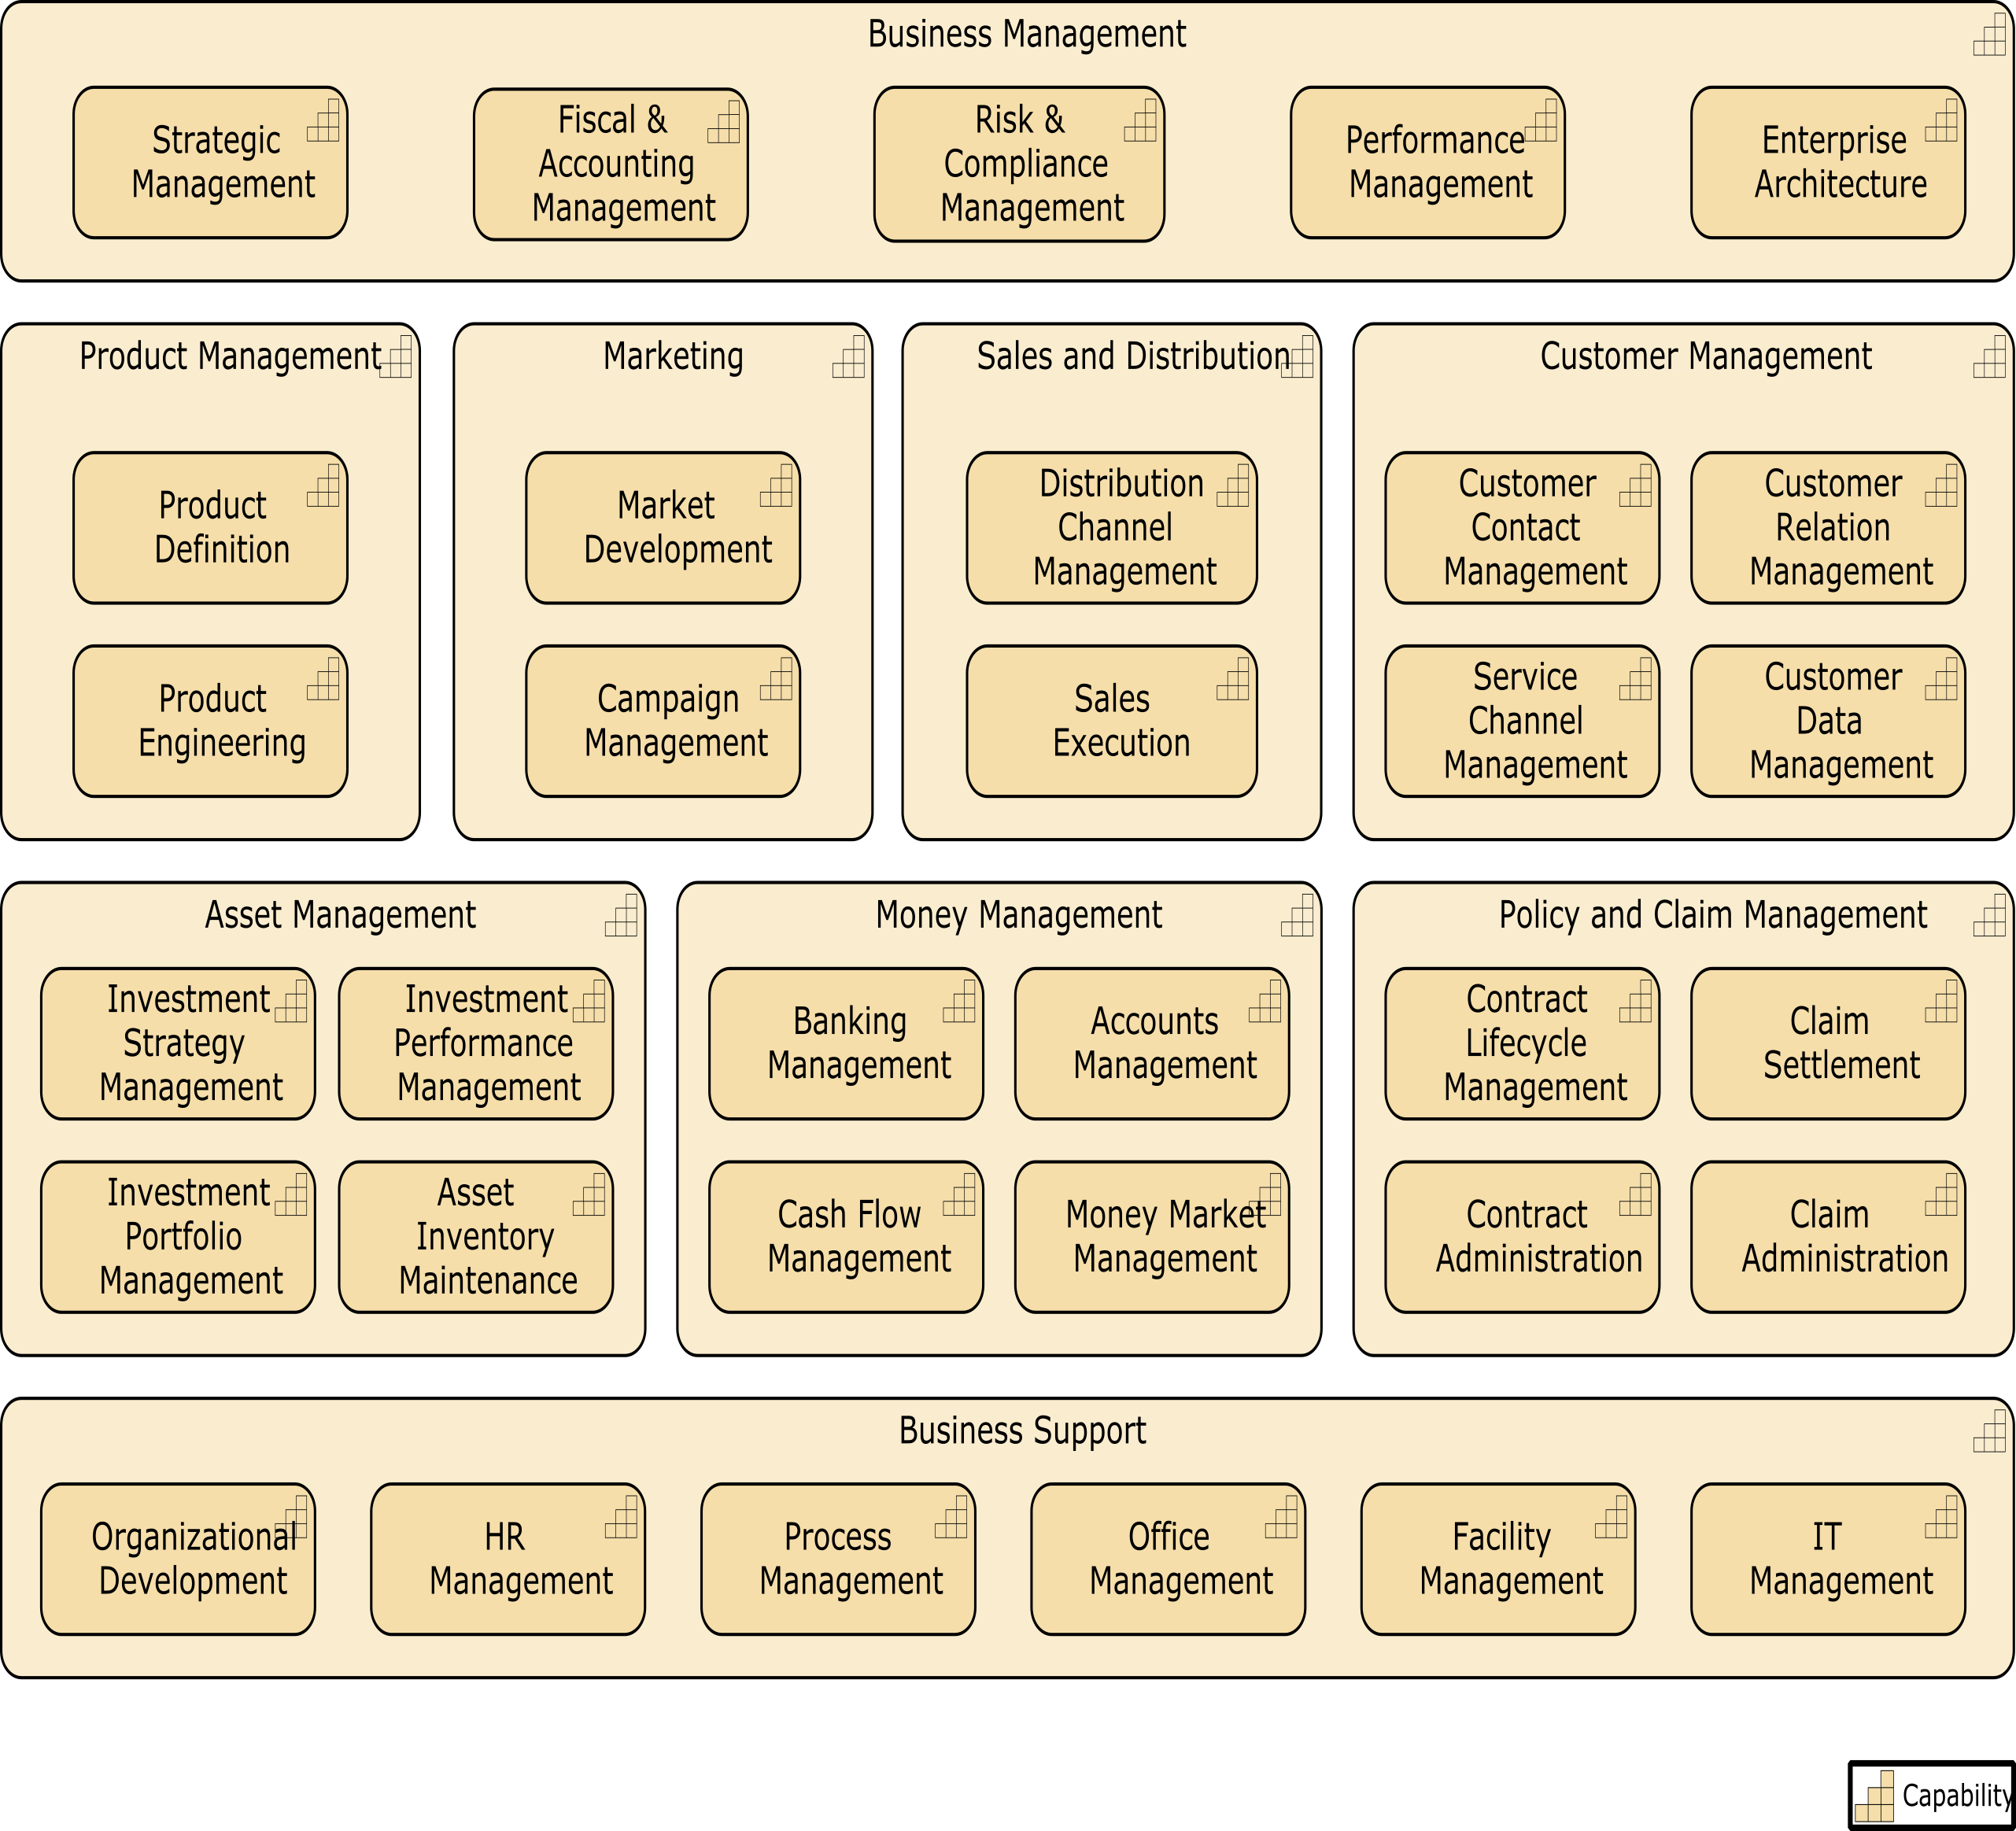
NR explains that ArchiSurance needs to improve or change several of its capabilities to implement the strategic and operational changes it envisages. This capability map was created to get a clear view of its current capabilities, inspired by the Panorama 360 Insurance and Wealth Management Enterprise Business Architecture Framework [29]. The capability map viewpoint allows you to create a structured overview of the capabilities of the enterprise. A capability map typically shows two or three levels of capabilities across the entire enterprise. It can, for example, be shaded to create a heat map that identifies areas requiring investment.
NR states that he would like a consistent format for the baseline and target state models.
ACTION: NR to schedule some time in a few days for us to get together and agree on the best template for consistency.
NR suggests a common template for the capability assessments in the form of a heat map. One he used in the past was color-coded to show red for capabilities that are significantly problematic, orange if they are problematic but not severe, yellow if they are suboptimal but not urgent, and green if they are in a good state.
ACTION: NR to bring the sample of a heat map to share before an agreement on the final template is made.
CK mentions that The Open Group TOGAF® Series Guide: Value Streams [13] and The Open Group TOGAF® Series Guide: Business Capabilities [28] might be a good place to look for industry best practice templates. He says that there are also ArchiMate guides that might help by providing some standard modeling techniques.
NR agrees and is keen to use standards that are already established. He and TN have used The Open Group TOGAF® Series Guide: Business Capabilities, which is very much in alignment with the Business Architecture Guild® guidance.[1]
ACTION: All to look through The Open Group TOGAF® Series Guides for possible ideas on how we can use the guidance to improve our architecture.
NR concludes by asking the team to think about how we should show our roadmap once we have all opportunities identified.
B.3 Architecture Status Meeting
Meeting: The Results of the Business Capability Assessment and the “Manage Policies and Claims” Value Stream Stage
Date: August 27. Gold Conference Room, 2.00pm
Present: Kathleen Stone (KS), Nick Ross (NR), Terri Nichols (TN), Rakesh Gupta (RG), Greg Morrison (GM), Philip Potter (PP), Jamar Johnson (JJ), Chris Keller (CK)
NR welcomes everyone and begins with the results of a capability assessment that was conducted prior to the teams getting started on building out their assigned value stream stages.
NR shows that the Business Capability assessment (Value Stream – Capability Cross-Mapping) revealed significant problems in “Claim Settlement” and “Service Channel Management”. The technology enhancement capabilities “Data-Driven Insurance” and “Digital Customer Management” are also in the same two value stream stages. Based on these results, the team determines that we should focus on the last two value stream stages first. As a result, NR reassigns TN to work with PP on “Serve Customers” and RG to work with GM on “Manage Policies and Claims”.
The plan is to get these two value streams built out first and then re-evaluate whether or not we need to complete the other two value stream stages at this time for the Digital Customer Intimacy initiative.
This initiative is really driving the application of two new technologies (IoT and Big Data) into our environment to ultimately drive profitability for ArchiSurance through a best-in-class online customer experience.
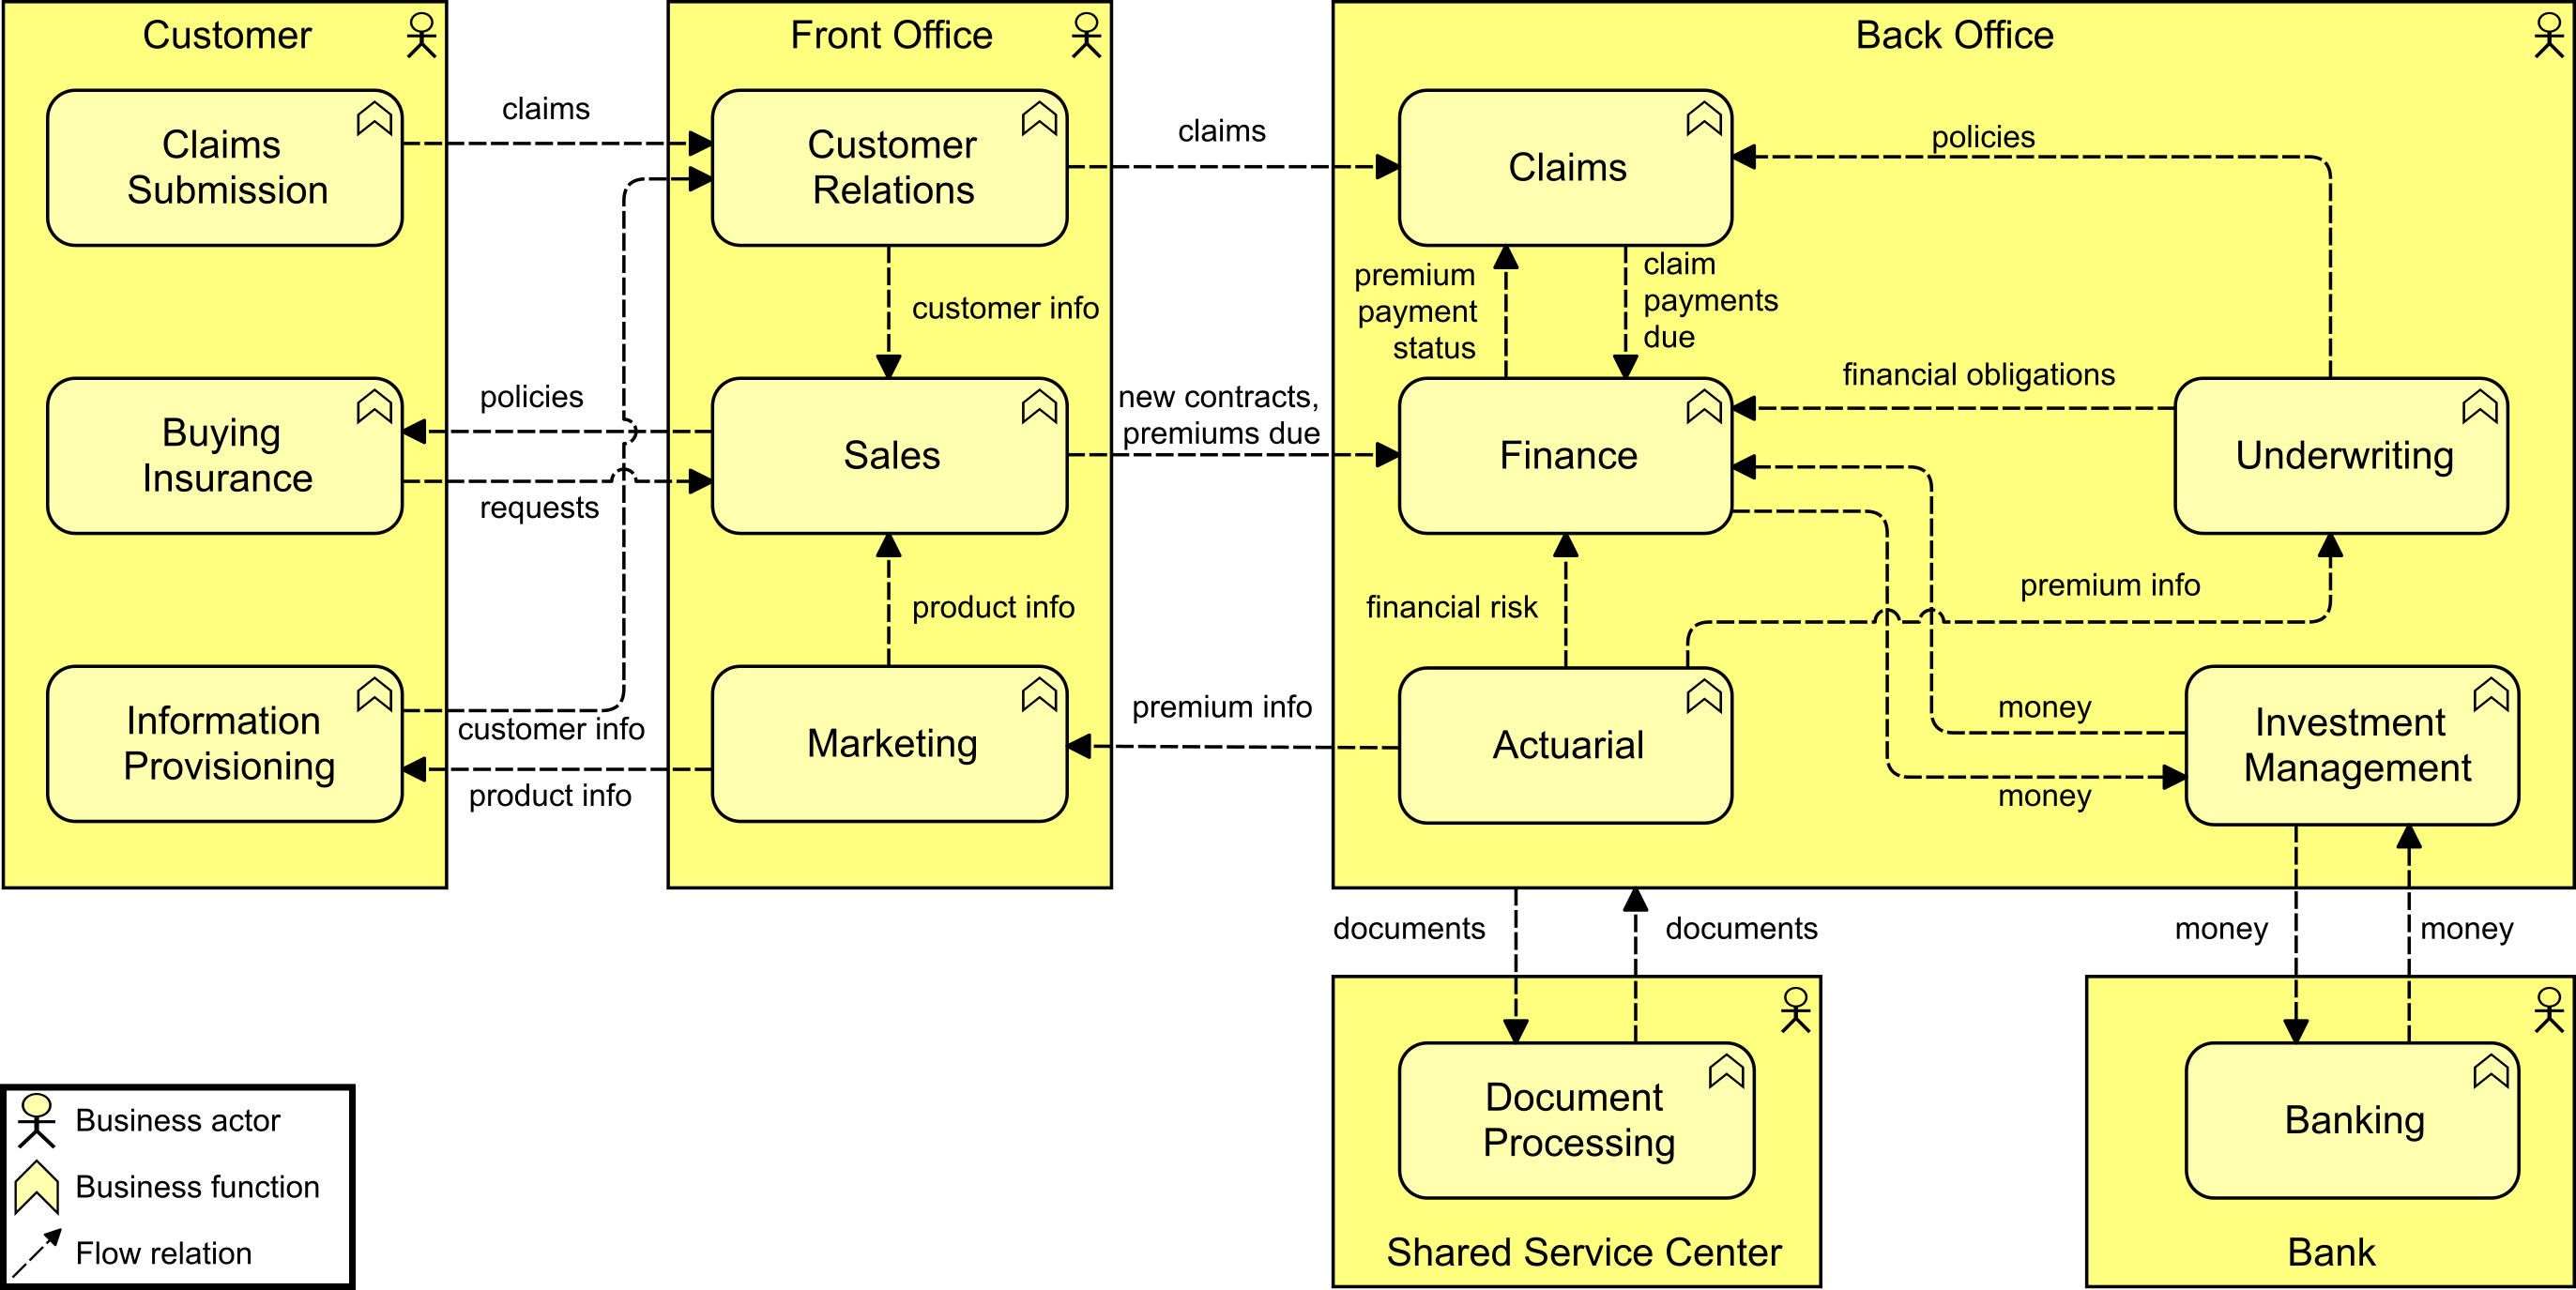
NR presents a diagram he developed a few months ago with TN to show the main business functions of ArchiSurance, as well as the most important information flows between the functions and external parties. This diagram may help discussions with stakeholders.
NR displays the list of the main business functions distinguished by ArchiSurance:
-
Marketing: studies, plans, promotes, and manages products and market segments, and works with Actuarial to design products
-
Actuarial, which determines product prices and reserve levels, works with Marketing to design new products, and analyzes enterprise risk
-
Customer Relations: includes the interactions between ArchiSurance and its customers; it handles customer questions, captures incoming claims, and conducts direct marketing campaigns
-
Underwriting, which sets prices for individual policies and generates insurance proposals and policies
-
Claims: formulates and executes a response to each claim against an ArchiSurance policy
-
Sales: manages a pipeline of opportunities, and closes contracts with customers
-
Finance: handles regular premium collection and the payment of insurance claims
-
Document Processing: supports other functions through document scanning, printing, and archiving
-
Investment Management: manages financial and real estate assets for maximum returns within corporate and regulatory liquidity and risk constraints
NR then presents the business function viewpoint (Functional Decomposition Diagram), which shows the main business functions of the organization and their relationships in terms of the flows of information, value, or goods between them.
PP says that this helps tremendously to see how the functional groups connect to our customers.
KS agrees that this is helpful for their stakeholder conversations.
NR introduces the sub-team presentations, starting with RG and GM on the Manage Policies and Claims value stream stage, followed by TN and PP.
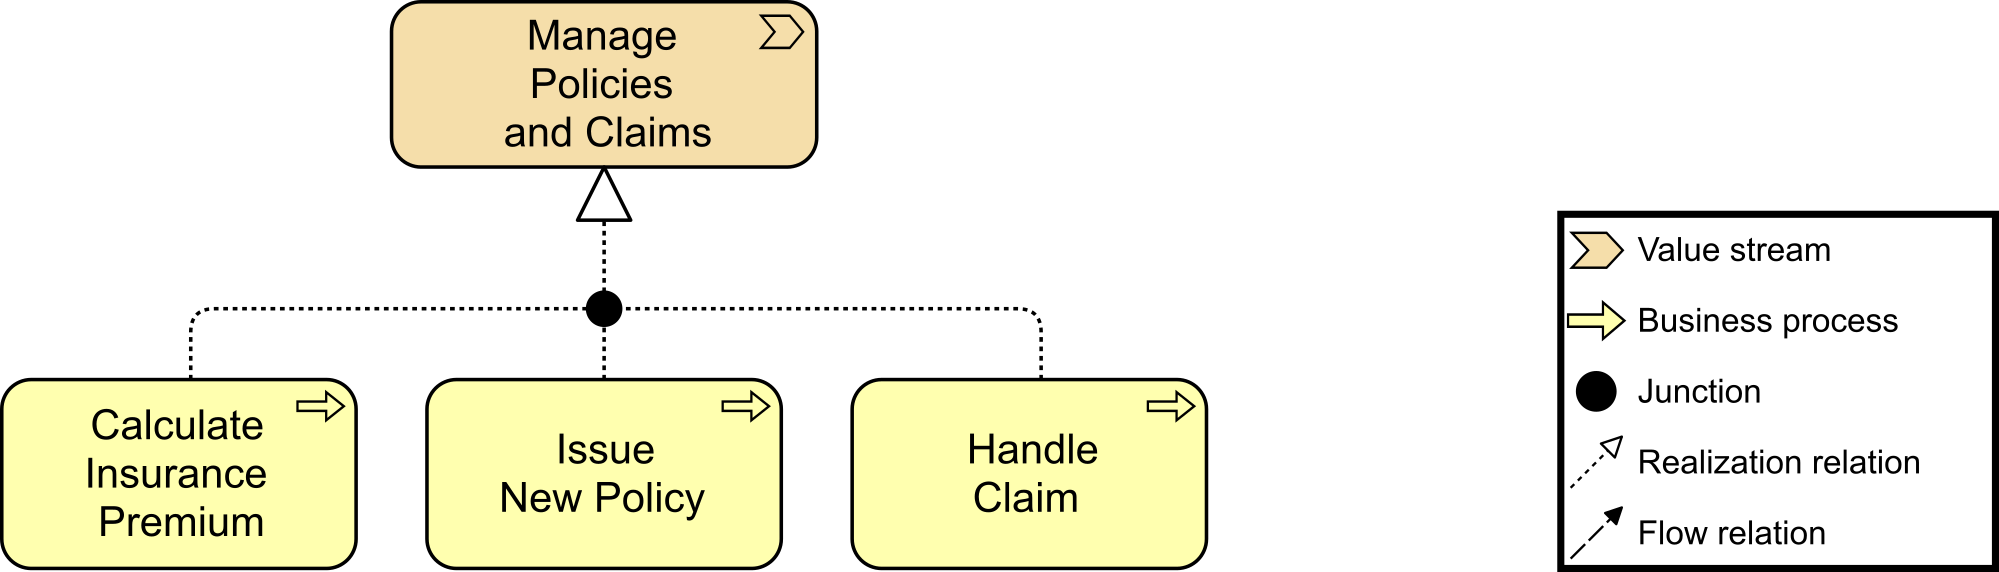
RG starts by showing a slide with two central business processes of ArchiSurance (Business Process Diagram). This diagram shows the high-level sub-processes: “Issue New Policy”, which is performed when selling a new insurance product, and “Handle Claim”, which is performed when a damage claim has been received. While the details of these processes may differ for the different types of insurance products, the main steps are essentially the same.
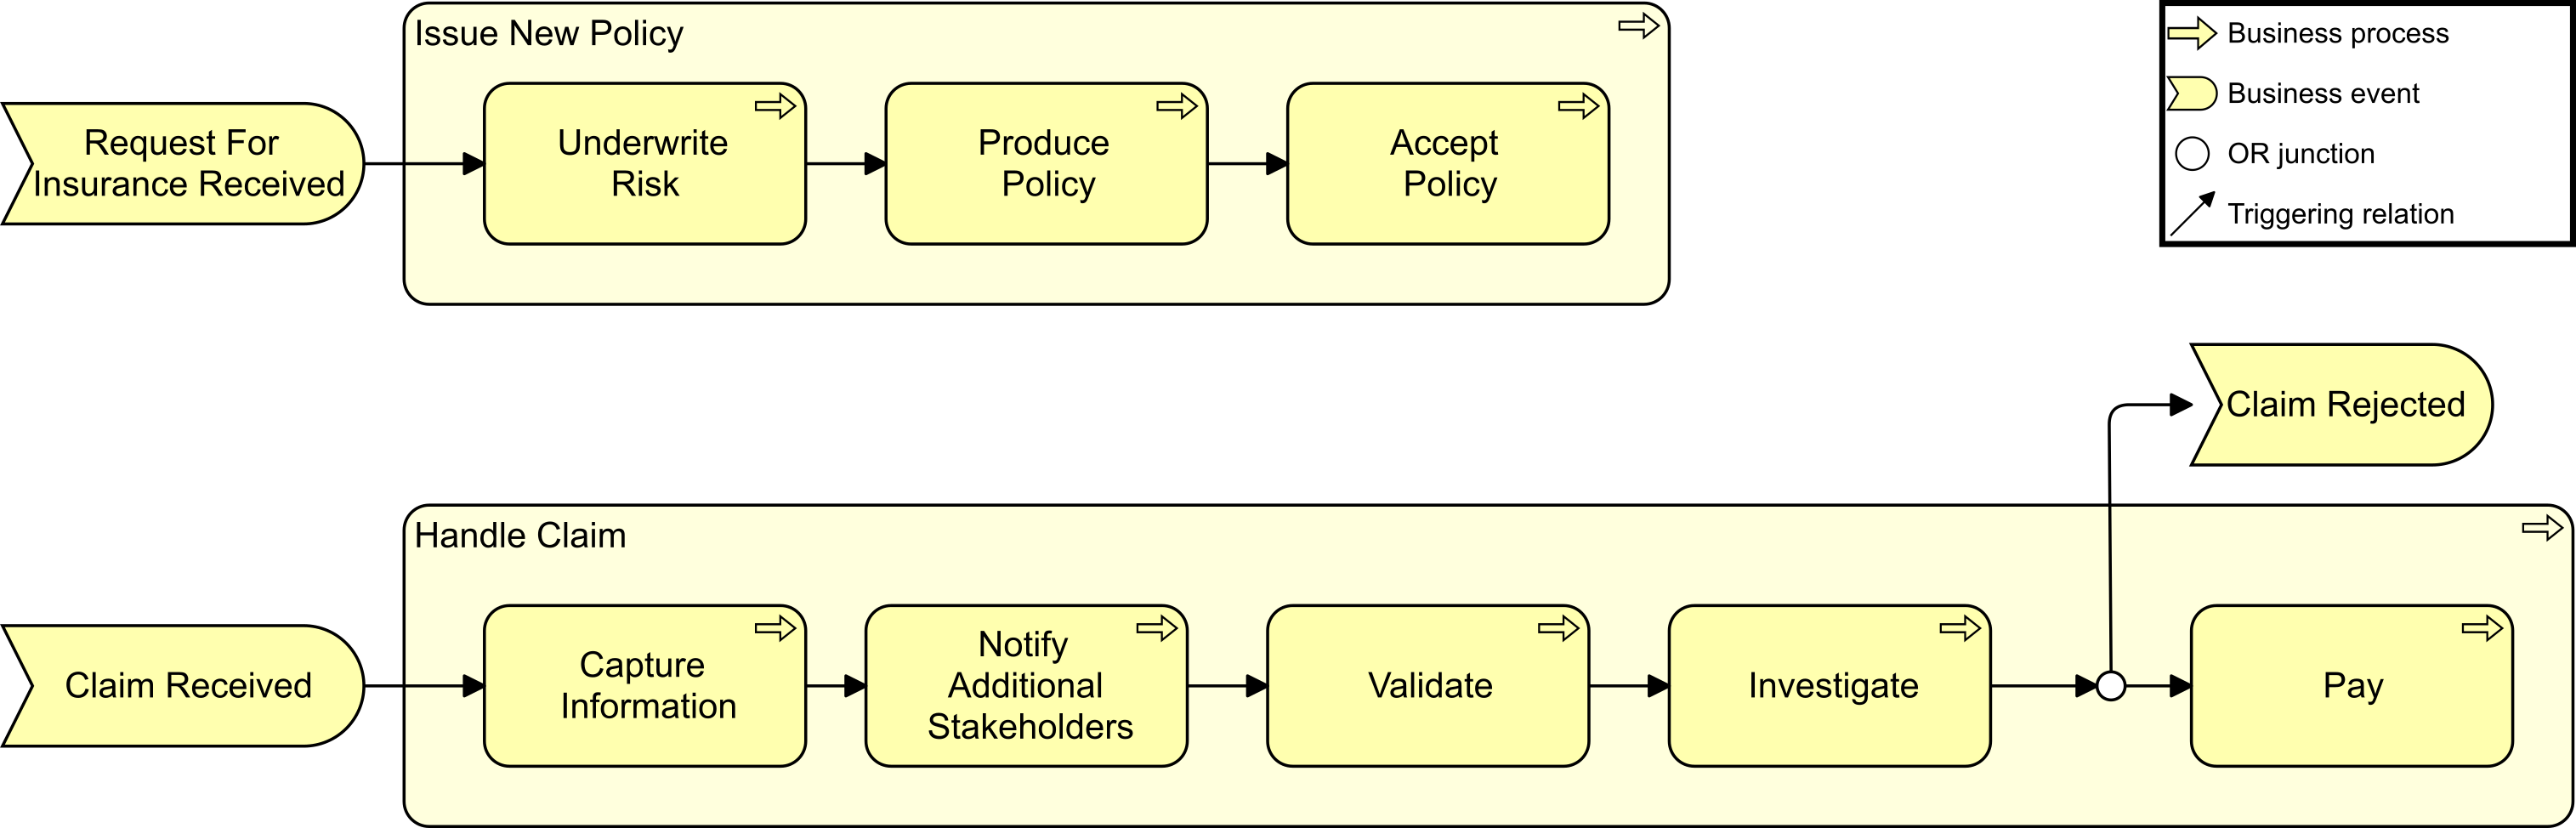
RG points out that the value stream stage is being realized by three business processes as depicted in Value Stream Realization.
B.4 Target Architecture Realization of Business Requirements
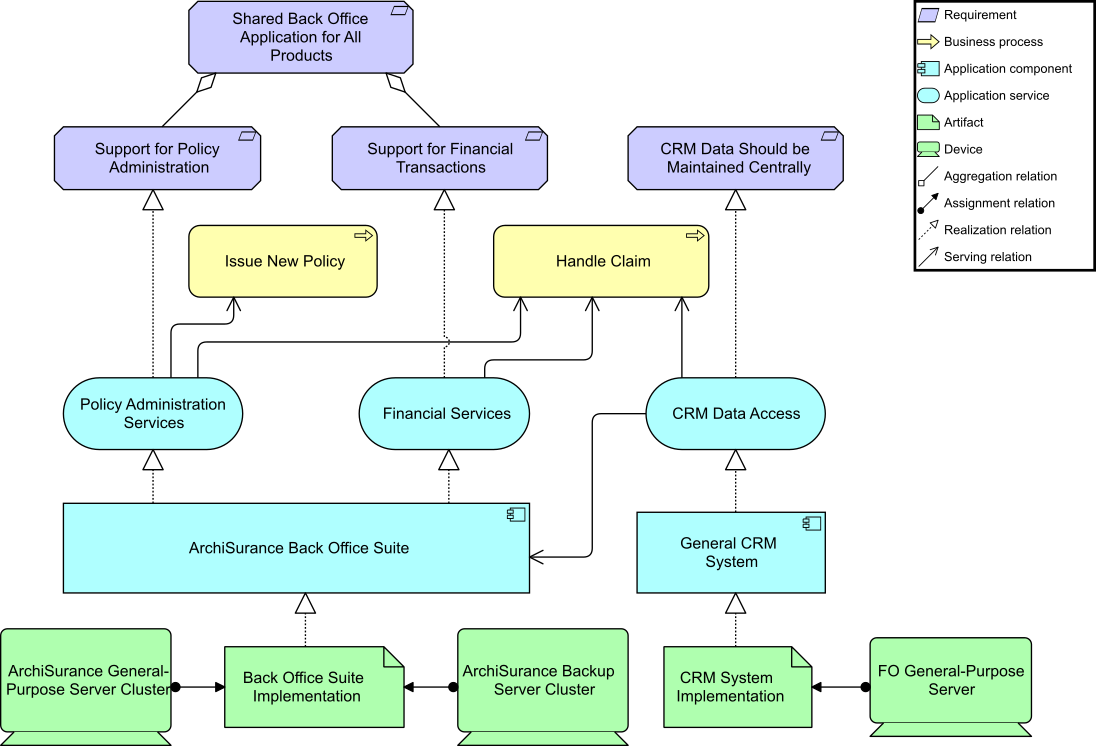
GM takes over the presentation and shows a partial requirements realization view. He explains that in Business Architecture, we need to show how the Target Architecture realizes the key business requirements. For this purpose, the TOGAF Standard specifies a Business Footprint diagram. In the ArchiMate language, this can be expressed using the requirements realization viewpoint. This viewpoint allows the designer to model the realization of requirements by the core elements, such as business actors, business services, business processes, application services, application components, etc. Typically, these requirements result from the goal realization viewpoint. Requirements Realization Diagram shows how business requirements established in the Architecture Vision phase are realized by elements in the architecture for the “Handle Claim” process.
B.5 Capabilities Gap Analysis
GM continues to the next slide to show that the Digital Customer Intimacy strategy of ArchiSurance also requires changes to the Business Architecture. First of all, new capabilities are needed, as previously identified.
GM moves on to present Capabilities Gap – Policy and Claim Management, which shows these new capabilities in the context of the pre-existing “Policy and Claim Management” capabilities.
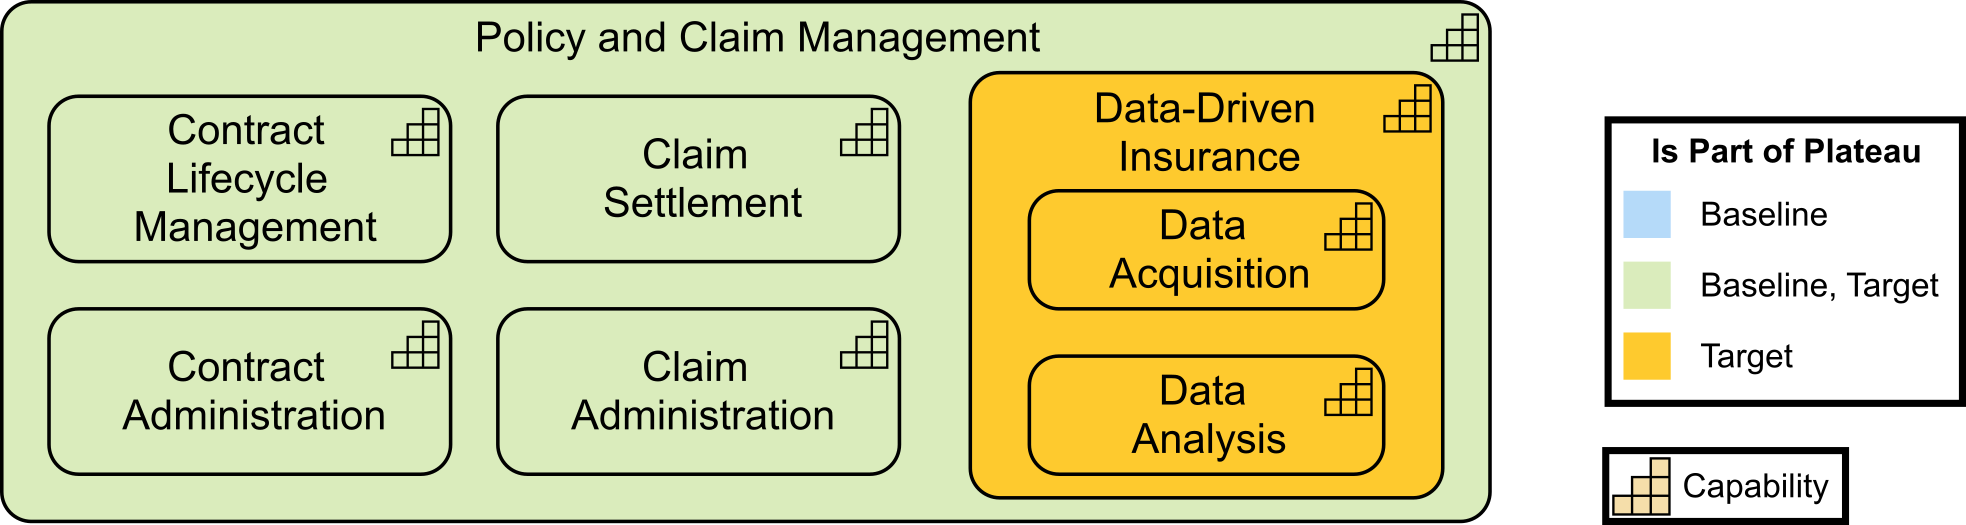
GM concludes the Policy and Claim Management presentation.
GM says they have also done a capability realization resource map with the entire team. TN and PP will present this on behalf of the team including the Solution Architects CK and JJ.
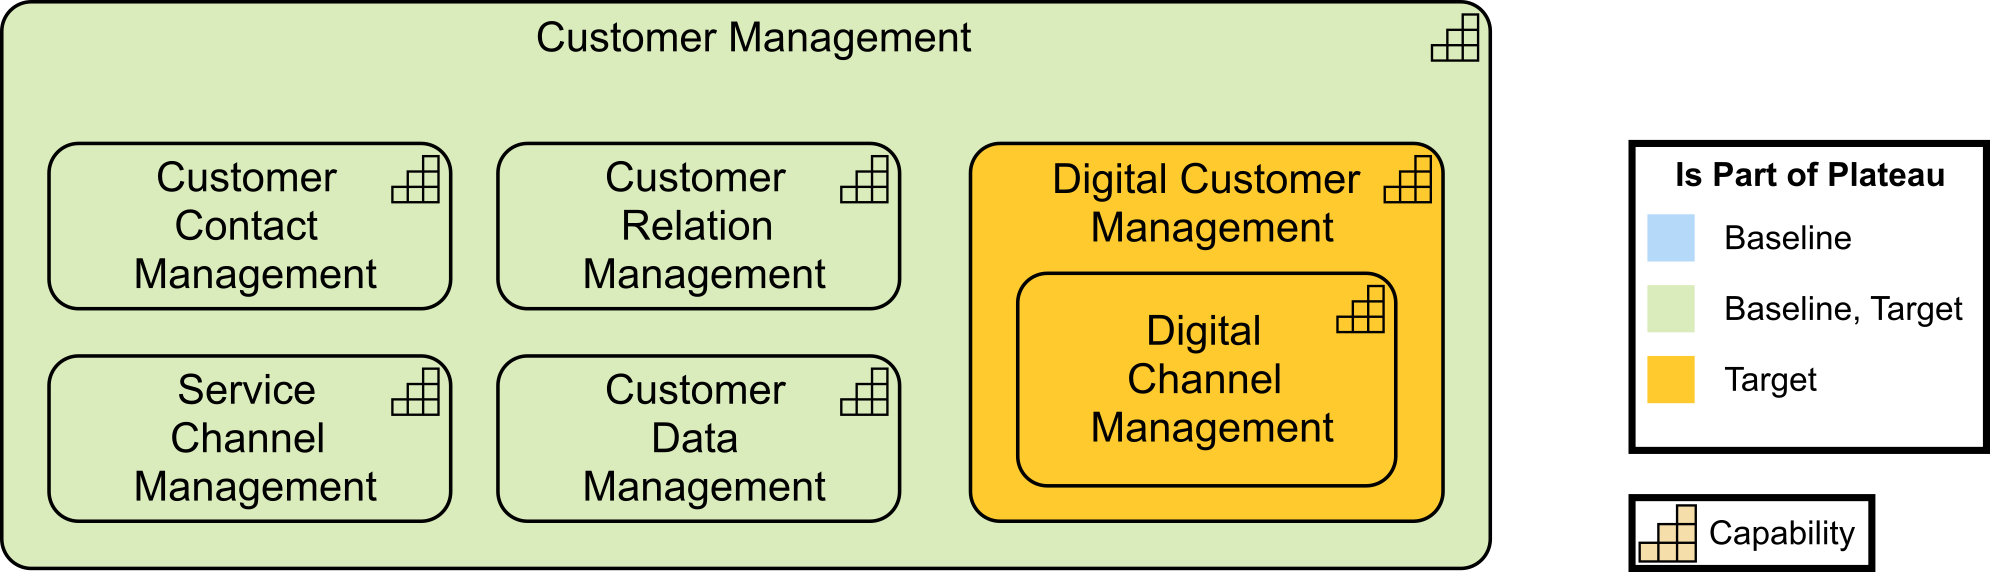
PP begins by explaining that he and TN had Digital Customer Management capabilities that are not in our existing environment but will be needed, as shown in Capabilities Gap – Customer Management. He also points out that, as shown in the last presentation, the other value stream stage has a non-existent capability called “Data-Driven Insurance”.
B.6 Capability Realization Resource Map
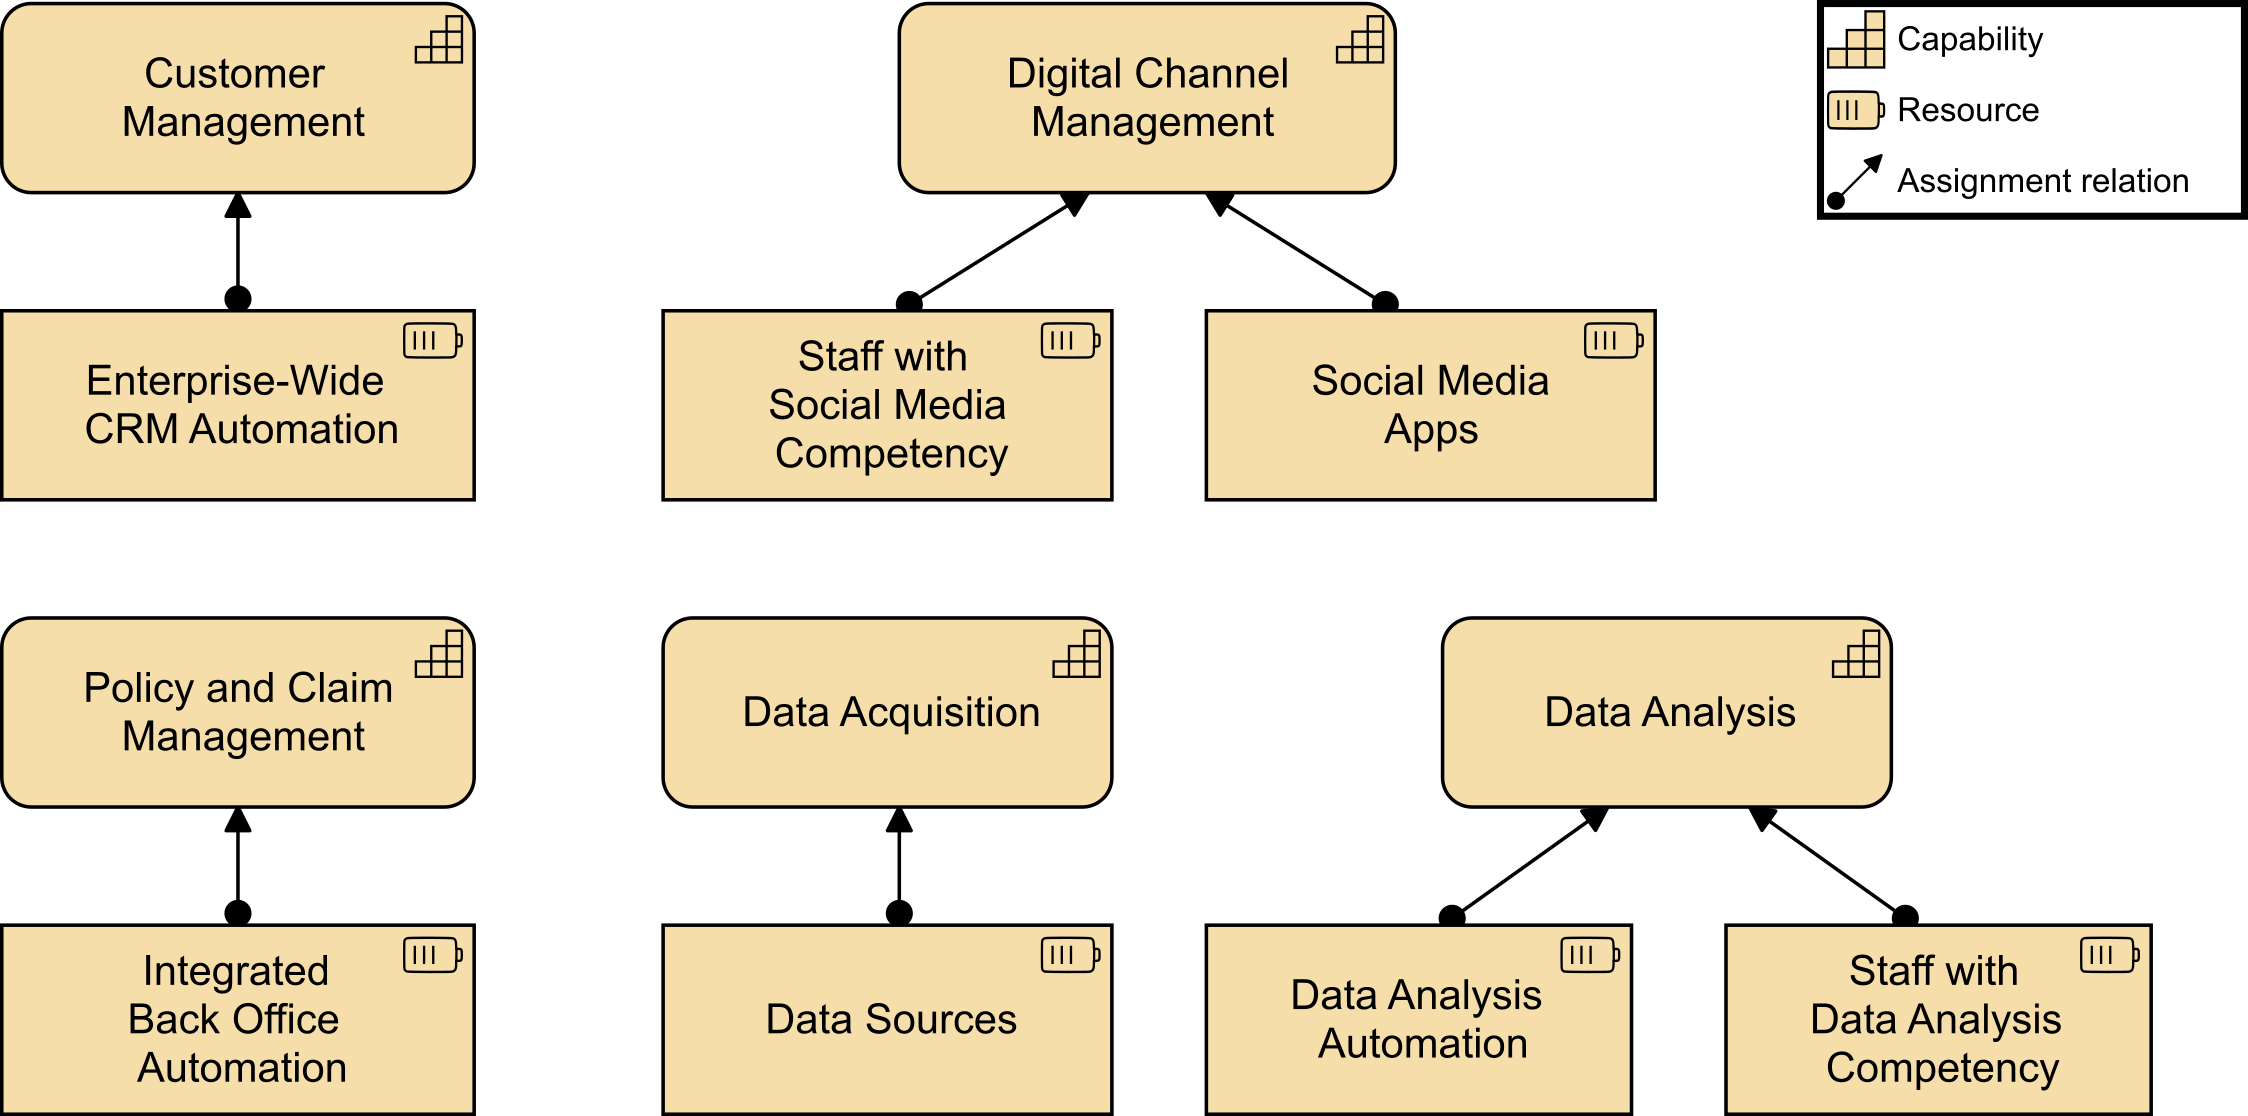
PP continues by showing the joint capability realization resource map (Resource Map) that everyone worked on at one of the weekly meetings.
These capabilities require personnel with the right knowledge and skills for the digital age, smart devices for data acquisition, and the customer data itself. The resource map viewpoint allows the Business Architect to create a structured overview of the resources of the enterprise. A resource map may also show relationships between resources and the capabilities they support.
On the left-hand side of Resource Map you see the capabilities and resources related to the Rationalization strategy, and on the right are those linked to the Digital Customer Intimacy strategy.
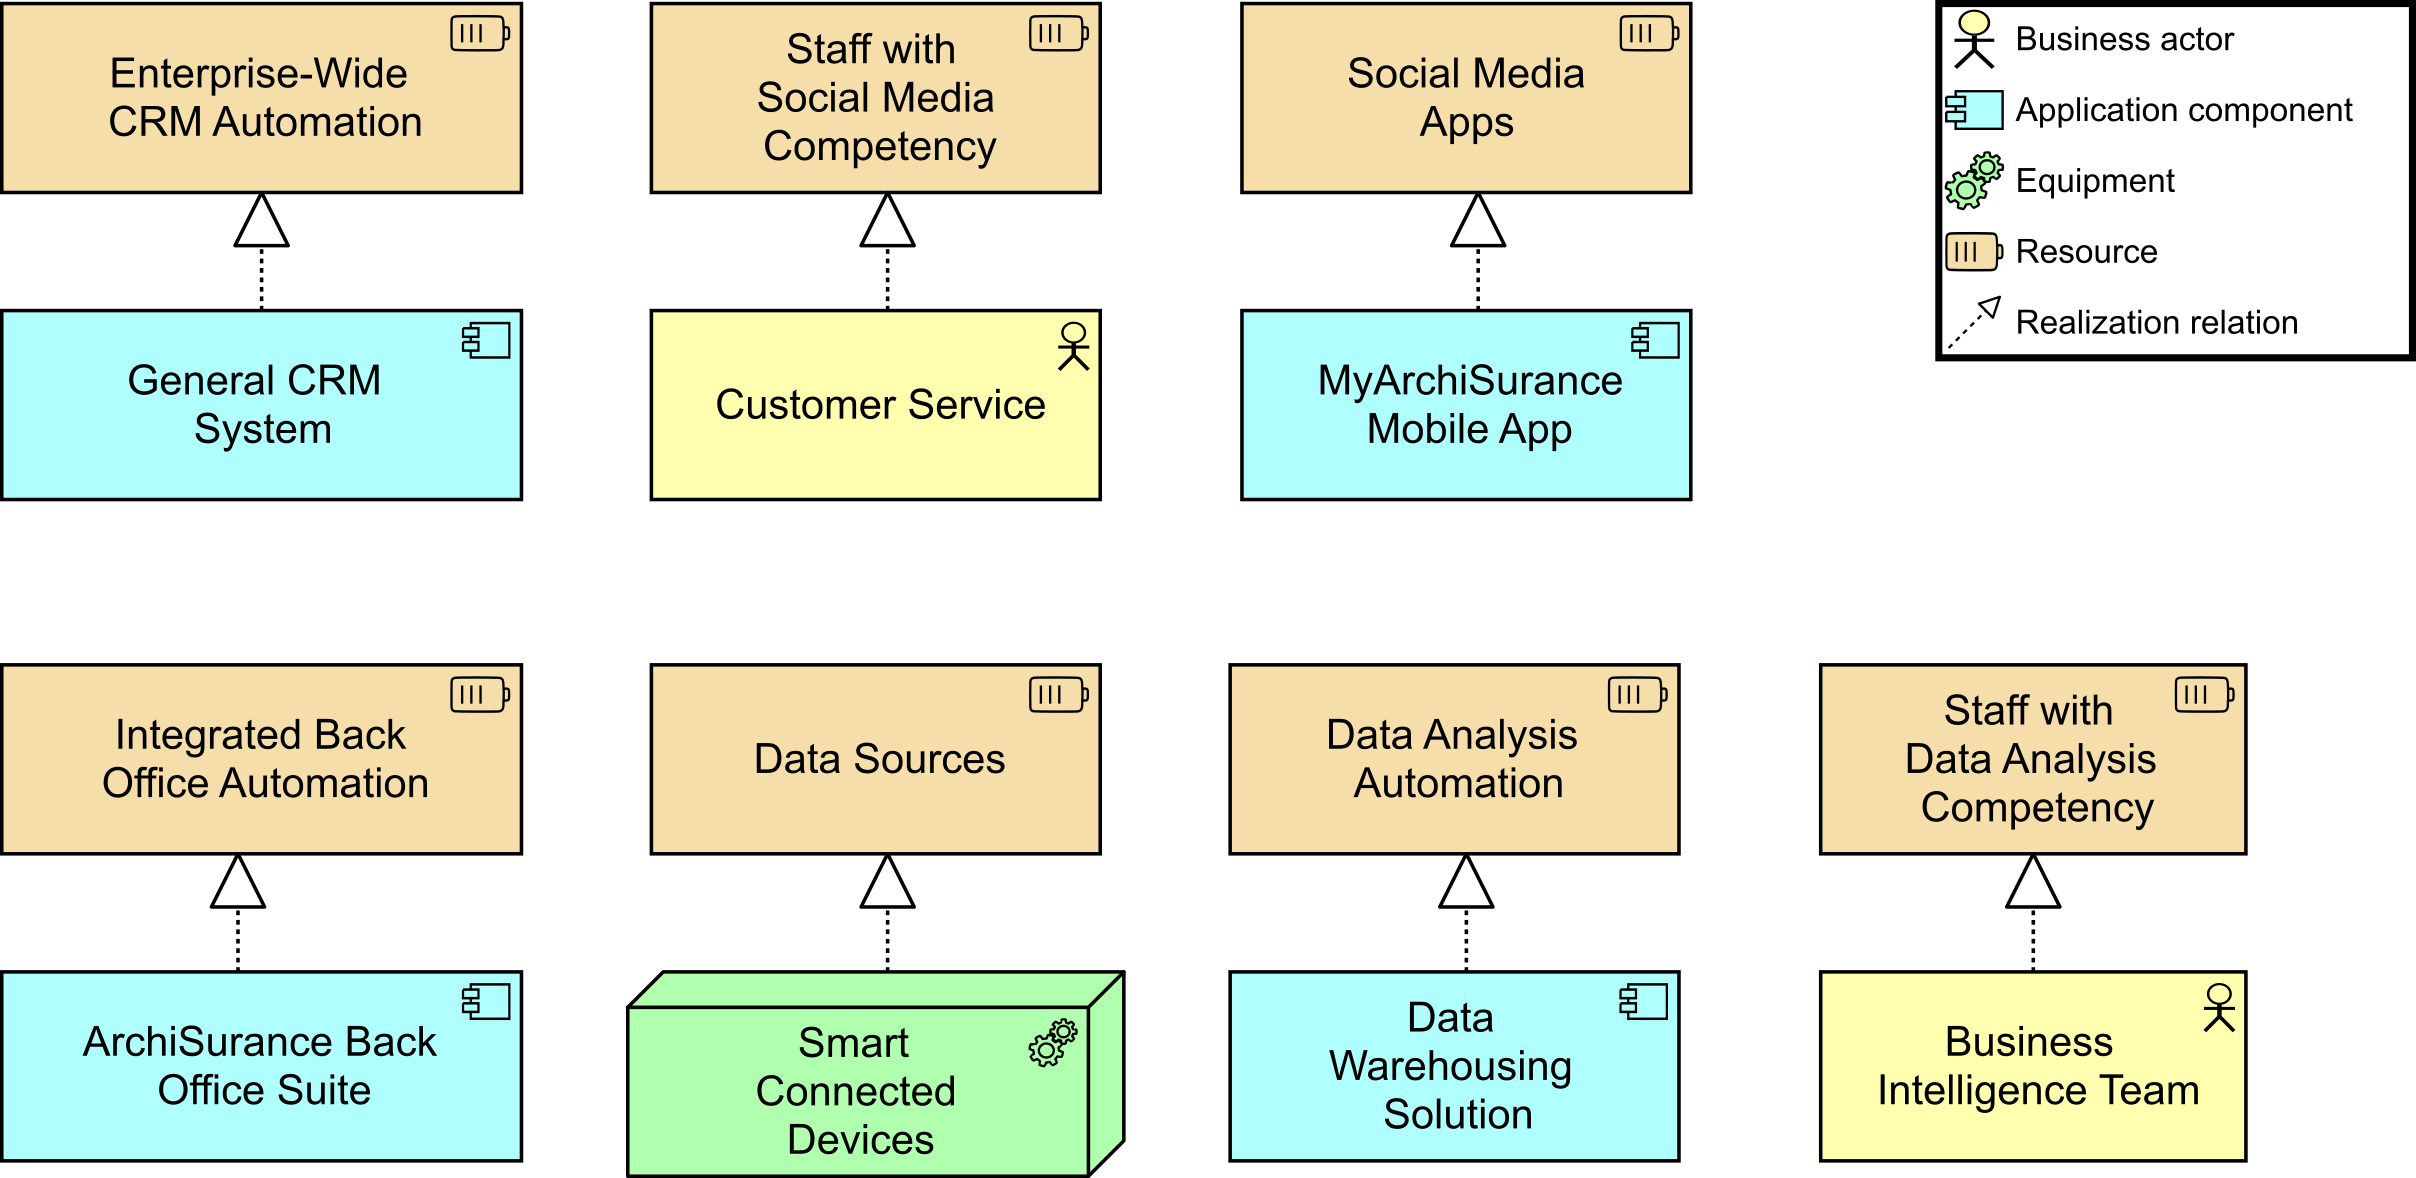
These resources themselves are realized by the rest of the Business, Information Systems, and Technology Architectures that are the subject of Phases B, C, and D of the TOGAF ADM. Resource Realization shows a small part of what this may result in.
PP points out that this does not depict all elements needed to realize these resources, it’s just a representative sample, again showing the implementation of the Rationalization strategy on the left and the Digital Customer Intimacy strategy on the right.
In practice, separate views will often be created to show how individual capabilities and resources are realized. CK’s and JJ’s experience with IoT and Big Data deployments really helped with the identification of the required competencies and the linkages to capability realization.
PP asks if anyone has any questions about anything in this presentation or the status.
KS says she doesn’t have any questions, but really likes how the team have identified the resource requirements early on for some of these new capabilities, as this often gets left to the end of an initiative and can cause implementation delays when resources are not available for the support of a new technology. KS is also very impressed with the diagrams and standard formats.
PP replies that lots of templates and examples were found in The Open Group Library, and that really sped up the work to represent the conclusions.
TN reminds the team that she and PP will have their value stream stage completed by the end of this week so it will be ready to present at the next status meeting.
B.7 Second Architecture Status Meeting
Meeting: Team Status Meeting: “Serve Customer” Value Stream Stage
Date: September 3
Present: Kathleen Stone (KS), Nick Ross (NR), Terri Nichols (TN), Rakesh Gupta (RG), Greg Morrison (GM), Philip Potter (PP), Jamar Johnson (JJ), Chris Keller (CK)
TN welcomes everyone and begins by thanking GM and RG for the work they presented at the last meeting. She explained that she and PP took the format used as their starting point and embellished it a little.
TN asks for their input on that here, hoping that the team will all like our method for defining the processes within each value stream stage.
PP describes how they started by engaging the key stakeholders, which included Customer Relations and the Fulfillment Center. The Customer Relations group also provided some customer survey information that was representative of our customer’s point of view.
PP describes how they used a value stream stage definition template taken from The Open Group TOGAF® Series Guide: Value Streams [13] to gather the information about our “Serve Customers” value stream stage.
PP explains that the template helped them to ask the right questions of the stakeholders and that then, using the definitions, it was easy to create the diagram of the process flow for the value stream stage.
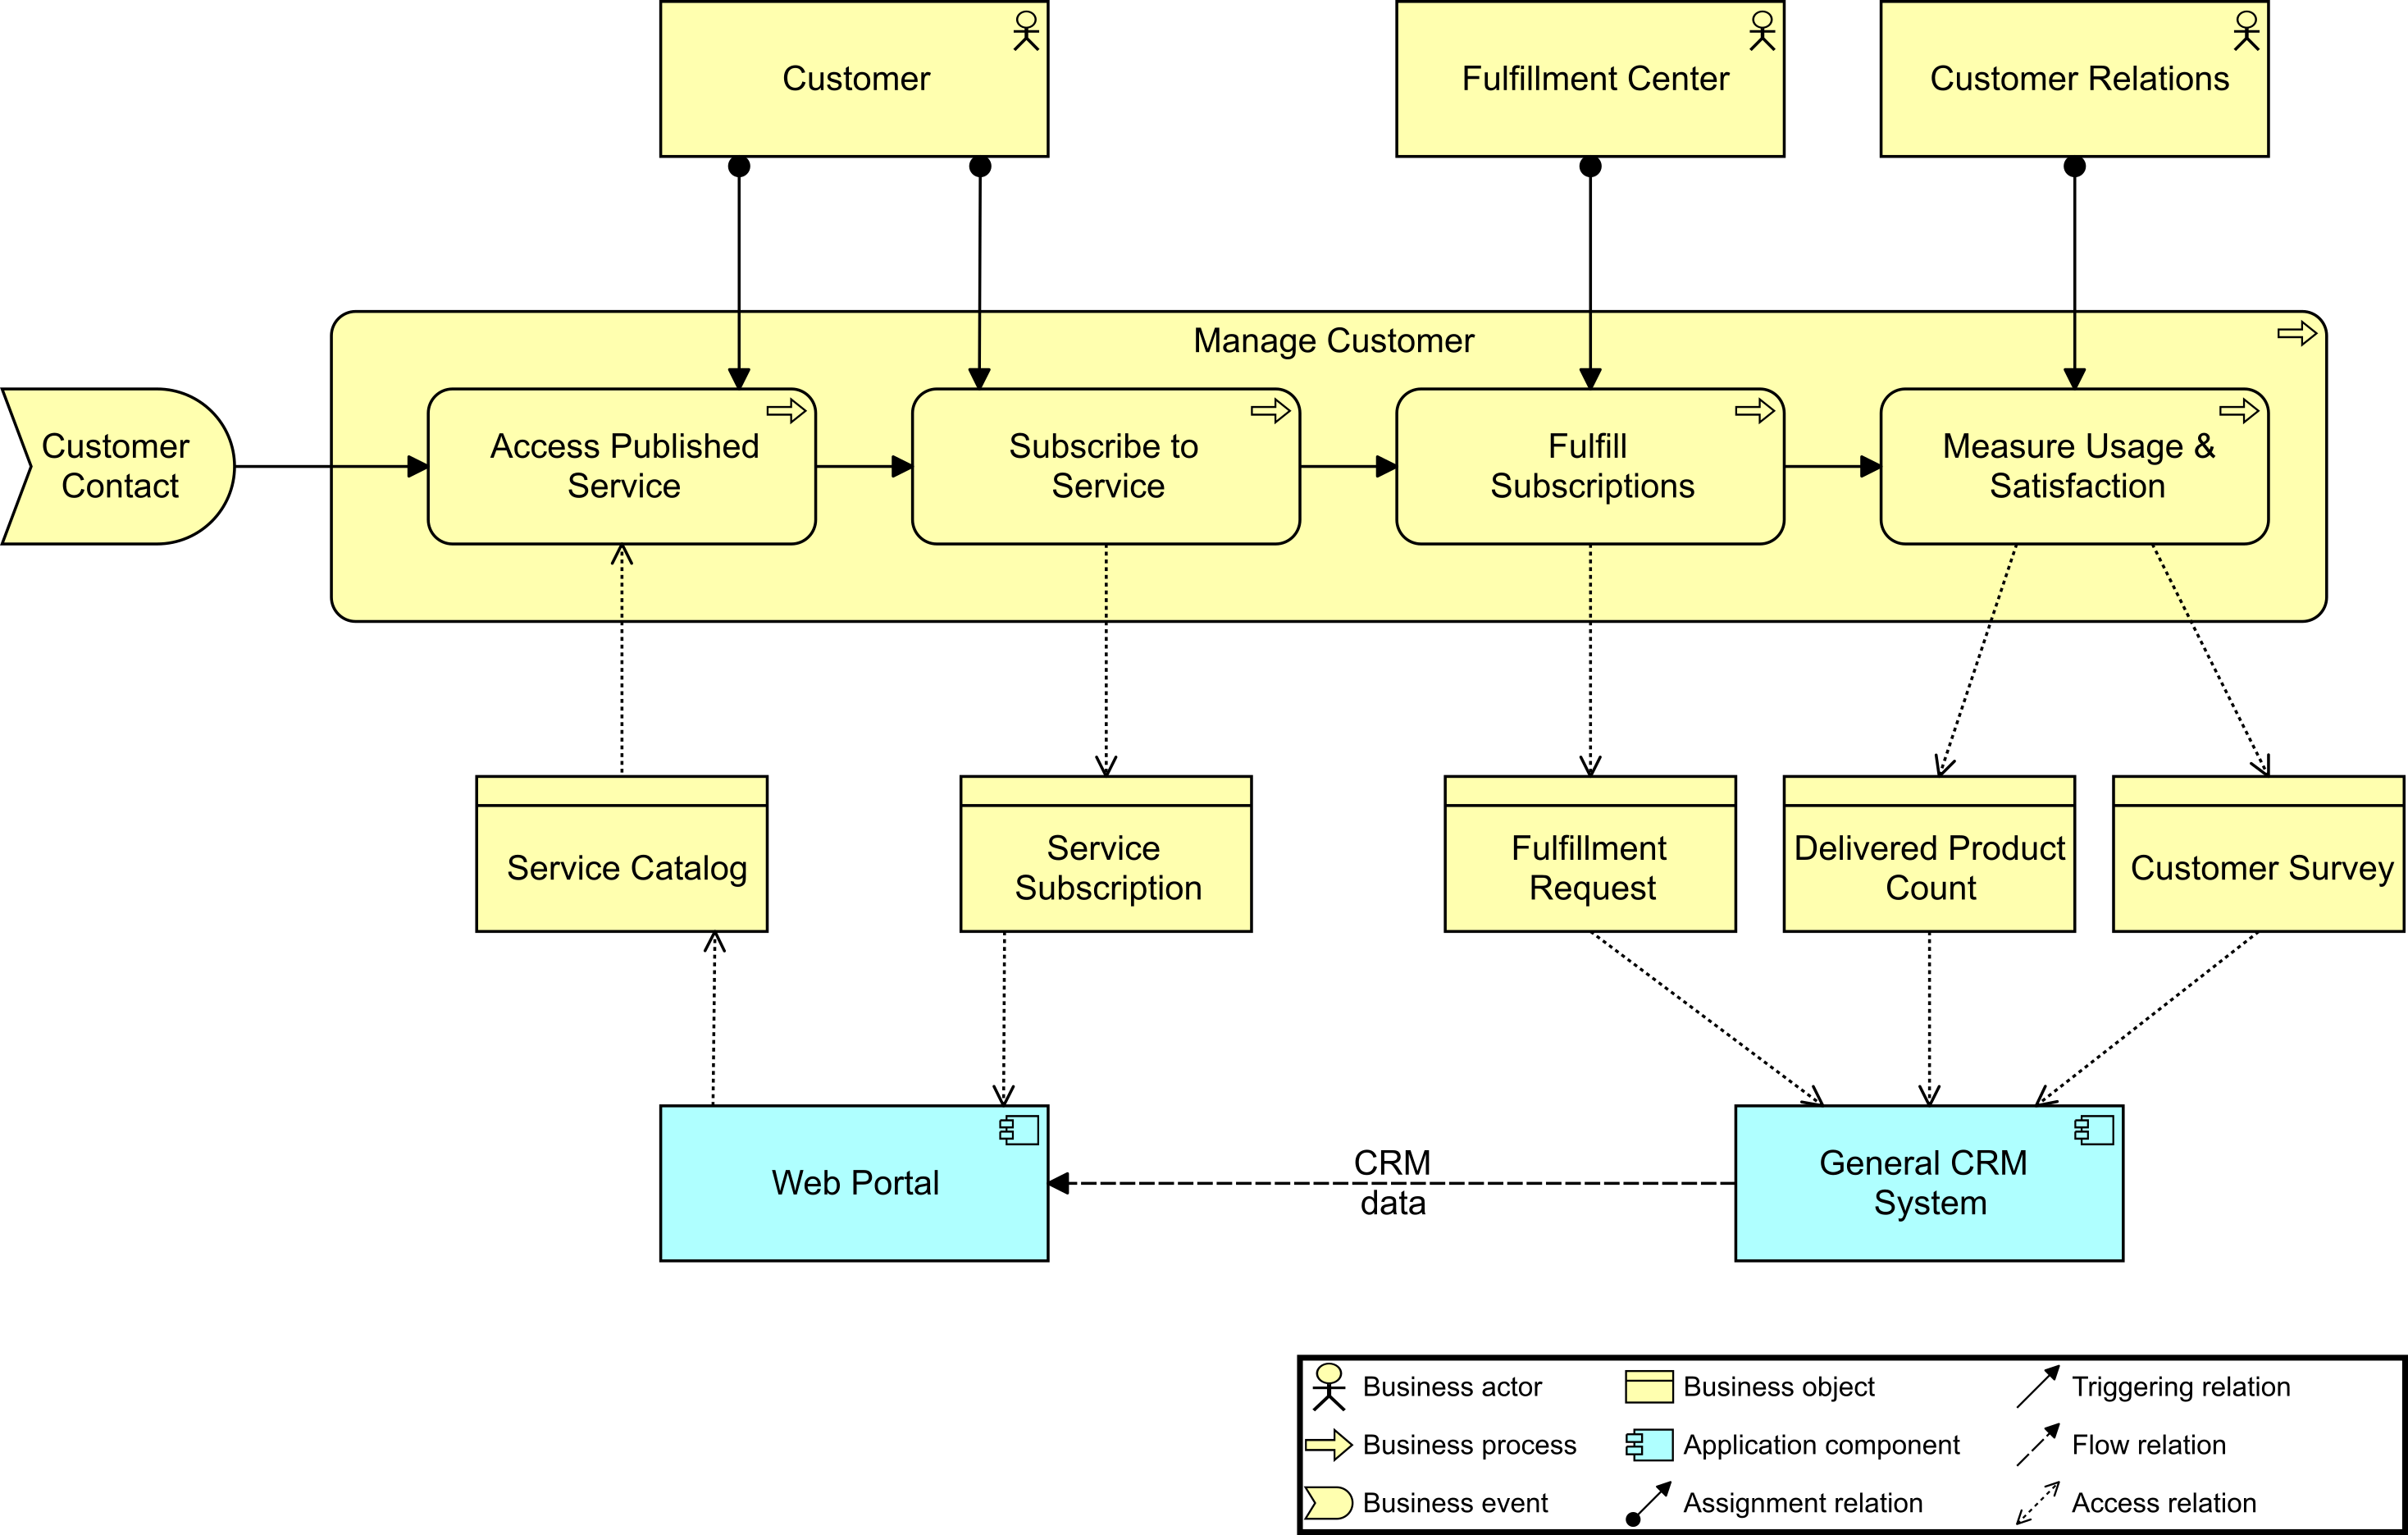
Process Flow for Value Stream Stage shows the primary process flow developed for the “Serve Customers” value stream stage.
PP points out that above the process steps at the top, the assigned roles or functional groups are shown. A customer contact is the trigger for the “Manage Customer” process.
And just below the process steps are the data objects that are realized by the systems below them.
PP describes how working with the stakeholders, the following assessments, which tie back to the two original assessments, have been made:
-
Redundant CRM systems
-
Product fulfillment is slow
-
Too many manual processes
PP explains that the earlier, top-level assessment (Business Strategy) was that there are inefficiencies with internal operations, which ties well to our redundant CRM systems. They will need to be reduced to meet the requirement that was identified for a centralized CRM system. Another top-level assessment was that customers are defecting to competitors who have a superior digital experience. The reasons for this were evident in the most recent customer survey which revealed a large number of dissatisfied customers because of slow product fulfillment and the fact that we still have a lot of manual processes. Many of the surveyed customers said they wanted more self-service so they could resolve their issues. They disliked having to call into a service center only to be routed around trying to find the right person to help.
PP has asked cloud expert CH to take a look at these stakeholder assessments.
CH is confident that we can resolve these threats and weaknesses with a cloud solution that will help us automate the manual processes and increase fulfillment cycle time. The cloud solution can also serve as a portal to our customers as we begin to consolidate CRM systems on the backend.
TN asks if there were any questions on their team presentation on the “Serve Customer” value stream stage definition.
GM says he has no questions but really likes the way PP and TN defined the “Manage Customer” process and the way they linked assessments to our earlier higher-level assessments.
GM also expressed how impressed he was with the techniques they found in The Open Group TOGAF® Series Guides, which the whole team can use in architecture engagements going forward.
NR asks if the team is agreeable to standardizing how we model our baseline and target states for each value stream stage in the way TN and PP have shown, as it really shows the connections between the process, roles, information, and tools.
KS concludes by telling everyone their work is fantastic. She says she’d been nervous at the start, but is now confident that with this material she can present the company vision and the architecture intent in the all-hands call next week.
KS gives a heads up that she is going to schedule a working meeting for the team to update the roadmap to capture all the work done so far and get the high-level opportunities plotted and reviewed at our next stakeholder meeting.
NR says that is an excellent idea. He says that the team has been researching ways of displaying the roadmap and that they have some ideas already sketched out that can be brought to the table to give the stakeholders a timeline that shows the architecture transitions with a view to getting some commitments and setting some target dates.