16. Lean Value Stream Mapping
The value stream is one of the most popular Lean concepts. The term “Lean” was coined in 1988 by John Krafcik in an article that compared the Toyota Production System with North American and European automotive plants: Triumph of the Lean Production System [Krafcik 1988].
John Krafcik observed that “plants operating with a “Lean” production policy are able to manufacture a wide range of models, yet maintain high levels of quality and productivity”. Lean relies on a true grassroots involvement with all aspects of the operation at the workforce level.
Lean is often defined as a system that delivers the most value from a customer perspective, while consuming the fewest resources. Although true, this is a reductionist view of Lean.
Steven Spear and Kent Bowen believe observers of the Toyota Production System confuse the tools and practices they see with the system itself [Spear 1999]. Toyota creates a community of scientists at all levels of the organization. It uses “a rigorous problem-solving process that requires a detailed assessment of the current state of affairs and a plan for improvement that is, in effect, an experimental test of the proposed changes”.
16.1. From Process to Value Stream
James Martin observes that “a value stream is often referred to as a process” [Martin 1995]. Unfortunately, the word process is used in many ways by different professionals; for example, systems analysts would call accounts receivable a process. “Accounts receivable is not a value stream; it is not an end-to-end stream of activities designed to satisfy a customer.”
This section describes the evolution of the process and value stream concepts. It will describe them in detail.
16.1.1. Visualizing Processes
In 1921, Frank and Lillian Gilbreth made a presentation at the annual meeting of the American Society of Mechanical Engineers. This was entitled Process Charts: First Steps in Finding the One Best Way to Do Work. The Gilbreths introduced their notation to visualize processes in order to improve them.
The main objective is to help people in the organization discover the one best way to do work. Noting that every detail of the process can be affected by other details, they argue that it is necessary to visually represent the process as a whole before changing parts of it.
They point out that a local change that does not take into consideration all upstream and downstream operations could pose operational problems during implementation. It is interesting to note that three concepts still relevant today were formalized so early:
-
The process represents a whole; not just the sum of its constituent parts
-
The visual representation of the process makes it easier to communicate and build consensus on how it works
-
The standardization of symbols contributes to the dissemination of best practices; the standard having been published in 1947 by the American Society of Mechanical Engineers
The Gilbreths formalized a three-step process improvement method [Gilbreth 1921]:
-
Discover and classify best practices
-
Deduce laws (or rules)
-
Apply them to standardize practices
To justify their method, the Gilbreths refer to the calamitous losses that result from wastage due to useless movements and gestures. They observe that work-related fatigue is one of the greatest wastes.
16.1.2. Value-Driven
Deming, Juran, and Ishikawa [Ishikawa 1985], three key thinkers in total quality, argue that knowing what customers want is essential to providing quality products or services. Explicitly identifying and measuring customer requirements is the starting point of a quality approach. Ishikawa points out that collecting and analyzing customer requirements is a lever in developing cross-functional cooperation.
Customer requirements help focus on those parts of the process that have the greatest impact on customer satisfaction. The quality of products and services depends mainly on the quality of the processes used to design and produce them. Management must therefore train and coach employees in the evaluation, analysis, and improvement of processes.
In a book published in 1991 [Harrington 1991], James Harrington defines the efficiency of the process as its ability to meet customer requirements. For the author, there is no product or service without process and, reciprocally, there is no process without product or service. Customer requirements are a necessary input, but are not sufficient. James Harrington’s definition of value has three shortcomings:
-
It is independent of costs incurred
-
It does not include all stakeholders
-
It reduces value to meeting requirements
This document promotes in Section 4.2.3 a value-driven approach that borrows from several disciplines, including Value Engineering. It is aligned with Lean Enterprise, which defines value as [Murman 2002]:
Value stream mapping is driven by a definition of value that includes all stakeholders.
16.1.3. Value Stream Mapping
Toyota uses a visual representation of production processes; Material and Information Flow Diagrams (MIFDs), the “ancestor” of value stream mapping.
In 1995, James Martin defined a value stream as “the end-to-end set of activities that delivers particular results for a given customer (external or internal)” [Martin 1995].
In their book, Lean Thinking [Womack 1996], Jim Womack and Dan Jones use the term value stream. Value stream mapping as a term became popular when Mike Rother and John Shook published Learning to See [Rother 2003]. The term value stream mapping has since been borrowed by other disciplines, including Agile, DevOps, and Enterprise Architecture. The focus on applying value stream mapping as a tool without understanding the whole Lean system at best does not create value; at worst, it creates waste.
"Value stream mapping is not a solution to a problem, but a tool to help us see." (Jeffrey K. Liker, 2017, The Toyota Way to Service Excellence)
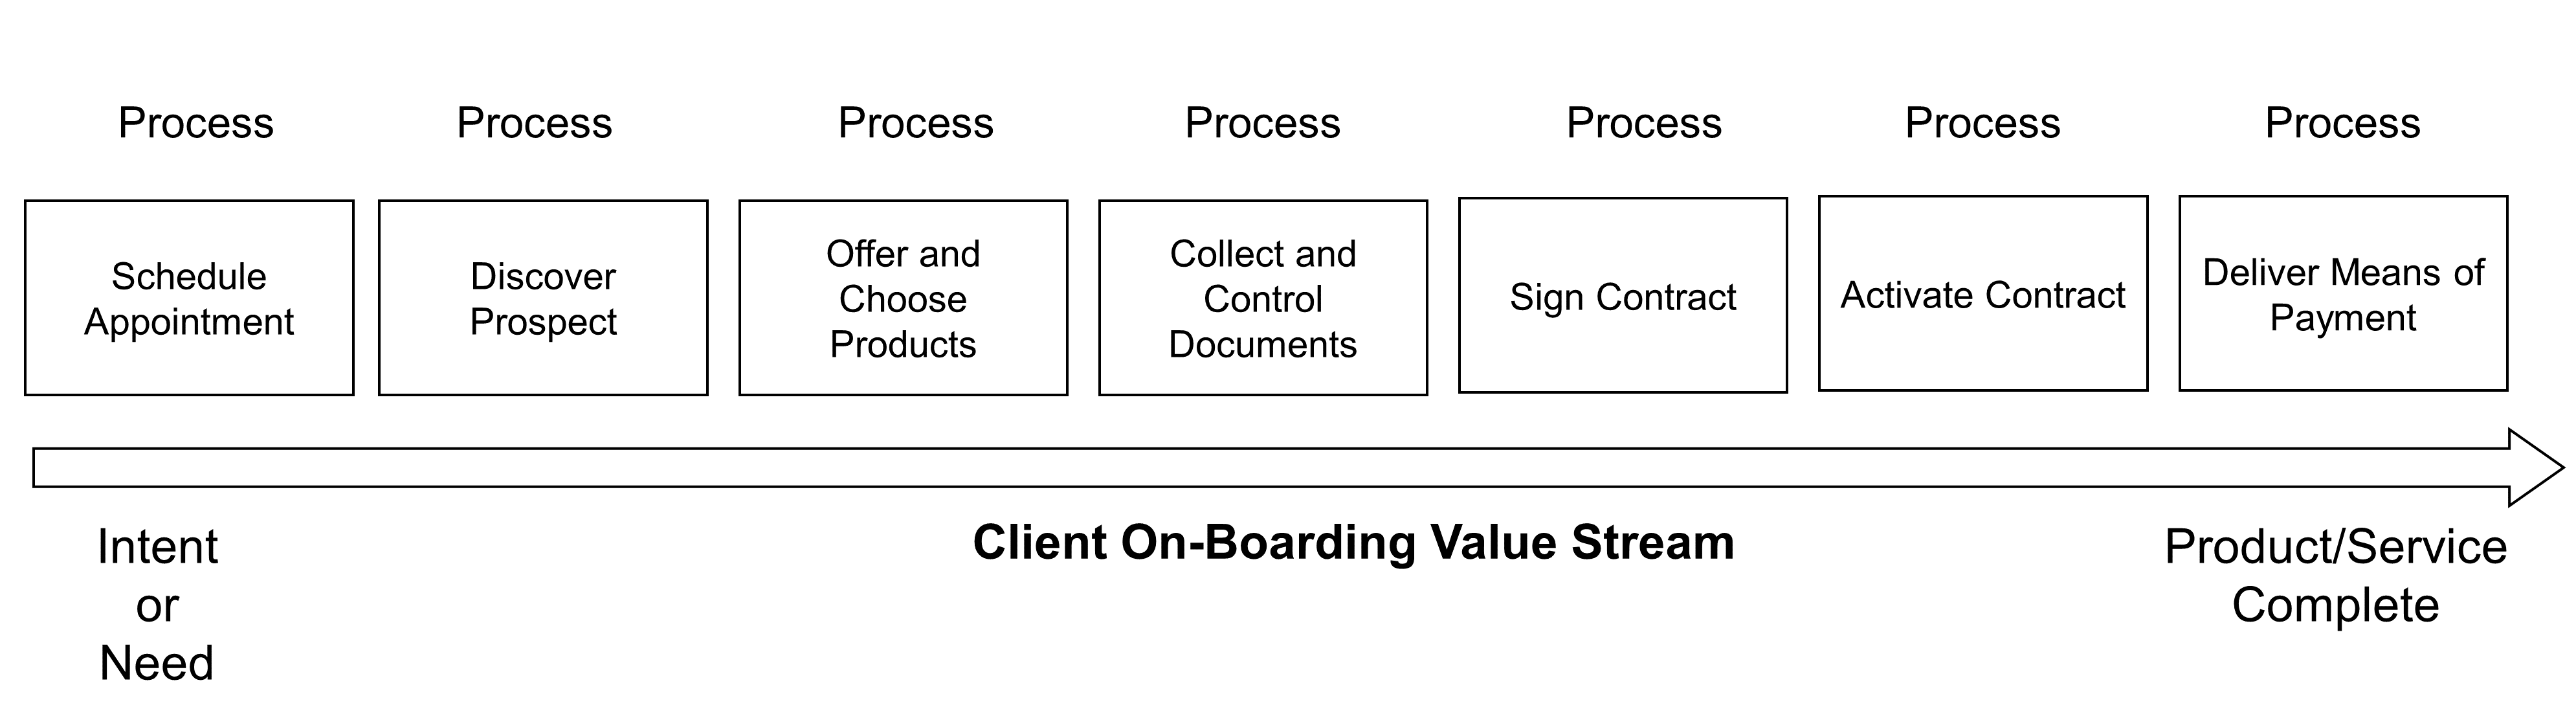
To illustrate value stream mapping, lets consider the example of an individual in need of banking services, and map an end-to-end value stream, for client on boarding; see Figure 36.
16.1.4. Granularity Level
One of the first value stream architecture decisions is to determine at which level of granularity client on-boarding should be mapped.
Mapping a generic value stream that works for all on-boarding cases would impose the most complex design onto simple cases, resulting in:
-
Waste, because some activities are not required to handle simple cases
-
Poor customer and employee experience due to wasted time
Who has not been frustrated when a service representative argues that the system or procedure itself prevented them from solving your problem?
On the other hand, mapping a specialized value stream for each client segment, product, or channel is likely to result in many almost identical value stream maps.
An example of classical granularity analysis is illustrated in Figure 37.
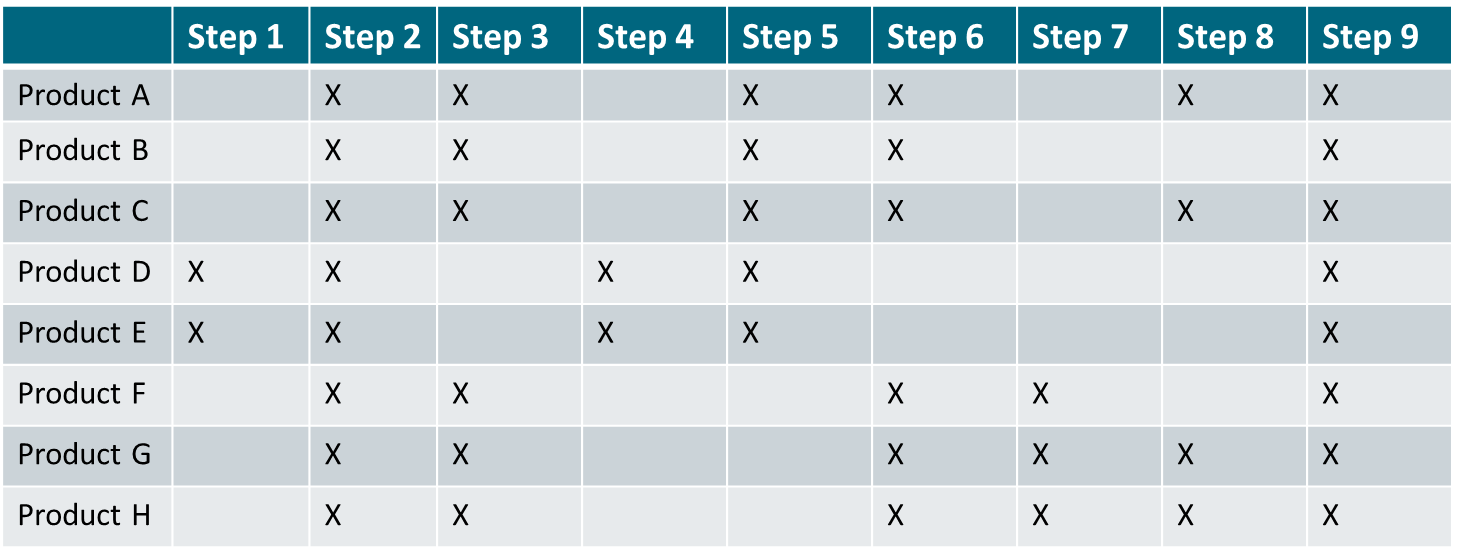
Products which have comparable production steps and use similar equipment are regrouped into product families:
-
Product Family 1 regroups products A, B, and C
-
Product Family 2 regroups products D and E
-
Product Family 3 regroups products F, G, and H
A value stream map is created for each product family.
In a digital world, it is important to include additional factors to determine the appropriate granularity level of value stream maps. Table 3 illustrates the granularity analysis that helped define the client on-boarding value streams.
Criteria |
Simple On-Boarding |
Medium Complexity On-Boarding |
Complex On-Boarding |
Number and Roles of Stakeholders |
Single account holder |
Joint account |
Trustee or agent |
Country of Residence |
France |
European Union |
Other |
Age and Legal Capacity |
Capable adult |
Underage |
Protected adult |
Housing Type |
Tenant or owner |
Hotel, student residence |
In transit |
Revenue Type |
Salary or retirement pension |
Commercial or independent income |
Other |
Needs |
Checking account, credit card, consumer credit |
Mortgage loan, simple investment |
Investment advice |
The scope of the first value stream covers simple client on-boarding. The second value stream addresses medium complex on-boarding situations. The third value stream addresses cases that require more expertise; for example, to set up an account for a protected adult or a foreign diplomat.
16.2. Approach Overview and Key Concepts
Value stream mapping is about applying the scientific method to improve the whole. The value stream improvement steps are:
-
Make the value stream visible (learning to see)
-
Thoroughly understand current conditions, which includes talking to stakeholders and observing what is happening in the field (“Going to the Gemba”)
-
Define “next target” conditions
-
Plan implementation
-
Implement next target conditions
-
Check if the solution works as anticipated
-
Decide what to do next
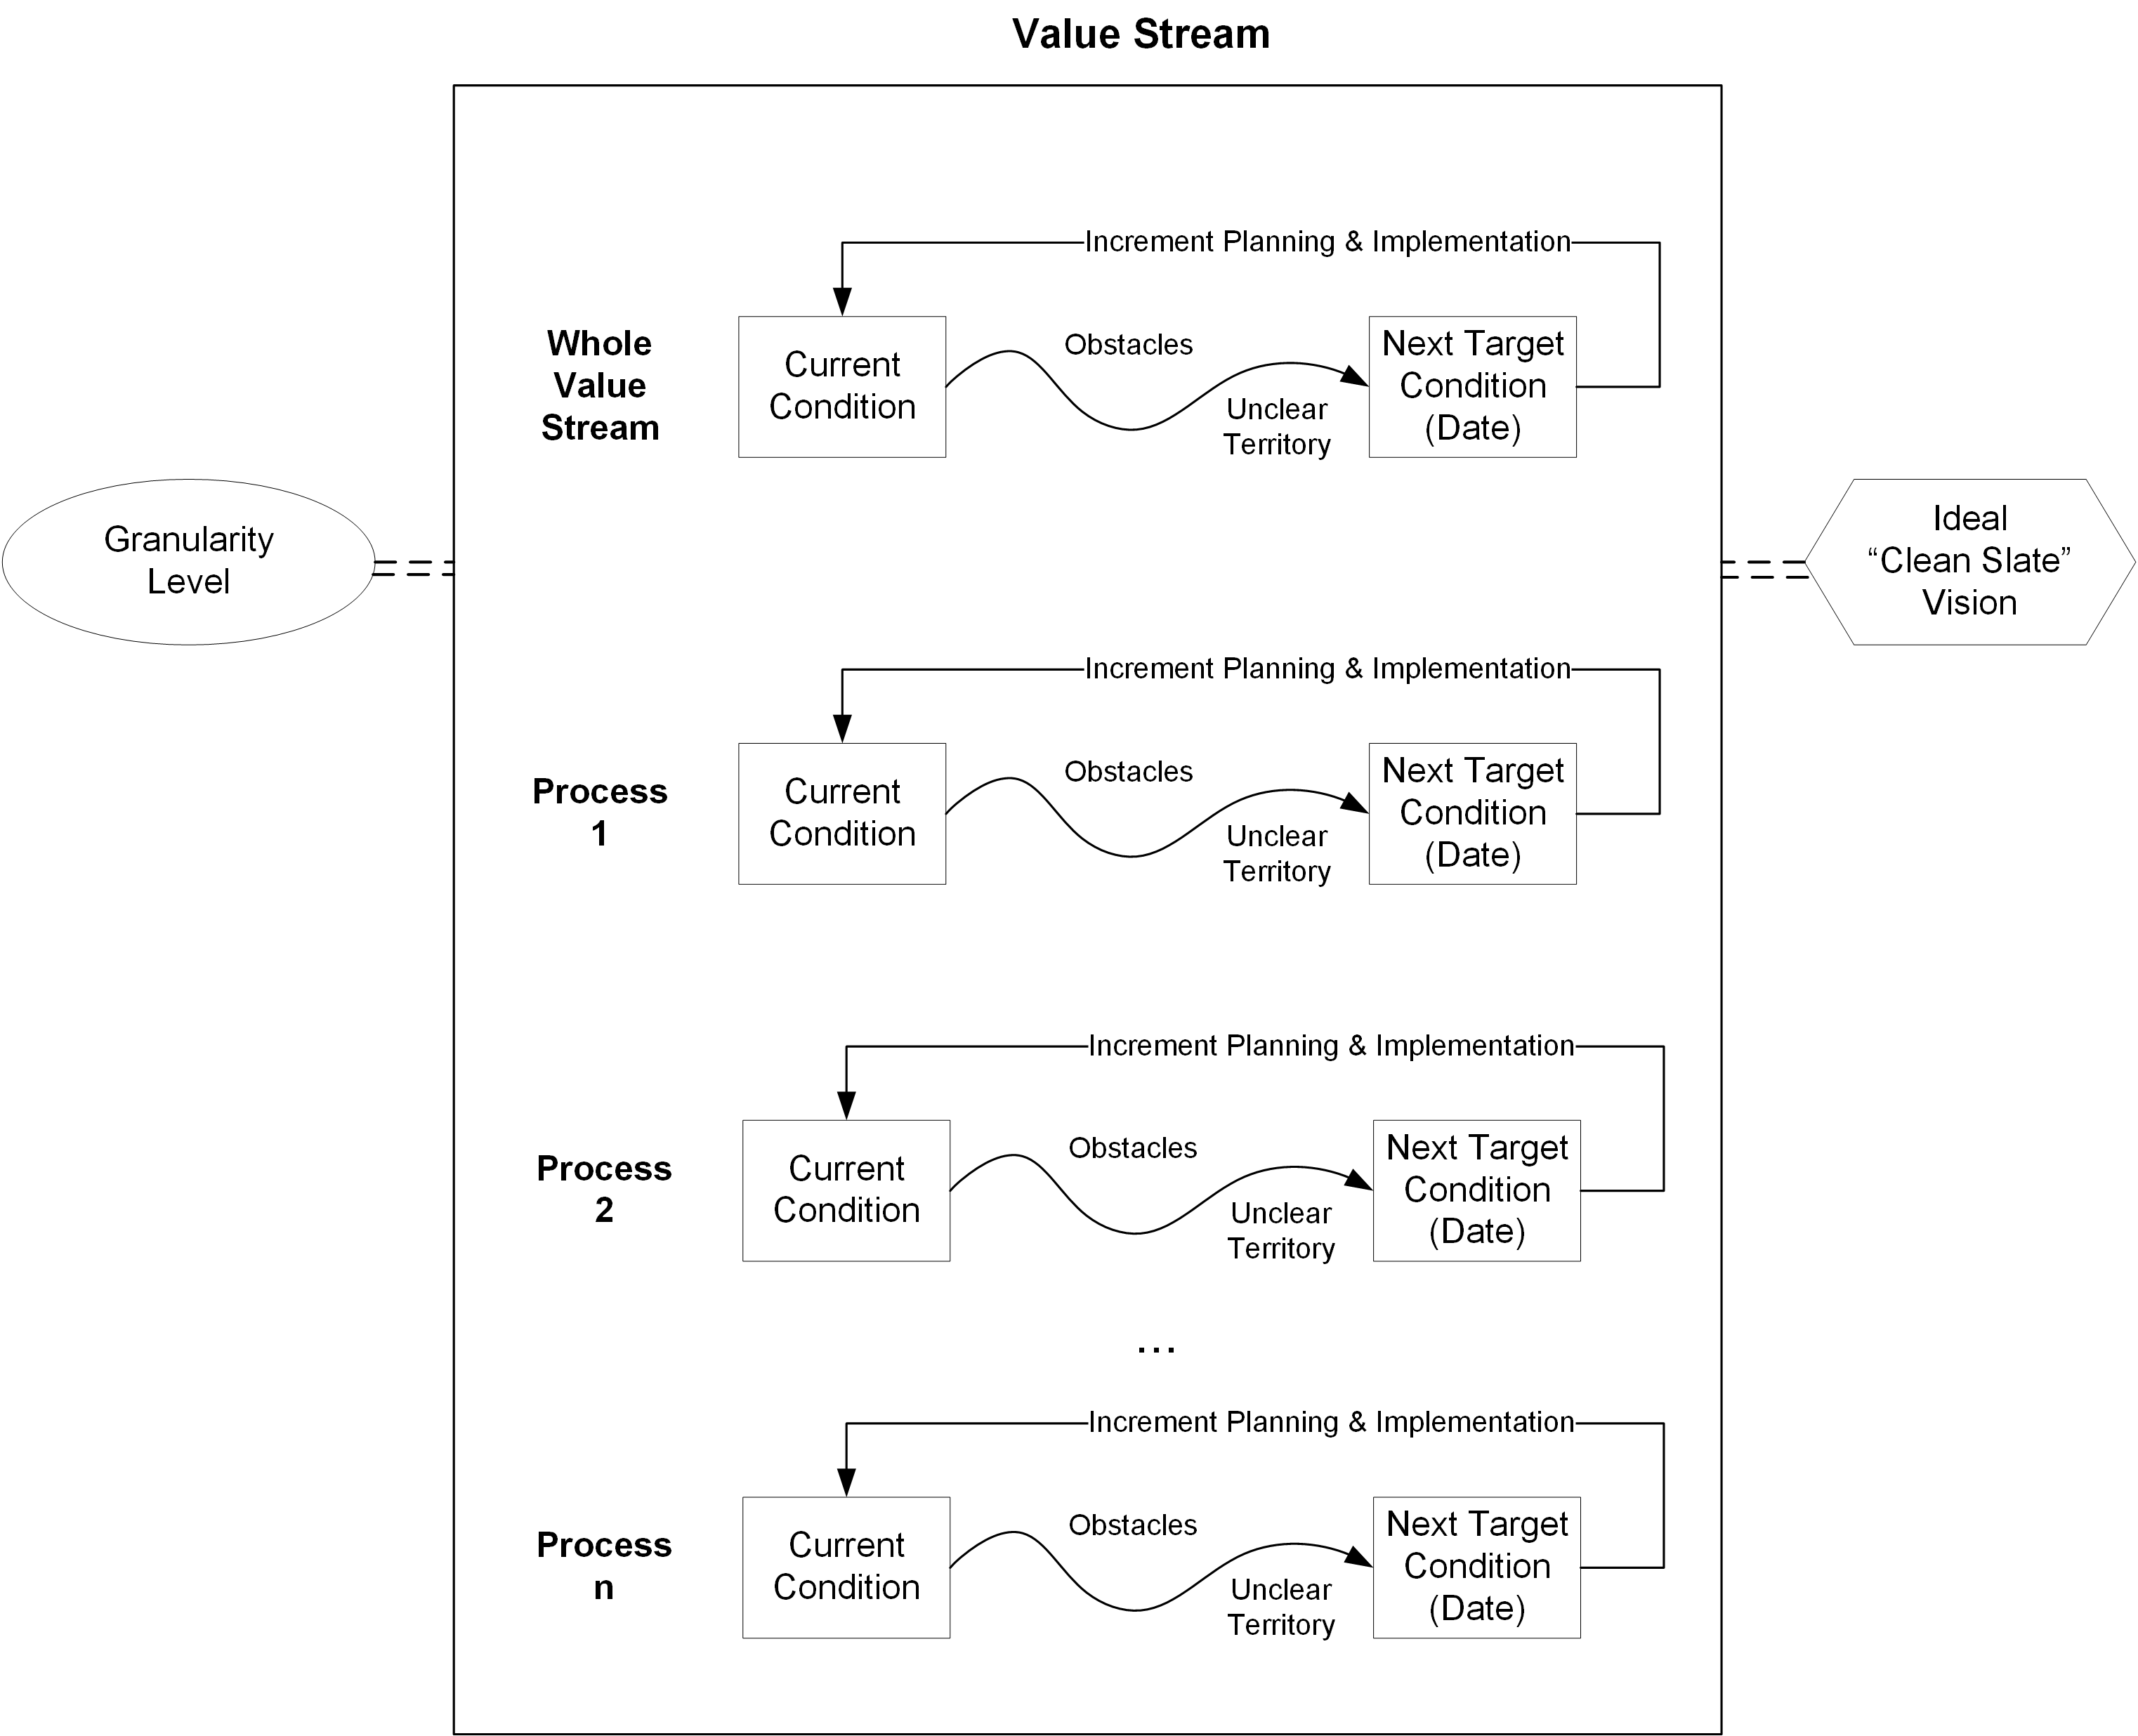
Value stream mapping starts with the whole value stream to initiate an improvement cycle at that level. This helps to identify inter-process dependencies. Equivalent improvement cycles can then be applied to each of the processes that compose the value stream; see Figure 38. In summary, value stream mapping iterates PDCA cycles, and improvement cycles can be conducted concurrently on different parts of the value stream.
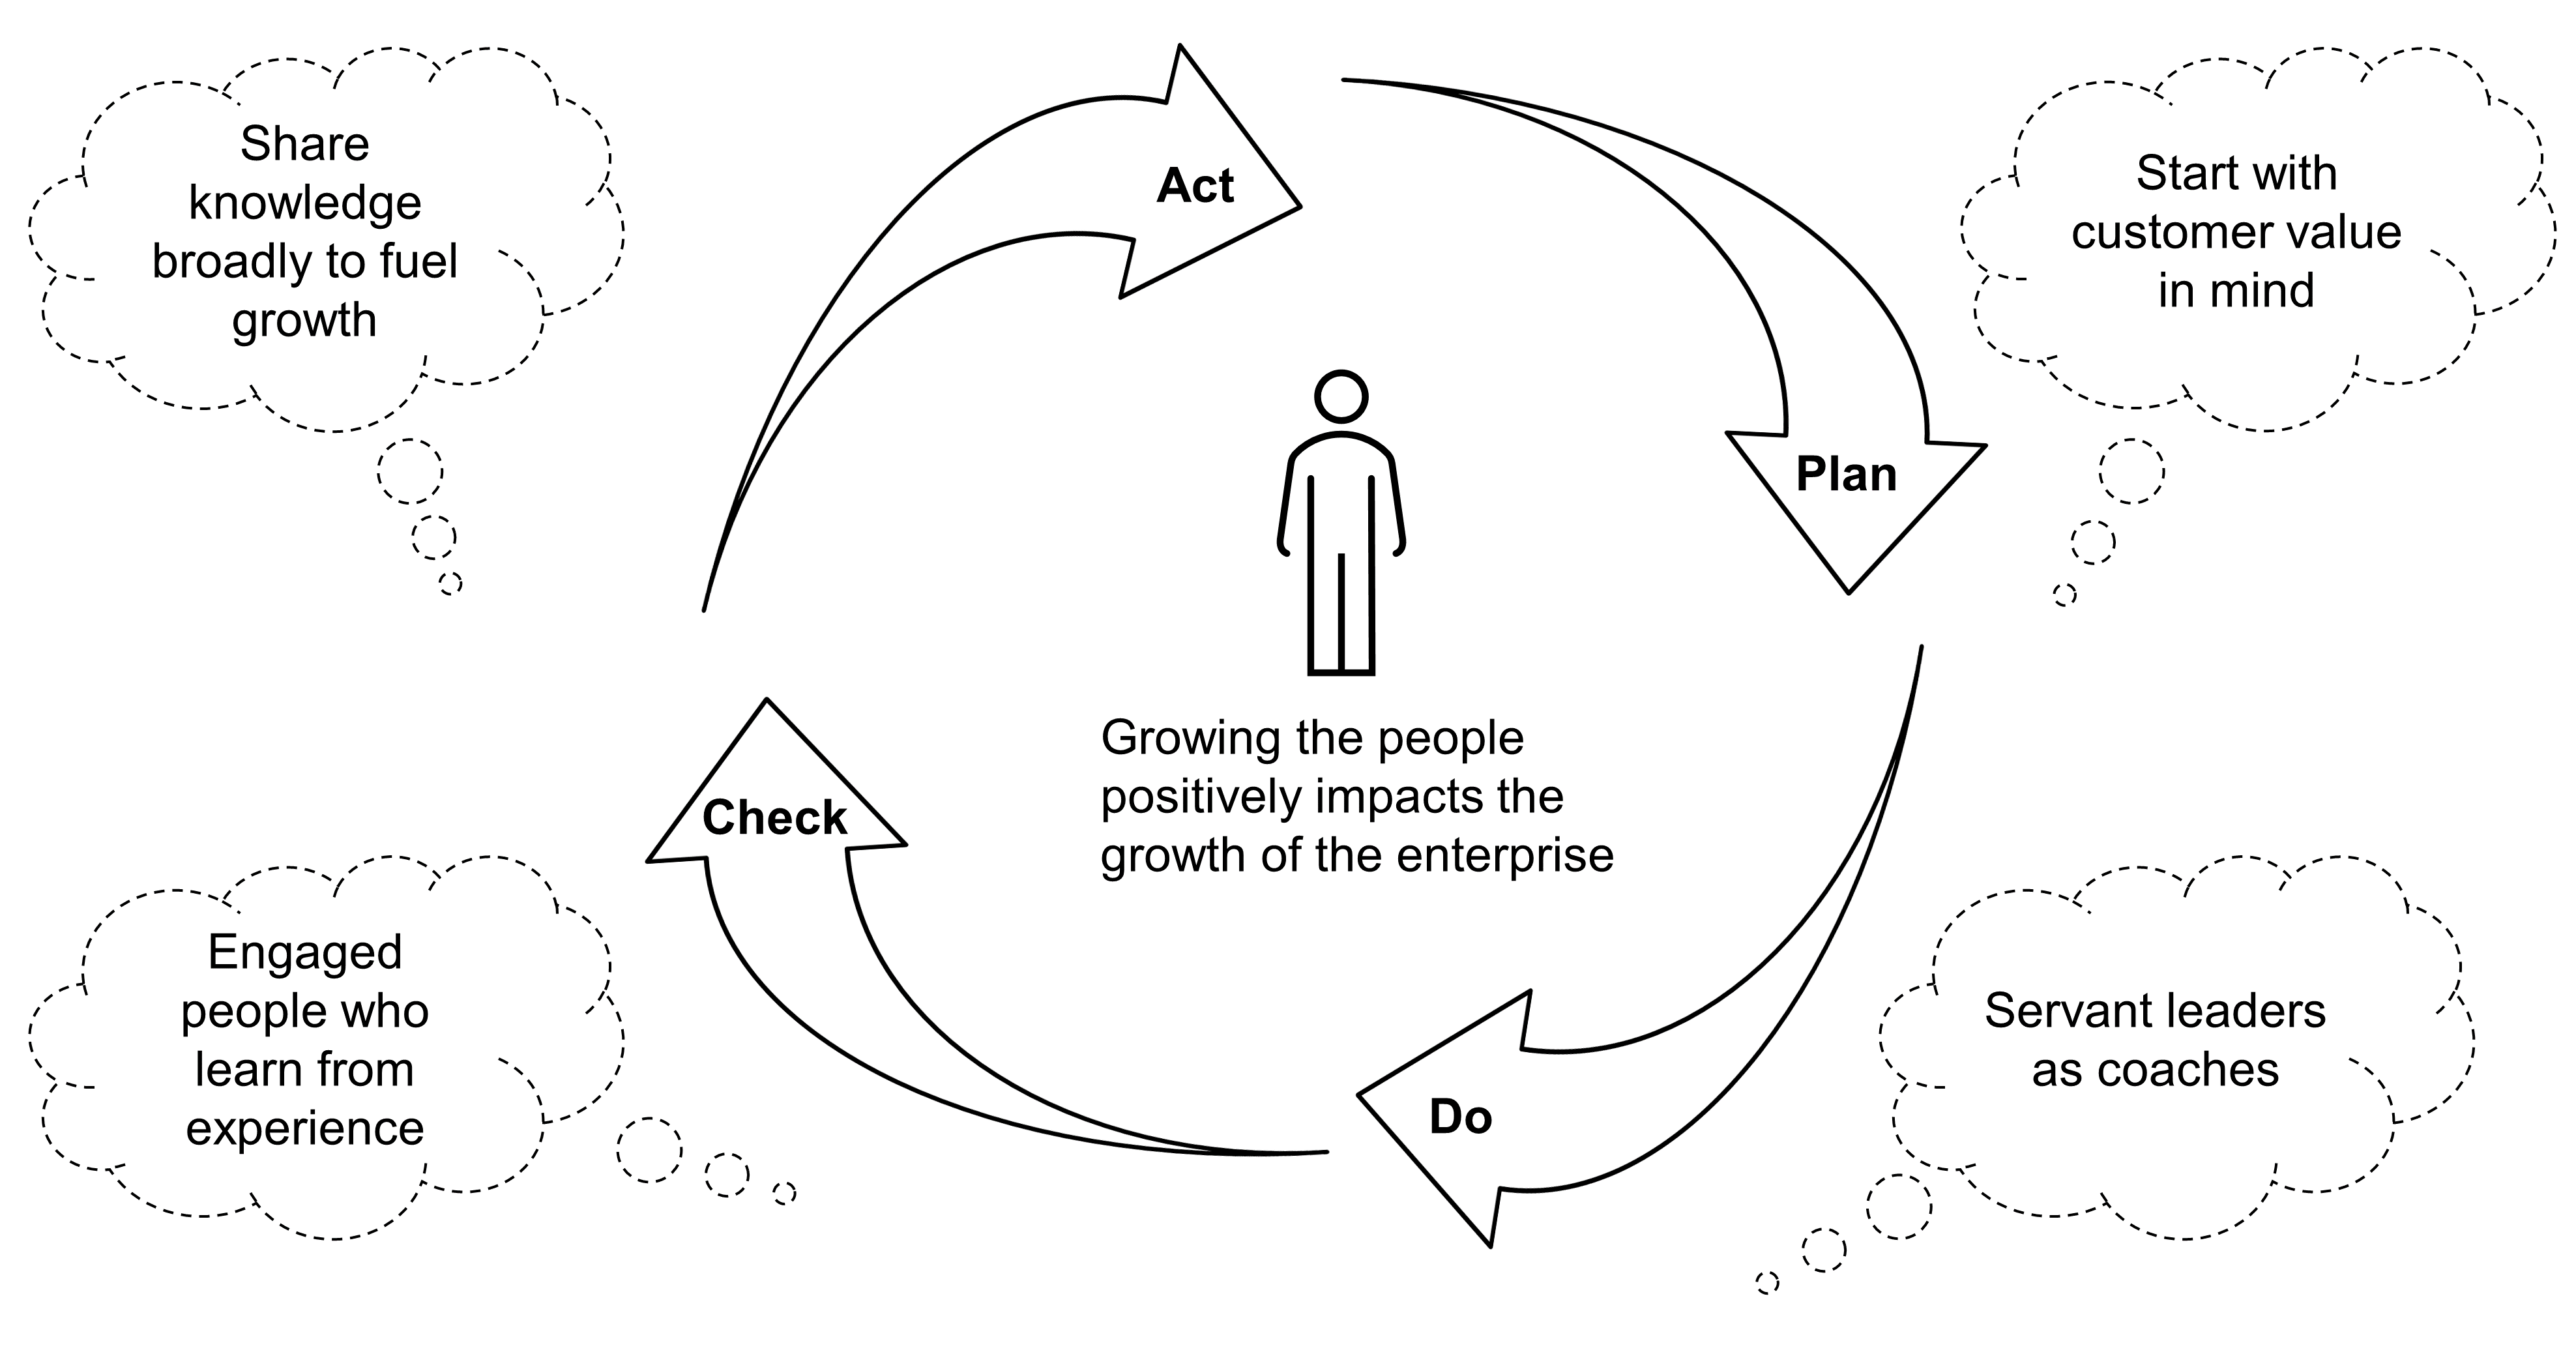
Improvement cycles follow PDCA:
-
Plan: what you intend to do
-
Do: the actual implementation
-
Check: whether or not the implemented solution works
-
Act: the question of what to do next
Figure 39 illustrates this.
This document will now describe the current conditions of client on-boarding.
16.2.1. Current Conditions
Understanding current conditions is about collecting facts. It can be done through research techniques such as client and employee interviews, direct observation, “mystery customers”, or workshops, to name a few.
The cross-functional improvement team has learned:
-
It takes too long to make an appointment
-
Some appointments are postponed due to the lack of availability of client advisors
-
Too many supporting documents are required and sometimes intrusive data requests further degrade client experience
-
Too many flyers and tools make product selection complex
-
Manual controls often result in back-and-forth communication with clients and the back office
-
The process is too slow; the lead time sometimes exceeds seven days
-
Client advisors spend too much time performing administrative tasks
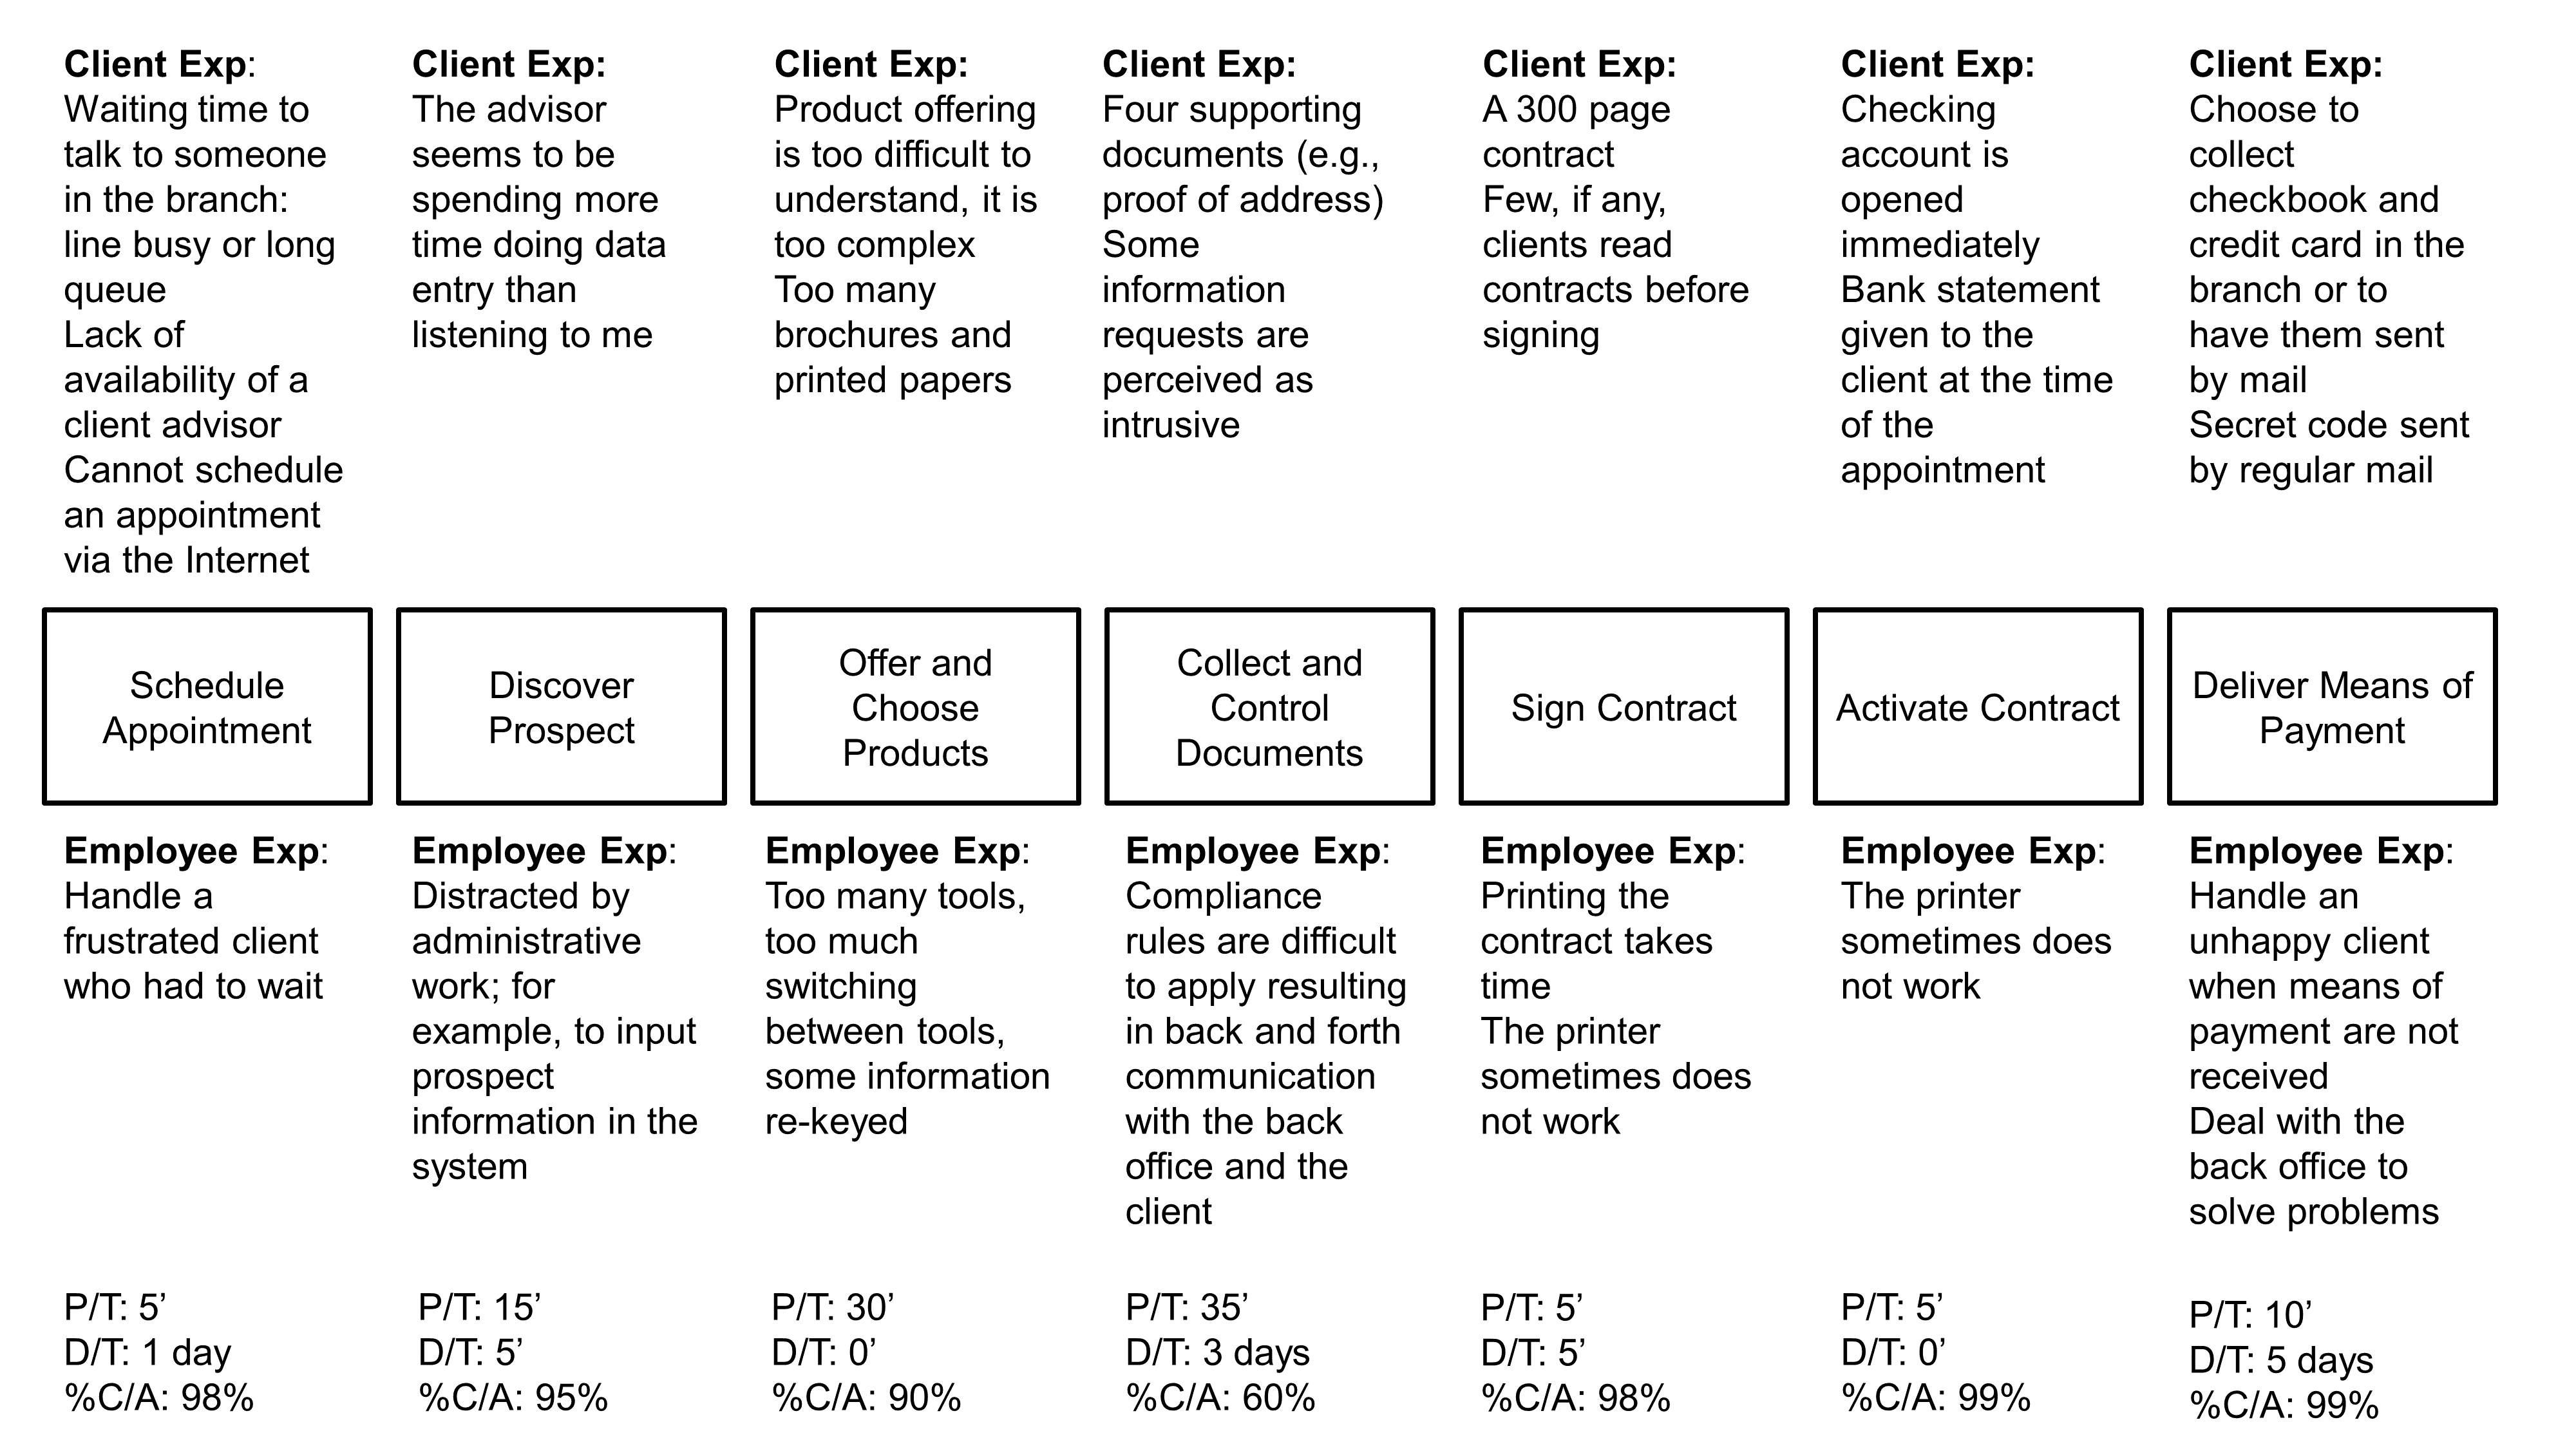
Value stream measures are displayed at the bottom of Figure 40:
-
Process Time (P/T) is the time spent performing the work of the process
-
Delay Time (D/T ) is the time spent waiting during a process or between processes
-
Percentage Complete & Accurate (%C/A) measures quality
The diagram shows that the total P/T is 105 minutes. P/T during the customer meeting is 90 minutes, the sum of time from “Discover Prospect” to “Activate Contract”. Lead Time (L/T) is the sum of P/T plus D/T from the client intent to the delivery of the means of payment. L/T can reach nine days. This is mostly due to:
-
D/T and rework time due to missing or incorrect supporting documents
-
D/T to print the credit card and send it to the branch or the client
Other measures can be collected; for example:
-
Changeover (C/O) time to switch from producing one product type to another; especially useful in a manufacturing environment
-
Value-Added (VA) time, which is P/T that produces value for which customers are willing to pay
The equation VA < P/T < L/T is usually verified.
16.2.2. Ideal “Clean-Slate” Vision
Capable adults represent 69% of all new client on-boarding. 60% of these are capable and resident adults who need a checking account and a credit card. 26% of them are looking for a mortgage loan. The ideal “clean-slate” vision focuses first on creating a streamlined and enjoyable on-boarding experience for the simple on-boarding value stream.
The ambition is to:
-
Open an account and get a credit card without an appointment
-
Reduce the administrative time required to 10 minutes
-
Provide the minimum set of products that is needed during a first appointment
-
Enable an omnichannel model
-
Create a set of applications and apps that are highly usable for both clients and advisors
-
Offer full digital contracting and signature
-
Dramatically raise the automation level, especially to verify the authenticity of identity documents as well as supporting documents
-
Instant issuance and activation of credit cards
The ideal scenario is described below:
-
I come to the branch without an appointment to open a checking account and get a credit card. While I am waiting for the advisor, I discover the bank’s range of products.
-
The advisor welcomes me and checks the time I have available. The advisor spends five minutes actively listening and asks some essential questions to understand my needs.
-
Using a tablet, the advisor takes a picture of my identity card plus my proof of address.
-
The system uses optical character recognition to pre-fill an electronic form that I verify and complete as needed.
-
In the background, the authenticity of my documents is verified.
-
I sign my contract using the advisor’s tablet.
-
I immediately receive a text message with a link to install the bank’s app.
-
My credit card is printed and activated.
-
I receive a secret code on my smartphone.
-
I can use the branch’s ATM to deposit cash.
-
Before I leave, the advisor books a second appointment to continue to discuss my needs.
-
If I am missing a document, I can take a picture of it at home, which activates my account.
-
I can choose to return to the branch to get my credit card or get it sent home.
-
I can access my bank statement and other banking services using my banking app or a browser.
16.2.3. Waste
Waste is anything other than the minimum amount of resources that add value to a product, including the information customers need. Waste is also referred to as “Muda”. Waste can be classified as Type 1 or Type 2 Muda:
-
Type 1 Muda: activities which create no value but are currently necessary to maintain operations; for example, to meet regulatory requirements
-
Type 2 Muda: create no value for any stakeholders, including customers, employees, or regulatory bodies
VA time can be measured. It is P/T that produces value. The efficiency of a value stream or process is calculated by dividing the VA time by the L/T.
Taiichi Ohno and Norman Bodek [Ohno 1988] have identified seven types of waste:
-
Overproduction is producing too much, too early, or just in case; overproduction gets in the way of a smooth flow of goods and services, and causes excessive L/T
-
Waiting is the enemy of smooth flow, as waiting directly impacts L/T; a short L/T can be a source of competitive advantage, while a long L/T causes customer frustration
-
Unnecessary motion results from poor workplace arrangement and ergonomics
-
Transportation is movement that does not create value; for example, sharing important data and files via email rather than hosting data in some shared repository
-
Over processing is adding more value to a product than customers require
-
Inventory is storing products or work products that are needed for future use or not needed at all
-
Defects which cost money both immediately and later
Other waste typologies have been developed; for example, Allen Ward and Durward Sobek identify three primary categories of knowledge waste [Ward 2014]:
-
Scatter is about actions that make knowledge ineffective by disrupting its flow and affecting the subtle interactions required for teamwork; for example, adding more developers to a team usually slows things down because increasing team size increases the number of interactions within the team
-
Hand-off occurs whenever knowledge, responsibility, action, and feedback are separated, which causes defects and demotivates team members who cannot relate to their work in a meaningful way
-
Wishful thinking is making decisions without data or operating blindly; for example, testing to specifications, which leaves products vulnerable to problems too infrequent for the specifications to catch
A word of caution – do not go out and look for waste guided only by some waste taxonomy; doing so would be wasteful. Instead, be guided by value as defined by the client and keep in mind the purpose of the system. Identify what specifically prevents the value stream from reaching its ideal state. Waste typologies are just an aid to identify symptoms that are likely to reveal deeper problems.
Muda points to underlying problems at the value stream level or at the process level. Analyzing what causes waste helps identify countermeasures that have the potential to improve the overall system performance. Value stream mapping is misused when it becomes a cost-cutting tool (attacking symptoms), rather than solving the underlying problems that cause waste.
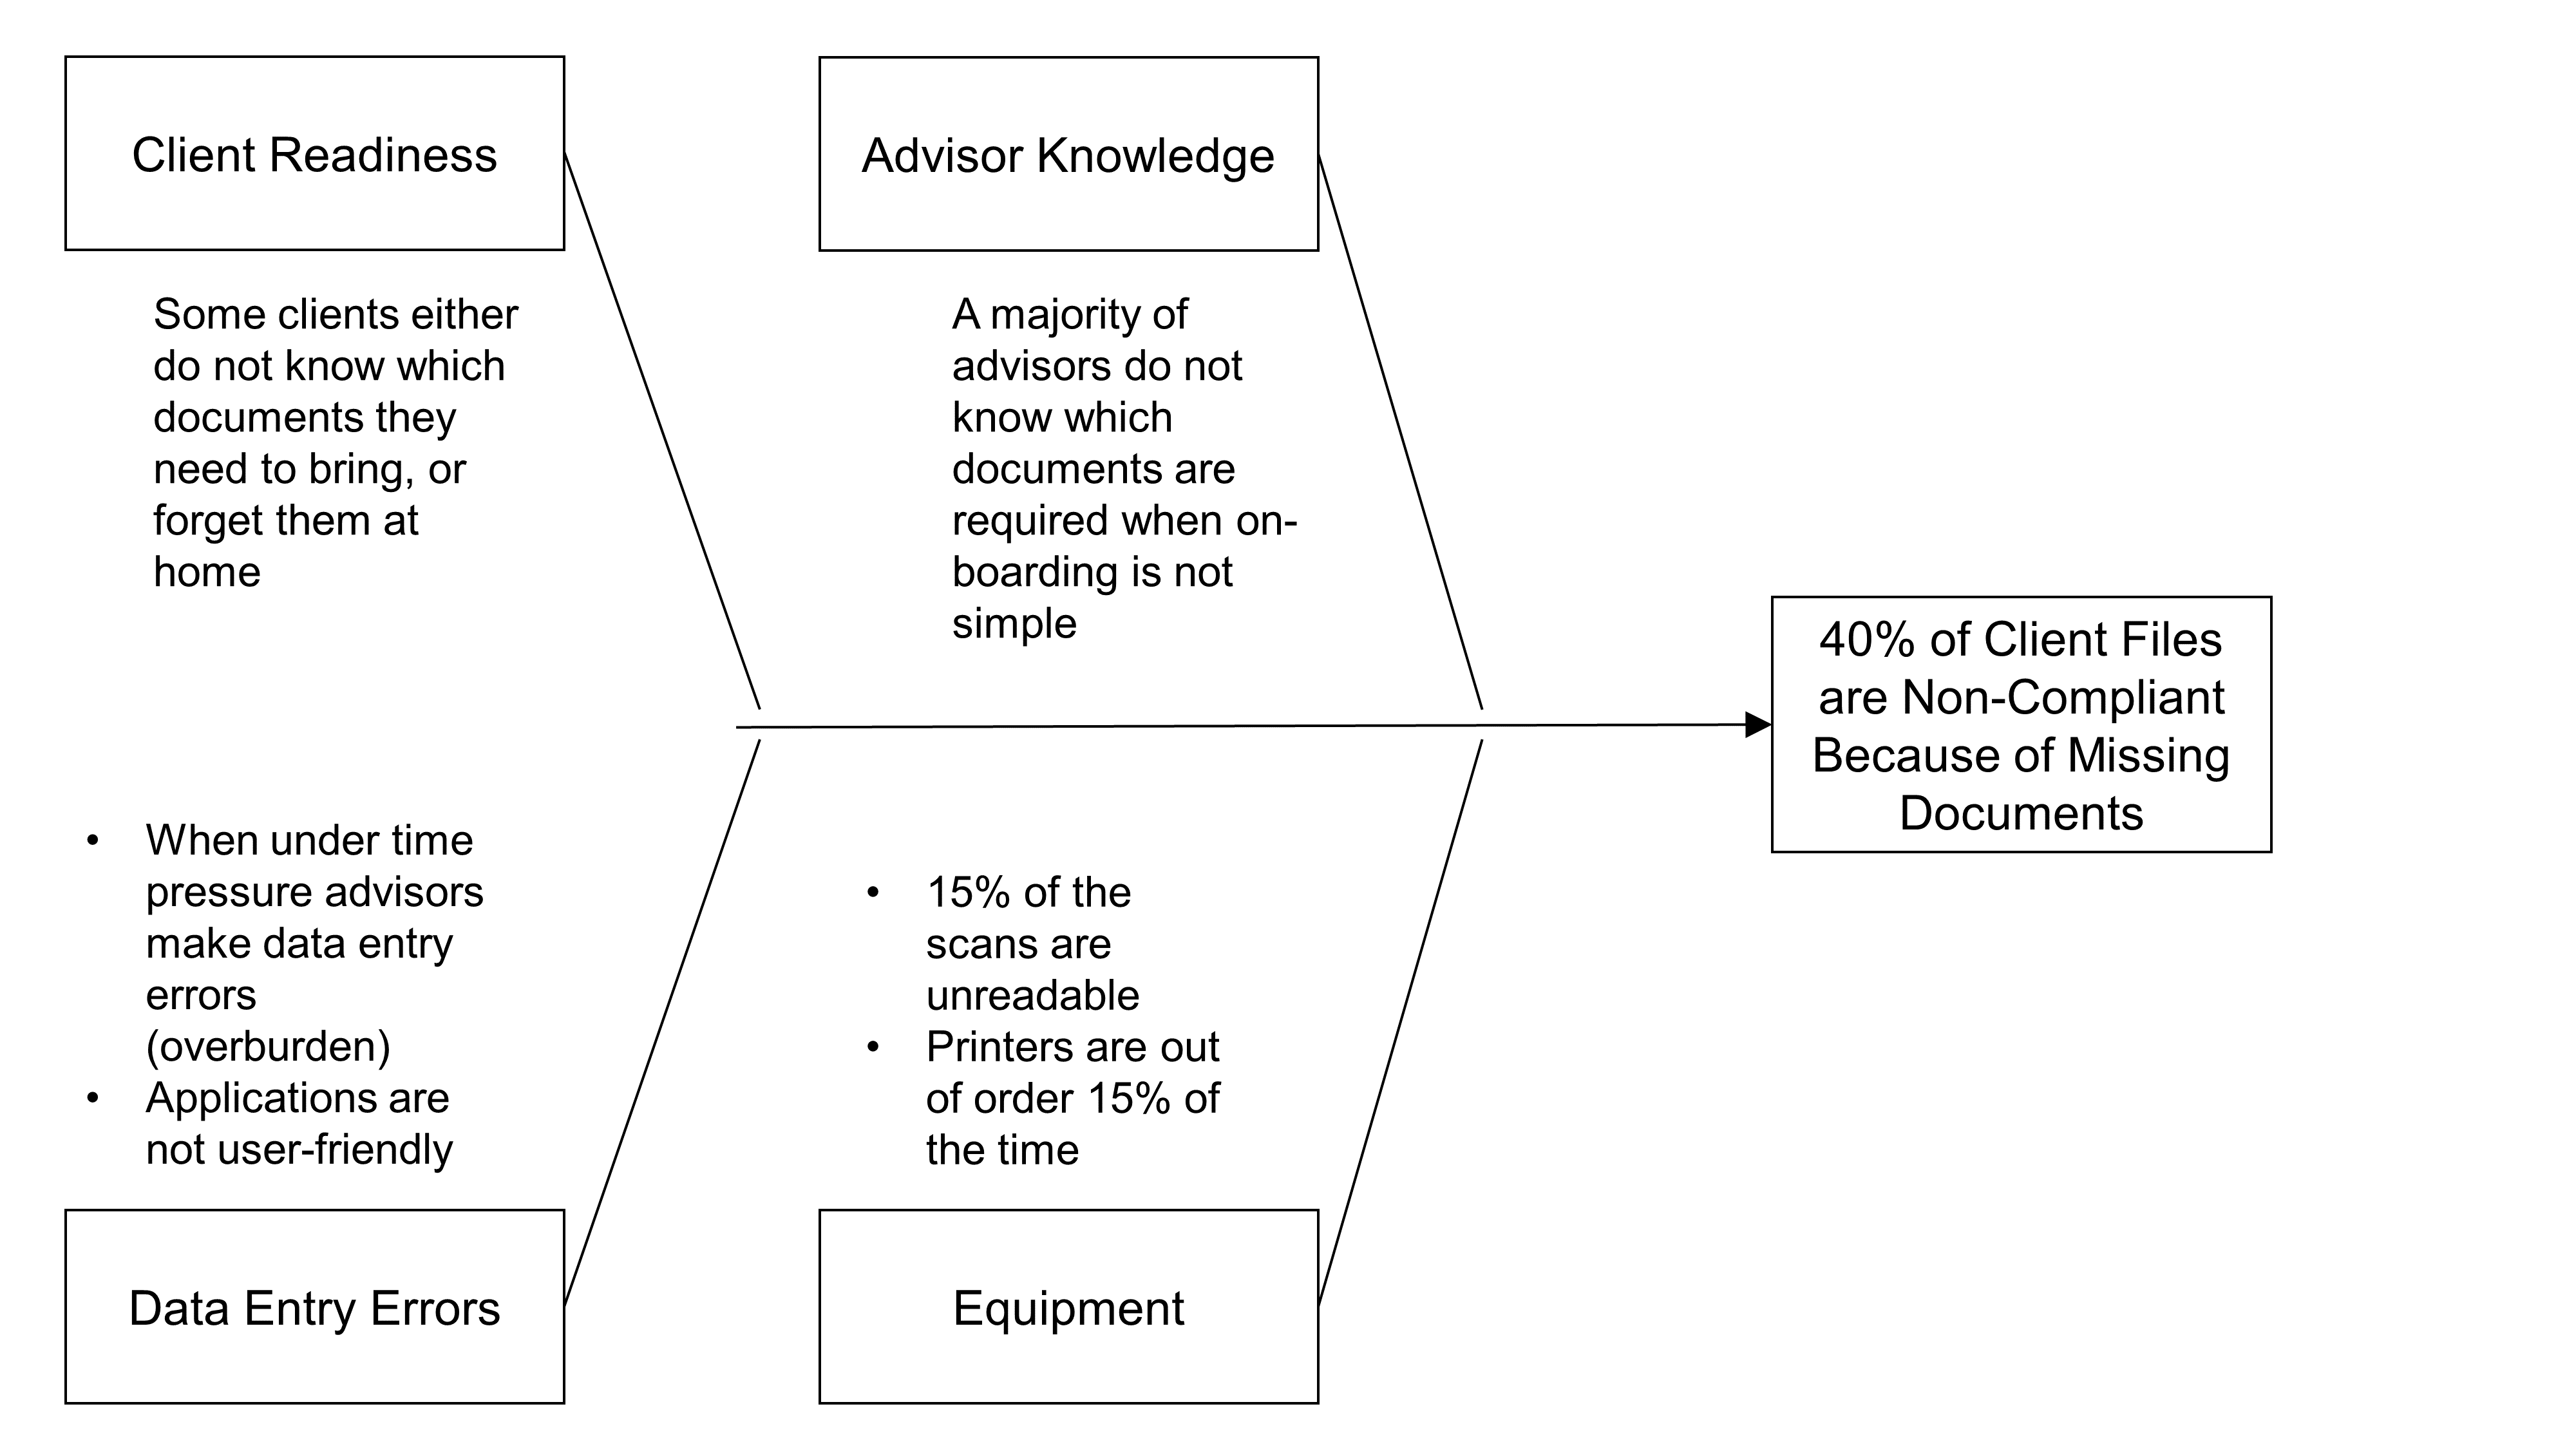
This is illustrated with the “collect and control documents” process. The main problems are:
-
Only 60% of new client files meet compliance requirements because of missing or incorrect supporting documents (defect waste)
-
The bank must organize a systematic control of client files in the back office (inspection waste)
-
Advisors request clients to provide missing documents (rework waste)
-
Advisors scan missing documents (rework waste)
Discovering why so many client files are not meeting compliance requirements is a prerequisite to improving the value stream. Figure 41 lists a set of first-level causes.
The “five whys” technique can be used to analyze the root causes of problems; for example:
-
Discover why 15% of scans are unreadable: is this due to a hardware or a software problem, or a scanner handling problem – perhaps due to bad ergonomics, etc.
-
Analyze when and why advisors experience time pressure: is the time for the next appointment coming up, or is the advisor busy with administrative tasks while the client asks questions, etc.
Two usual generic causes of waste (Muda) are unevenness or variability (“Mura”) and overburden (“Muri”).
16.2.4. Mura and Muri
Unevenness causes people or machines to be either overburdened at times of peak activity or underutilized in times of low activity. This is illustrated using on-boarding appointments.
The ideal “clean-slate” vision states: “Open an account and get a credit card without an appointment”. This is possible if an advisor has enough time to meet the prospect soon after they arrive.
The available work time per day in a branch depends on the number of advisors available that day and the percentage of their time that can be allocated to on-boarding appointments.
Using the hypothesis that a branch has three advisors who can allocate five hours of their time to on-boarding appointments, the total available work time is 15 hours or 900 minutes a day.
If 10 clients show up that day, the target rate for “producing” on-boarding meetings is 900 divided by 10, which is equal to 90 minutes. This is the takt time, which measures how often the branch should produce on-boarding appointments.
The takt time measures how often you should produce one part or product, based on the rate of demand, to meet customer requirements. In our example, it measures how often you should have customer on-boarding meetings. Takt time is a reference number that gives you a sense of the rate at which a process should be producing.
Using the hypothesis that the new P/T for handling an appointment is reduced to 60 minutes, everything being equal, the branch is in overcapacity to meet customer demand: the branch can conduct on-boarding meetings every 60 minutes while customer demand only requires it to conduct meetings every 90 minutes.
Making a new hypothesis, that 20 clients a day request to meet an advisor, the new takt time to meet customer demand would be:
In this hypothesis, the branch does not have enough capacity to meet customer demand. In order to meet demand, advisors would have to reduce the on-boarding duration from 60 minutes to 45 minutes. This would obviously over-burden advisors who would make more mistakes and deliver a poor customer experience.
In a service context, customer demand often varies intraday. Making the hypothesis that 10 clients show up during lunch time, the three advisors could not satisfy demand. Therefore, in a service context, computing takt time may not be sufficient to manage demand variation (Mura) and avoid overburden (Muri).
16.3. Future State Mapping
A future state map provides a set of challenges and target conditions. A target condition is a hypothesized work pattern that will move a step closer to the desired goals [Liker 2017]: “A good understanding of the current condition relative to the challenge will helps identify whether this target condition, or some others, makes sense to test”.
Remember, Table 3 helped to identify three specialized client on-boarding value streams. This document will now illustrate how to develop a future state map using the simple on-boarding value stream example.
16.3.1. Schedule an Appointment
The first challenge is to sort prospects so that only capable resident adults who own or rent their housing go through the simple on-boarding value stream. The intention is to rapidly streamline the simple value stream because it is a “low hanging fruit” that can improve the experience of the biggest customer segment. From a marketing perspective, the more prospects that the branch can on-board on the spot, the better. When an appointment is handled later, the bank may lose a customer to competition.
The second challenge is to have enough capacity to meet demand. Because there is not much flexibility in adding new advisors to a branch on the spot, the team is considering two countermeasures:
-
Get the branch manager do some on-boarding interviews at peak time
-
When no advisor is available to meet a prospect within 10 minutes of their arrival, propose an appointment within the next 24 hours
Section 16.3.4 develops an approach that could help the bank to find new ways of solving the problem. This is illustrated with the second improvement increment.
16.3.2. Discover, Offer, and Choose Products
The on-boarding interview starts with 15 minutes of “quality time” that provides an opportunity to listen to the prospect and understand their most pressing needs. This value stream caters to clients who are likely to have straightforward needs. The advisor asks simple questions to discover which credit card best meets the prospect’s needs. This simplification reduces the “offer and choose products” P/T from 30 minutes to 10 minutes.
16.3.3. Collect and Control Documents
Because the market segment served by this value stream is composed of capable adults who are residents and own or rent their housing, the list of required documents is simple enough to be remembered by advisors. Most scan quality issues are due to improper manipulation. Therefore, an information campaign can dramatically reduce scan defects.
The bank can also use Software as a Service (SaaS) services to verify in real time the authenticity of identification and supporting documents. The combination of these countermeasures can help reduce the P/T from 35 minutes to 15 minutes. Because the right documents are requested and their authenticity verified on the spot, rework is almost eliminated.
In this improvement increment, advisors will not get tablets because it would take too much time to implement and the up-front investment would be difficult to justify.
16.3.4. Capacity Management
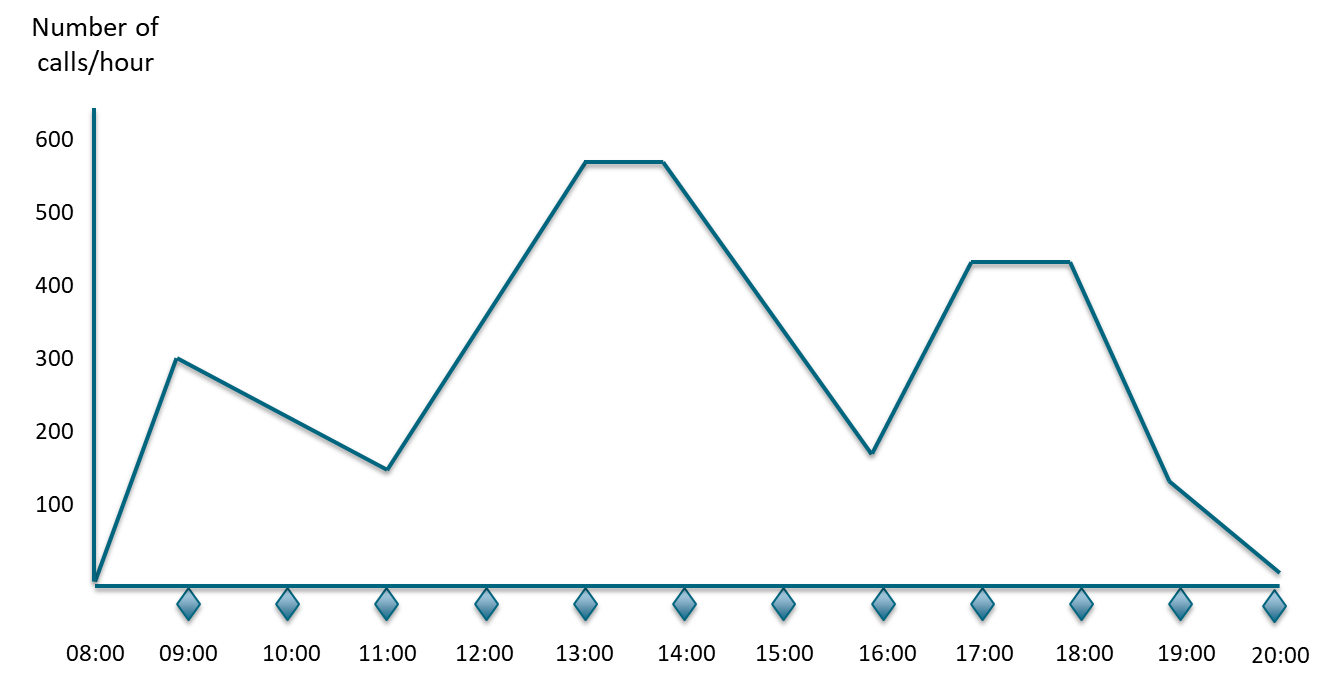
Capacity management matches capacity and demand. The first step is to determine demand patterns and assess the causes of demand variations, as Figure 42 illustrates. It represents the call distribution of the bank’s call center. Call distribution often needs to be analyzed at a lower level of granularity, such as by type of call. For example, credit card calls are likely to have a different distribution pattern than retail brokerage calls.
The call distribution pattern may vary during the week; for example, people who got their credit card declined during the weekend are likely to call the bank on Monday morning. The call distribution pattern may be impacted by market events; for example, a severe decline of indices is likely to increase the number of brokerage calls.
The second step is to identify, experiment, and implement countermeasures that influence demand and/or capacity.
Influencing Demand
Examples of countermeasures that lower demand:
-
Communicate busy times in real time; for example, inform employees when the enterprise’s restaurant suffers from an attendance peak, or inform clients how long the waiting time is likely to be
-
Offer incentives to customers for usage during non-peak times
-
Charge full price – no discount
Examples of countermeasures that increase demand:
-
Offer discounts or price reductions; for example, two beers for the price of one between 5pm and 7pm
-
Modify the offering to target new market segments
-
Offer free shipping when products are ordered in the middle of the afternoon
Managing Capacity
The first countermeasure is to organize the employee work schedule to match demand. However, there are limits due to labor laws and employee well-being.
Examples of countermeasures the enterprise can take are:
-
Cross-train employees so they can take on workload at peak times
-
Request employees work overtime
-
Increase customer participation with self-care
-
Automate
When capacity matches demand, it improves the quality of customer experience. It removes any defects caused by overburden and improves employee experience. It prevents paying for underutilized resources and people.
This document will now illustrate how additional countermeasures could further improve the value stream.
16.3.5. Increase On-Boarding Capacity
Unified communication tools such as Slack™, Skype, or Microsoft Teams® allow remote working. With this technology, when all advisors in a branch are busy, an advisor located in another branch can take care of a “walk in” prospect remotely. The mutualization of resources across several branches helps absorb activity peaks.
Implementing this target condition requires the bank to:
-
Assess client perception through focus groups and experimentation
-
Change the layout of branches to create video conference-ready offices
-
Adopt flex office practices
-
Upgrade the network capacity to support video streaming
-
Rethink the operating model by organizing teams by market segment
-
Evolve roles and responsibilities; for example, redefine the branch manager role
The feasibility study of this new target condition is conducted by cross-functional teams composed of representatives of the sales, marketing, HR, IT, or real estate functions. Implementation is incremental. It starts with a few pilot studies conducted in different regions. The rollout is progressive and leverages a central change management team.
This new way of working can support new use-cases; for example, leveraging the scarce resources that provide investment advice or instruct complex mortgage loans. The next step is to support a true omnichannel model with clients and employees interacting over the Internet. This creates new cybersecurity challenges that the bank will have to address.
16.3.6. Printing Credit Cards in Branches
Giving new clients their credit card at the end of the on-boarding appointment would be a differentiating capability. Two scenarios are explored:
-
Credit card printers are installed in branches
-
“Anonymous” preprinted credit cards are activated at the end of the on-boarding appointment
The credit card printer solution requires a major investment in hardware and system integration work. The micro process shown in Figure 43 models the tasks to be implemented. If the required APIs exist, or are easy to implement, integration work is simpler. It will also make running an experiment easier. The bank will conduct a few pilot studies before deciding whether or not to commit to funding the investment.
The bank must also factor-in the logistics implication of putting a printer in each branch. Printer maintenance and consumable renewals have a cost and must be organized.
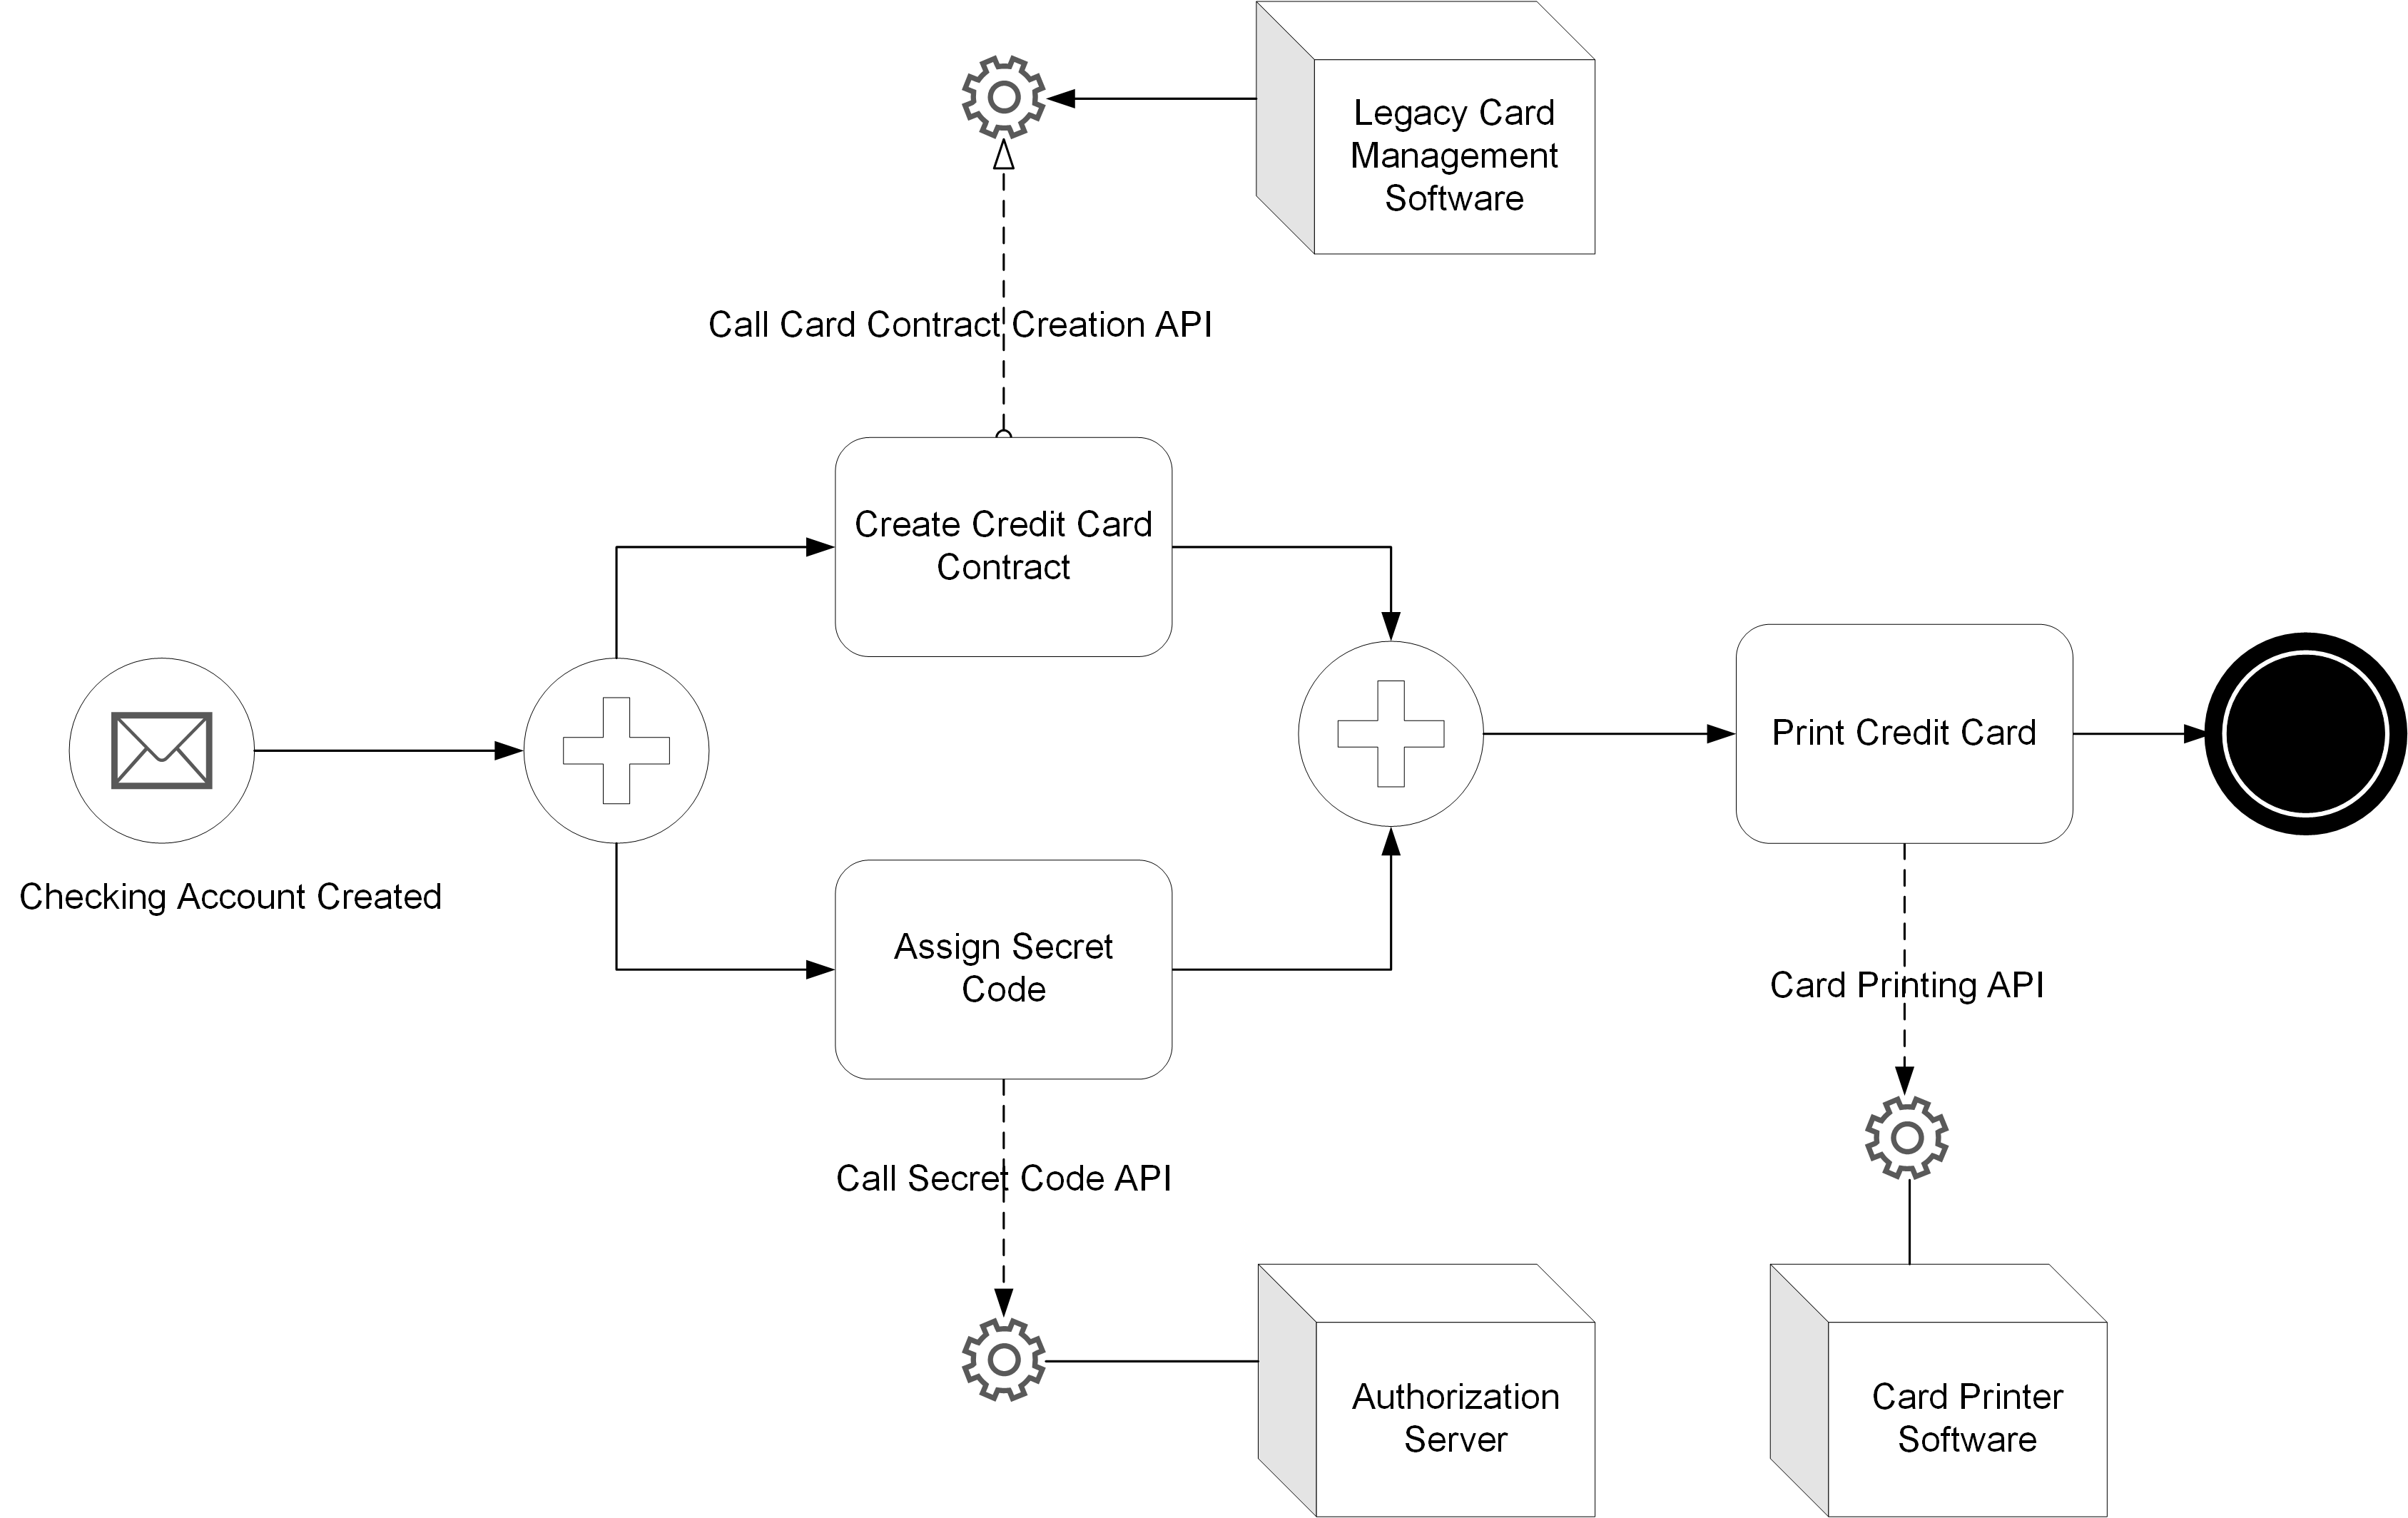
The alternative “low tech” solution is to provide a set of preprinted credit cards to branches. These cards would not have the client name printed on them. This would give clients access to a simple and standard means of payment. They would receive their final credit card later.
This next target condition reduces the “deliver means of payment” P/T from 10 minutes to 5 minutes. The big gain is the dramatic reduction of D/T from 5 days to 0 minutes.
16.4. Usage and Implmentation Considerations
Value stream mapping can be used to improve product development value streams and production value streams. Product development includes designing the value stream that delivers the product. The value stream mapping tool mostly helps to identify challenges, target conditions, countermeasures, and ideas for experimentation. Value stream mapping provides guidelines to stimulate thinking; it does not provide standard solutions to be applied mechanically.
16.4.1. Benefits
-
The real power of value stream mapping is in developing targets that can be achieved step-by-step
-
Horizontal communication between the teams that contribute to the value stream helps participants understand the perspective of others
-
Focus on the customer perspective helps to align teams around a common purpose
-
Team members understand how the activities for which they are responsible impact customers positively or negatively
16.4.2. Organizational Implications
Different organizational models can support effective value stream management. Organizational models need to balance product focus with functional expertise. When the functional dimension weakens, knowledge management and career development suffer.
The value stream manager role, which is comparable to the classical process owner role, can be implemented with minimum impact on the existing organization.
At the other end of the spectrum, the Toyota chief engineer model defines a role that combines entrepreneurship with good system architecture skills. A chief engineer should be capable of:
-
Defining a clear and compelling product vision
-
Inspiring excellent engineers
-
Designing the architecture of the product and its value stream
-
Learning enough knowledge from all disciplines to facilitate the resolution of cross-disciplinary problems
In the middle of the spectrum, Agile teams are mostly stream-aligned and cross-functional. They regroup the roles and skills needed to develop products. They are led by product owners.