Operations Management
| Although this Competency Area is titled “operations management” it also brings in infrastructure engineering at a higher level, assuming that the product is continuing to scale up. This is consistent with industry usage. |
Area Description
As the digital product gains more use, running it becomes a distinct concern from building it. For all their logic, computers are still surprisingly unreliable. Servers running well-tested software may remain “up” for weeks, and then all of a sudden hang and have to be rebooted. Sometimes it is clear why (for example, a log file filled up that no-one expected) and in other cases, there just is no explanation.
Engineering and operating complex IT-based distributed systems is a significant challenge. Even with Infrastructure as Code and automated continuous delivery pipelines, operations as a class of work is distinct from software development per se. The work is relatively more interrupt-driven, as compared to the “heads-down” focus on developing new features. Questions about scalability, performance, caching, load balancing, and so forth usually become apparent first through feedback from the operations perspective — whether or not there is a formal operations “team”.
The assumption here is still just one team with one product, but with this last Competency Area of Context II, the assumption is that there is considerable use of the product. With today’s technology, correctly deployed and operated, even a small team can support large workloads. This does not come easily, however. Systems must be designed for scale and ease of operations. They need to be monitored and managed for performance and capacity. The topic of configuration management will be covered further at a more advanced level.
The evolution of infrastructure was covered in Digital Infrastructure and applications development in Application Delivery, and the DPBoK Standard will continue to build on those foundations. The practices of change, incident, and problem management have been employed in the industry for decades and are important foundations for thinking about operations. Finally, the concept of SRE is an important new discipline emerging from the practices of companies such as Google and Facebook.
Defining Operations Management
Defining Operations
Description
Operations management is a broad topic in management theory, with whole programs dedicated to it in both business and engineering schools. Companies frequently hire Chief Operations Officers to run the organization. We started to cover operations management in Work Management, as we examined the topic of “work management” — in traditional operations management, the question of work and who is doing it is critical. For the Digital Practitioner, “operations” tends to have a more technical meaning than the classic business definition, being focused on the immediate questions of systems integrity, availability and performance, and feedback from the user community (i.e., the service or help desk). We see such a definition from Limoncelli et al.:
… operations is the work done to keep a system running in a way that meets or exceeds operating parameters specified by a Service-Level Agreement (SLA). Operations includes all aspects of a service’s lifecycle: from initial launch to the final decommissioning and everything in between [178 p. 147].
Operations often can mean “everything but development” in a digital context. In the classic model, developers built systems and “threw them over the wall” to operations. Each side had specialized processes and technology supporting their particular concerns. However, recall our discussion of design thinking — the entire experience is part of the product. This applies to both those consuming it as well as running it. Companies undergoing Digital Transformation are experimenting with many different models; as we will see in Context III, up to and including the complete merging of Development and Operations-oriented skills under common product management.
| In a digitally transformed enterprise, operations is part of the product. |
Since this document has a somewhat broader point of view covering all of digital management, it uses the following definition of operations:
Operations is the direct facilitation and support of the digital value experience. It tends to be less variable, more repeatable, yet more interrupt-driven than product development work. It is more about restoring a system to a known state, and less about creating new functionality.
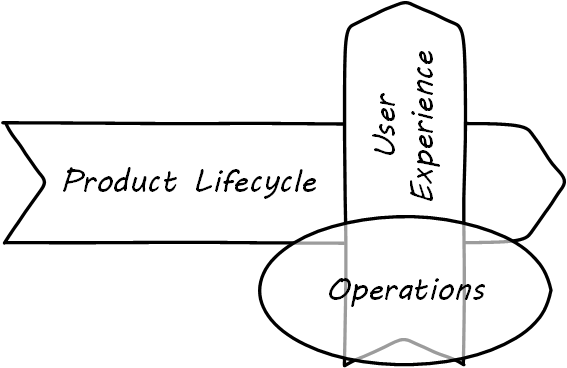
What do we mean by this? In terms of our dual-axis value chain, operations supports the day-to-day delivery of the digital “moment of truth” (see Operations Supports the Digital Moment of Truth).
The following are examples of “operations” in an IT context. Some are relevant to a “two pizza product team” scenario; some might be more applicable to larger environments:
-
Systems operators are sitting in 24x7 operations centers, monitoring system status and responding to alerts
-
Help desk representatives answering phone calls from users requiring support
-
They may be calling because a system or service they need is malfunctioning. They may also be calling because they do not understand how to use the system for the value experience they have been led to expect from it. Again, this is part of their product experience.
-
-
Developers and engineers serving “on call” on a rotating basis to respond to systems outages referred to them by the operations center
-
Data center staff performing routine work, such as installing hardware, granting access, or running or testing backups; such routine work may be scheduled, or it may be on request (e.g., ticketed)
-
Field technicians physically dispatched to a campus or remote site to evaluate and if necessary update or fix IT hardware and/or software - install a new PC, fix a printer, service a cell tower antenna
-
Security personnel ensuring security protocols are followed; e.g., access controls
As above, the primary thing that operations does not do is develop new systems functionality. Operations is process-driven and systematic and tends to be interrupt-driven, whereas R&D fails the “systematic” part of the definition (review the definitions in process, product, and project management). However, new functionality usually has operational impacts. In manufacturing and other traditional industries, product development was a minority of work, while operations was where the bulk of work happened. Yet when an operational task involving information becomes well defined and repetitive, it can be automated with a computer.
This continuous cycle of innovation and commoditization has driven closer and closer ties between “development” and “operations”. This cycle has also driven confusion around exactly what is meant by “operations”. In many organizations there is an “Infrastructure and Operations” (I&O) function. Pay close attention to the naming. A matrix may help because we have two dimensions to consider here (see Application, Infrastructure, Development, Operations).
| Development Phase | Operations Phase | |
|---|---|---|
Application Layer |
Application developers. Handle demand, proactive and reactive, from product and operations. Never under I&O. |
Help desk. Application support and maintenance (provisioning, fixes not requiring software development). Often under I&O. |
Infrastructure Layer |
Engineering team. Infrastructure platform engineering and development (design and build typically of externally sourced products). Often under I&O. |
Operations center. Operational support, including monitoring system status. May monitor both infrastructure and application layers. Often under I&O. |
Notice that we distinguish carefully between the application and infrastructure layers. This document using the following pragmatic definitions:
-
Applications are consumed by people who are not primarily concerned with IT
-
Infrastructure is consumed by people who are primarily concerned with IT
Infrastructure services and/or products, as discussed in Digital Infrastructure, need to be designed and developed before they are operated, just like applications. This may all seem obvious, but there is an industry tendency to lump three of the four cells in the table into the I&O function when, in fact, each represents a distinct set of concerns.
The Concept of “Service Level”
Either a digital system is available and providing a service, or it isn’t. The concept of "service level” was mentioned above by Limoncelli. A level of service is typically defined in terms of criteria such as:
-
What percentage of the time will the service be available?
-
If the service suffers an outage, how long until it will be restored?
-
How fast will the service respond to requests?
A Service-Level Agreement, or SLA, is a form of contract between the service consumer and service provider, stating the above criteria in terms of a business agreement. When a service’s performance does not meet the agreement, this is sometimes called a “breach” and the service provider may have to pay a penalty (e.g., the customer gets a 5% discount on that month’s services). If the service provider exceeds the SLA, perhaps a credit will be issued.
SLAs drive much operational behavior. They help prioritize incidents and problems, and the risk of proposed changes are understood in terms of the SLAs.
State and Configuration
In all of IT (whether “infrastructure” or “applications”) there is a particular concern with managing state. IT systems are remarkably fragile. One incorrect bit of information — a “0” instead of a “1” — can completely alter a system’s behavior, to the detriment of business operations depending on it.
Therefore, any development of IT — starting with the initial definition of the computing platform — depends on the robust management state.
The following are examples of state:
-
The name of a particular server
-
The network address of that server
-
The software installed on that server, in terms of the exact version and bits that comprise it
State also has more transient connotations:
-
The current processes listed in the process table
-
The memory allocated to each process
-
The current users logged into the system
Finally, we saw in the previous section some server/application/business mappings. These are also a form of state.
It is therefore not possible to make blanket statements like “we need to manage state”. Computing devices go through myriads of state changes with every cycle of their internal clock. (Analog and quantum computing are out of scope for this document.)
The primary question in managing state is “what matters”? What aspects of the system need to persist, in a reliable and reproducible manner? Policy-aware tools are used extensively to ensure that the system maintains its configuration, and that new functionality is constructed (to the greatest degree possible) using consistent configurations throughout the digital pipeline.
Environments
“Production” is a term that new IT recruits rapidly learn has forbidding connotations. To be “in production” means that the broader enterprise value stream is directly dependent on that asset. How do things get to be “in production”? What do we mean by that?
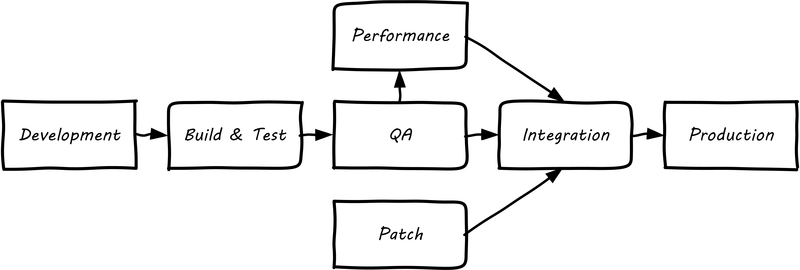
Consider the fundamental principle that there is an IT system delivering some “moment of truth” to someone. This system can be of any scale, but as above we are able to conceive of it having a “state”. When we want to change the behavior of this system, we are cautious. We reproduce the system at varying levels of fidelity (building “lower” environments with Infrastructure as Code techniques) and experiment with potential state changes. This is called development. When we start to gain confidence in our experiments, we increase the fidelity and also start to communicate more widely that we are contemplating a change to the state of the system. We may increase the fidelity along a set of traditional names (see Example Environment Pipeline):
-
Development
-
Build & Test
-
Quality Assurance (QA)
-
Performance (or load) testing
-
Integration
-
Patch
-
Production
The final state, where value is realized, is “production”. Moving functionality in smaller and smaller batches, with increasing degrees of automation, is called continuous delivery.
The fundamental idea that new system functionality sequentially moves (“promotes”) through a series of states to gain confidence before finally changing the state of the production system is historically well established. You will see many variations, especially at scale, on the environments listed above. However, the production state is notoriously difficult to reproduce fully, especially in highly distributed environments. While Infrastructure as Code has simplified the problem, lower environments simply can’t match production completely in all its complexity, especially interfaced interactions with other systems or when large, expensive pools of capacity are involved. Therefore there is always risk in changing the state of the production system. Mitigating strategies include:
-
Extensive automated test harnesses that can quickly determine if system behavior has been unfavorably altered
-
Ensuring that changes to the production system can be easily and automatically reversed; for example, code may be deployed but not enabled until a "feature toggle” is set - this allows quick shutdown of that code if issues are seen
-
Increasing the fidelity of lower environments with strategies such as service virtualization to make them behave more like production
-
Hardening services against their own failure in production, or the failure of services on which they depend
-
Reducing the size (and therefore complexity and risk) of changes to production (a key DevOps/continuous delivery strategy); variations here include:
-
Small functional changes (“one line of code”)
-
Small operational changes (deploying a change to just one node out of 100, and watching it, before deploying to the other 99 nodes)
-
-
Using policy-aware infrastructure management tools
Another important development in environmental approaches is A/B testing or canary deployments. In this approach, the “production” environment is segregated into two or more discrete states, with different features or behaviors exposed to users in order to assess their reactions. Netflix uses this as a key tool for product discovery, testing the user reaction to different user interface techniques, for example. Canary deployments are when a change is deployed to a small fraction of the user base, as a pilot.
Environments as Virtual Concepts
The concept of “environment” can reinforce functional silos and waterfall thinking, and potentially the waste of fixed assets. Performance environments (that can emulate production at scale) are particularly in question.
Instead, in a digital infrastructure environment (private or public), the kind of test you want to perform is defined and that capacity is provisioned on-demand.
“Development is Production”
It used to be that the concept of “testing in production” was frowned upon. Now, with these mitigating strategies, and the recognition that complex systems cannot ever be fully reproduced, there is more tolerance for the idea. But with older systems that may lack automated testing, incremental deployment, or easy rollback, it is strongly recommended to retain existing promotion strategies, as these are battle-tested and known to reduce risk. Often, their cycle time can be decreased.
On the other hand, development systems must never be treated casually.
-
The development pipeline itself represents a significant operational commitment
-
The failure of a source code repository, if not backed up, could wipe out a company (see [188])
-
The failure of a build server or package repository could be almost as bad
-
In the digital economy, dozens or hundreds of developers out of work represents a severe operational and financial setback, even if the “production” systems continue to function
It is, therefore, important to treat “development” platforms with the same care as production systems. This requires nuanced approaches: with Infrastructure as Code, particular virtual machines or containers may represent experiments, expected to fail often and be quickly rebuilt. No need for burdensome change processes when virtual machine base images and containers are being set up and torn down hundreds of times each day! However, the platforms supporting the instantiation and teardown of those virtual machines are production platforms, supporting the business of new systems development.
Evidence of Notability
Operations management is a broad topic in management and industrial theory, with dedicated courses of study and postgraduate degrees. The intersection of operations management and digital systems has been a topic of concern since the first computers were developed and put into use for military, scientific, and business applications.
Limitations
Operations is repeatable, interrupt-driven, and concerned with maintaining a given state of performance. It is usually rigorously distinguished from R&D.
Related Topics
Monitoring and Telemetry
Description
Computers run in large data centers, where physical access to them is tightly controlled. Therefore, we need telemetry to manage them. The practice of collecting and initiating responses to telemetry is called monitoring.
Monitoring Techniques
Limoncelli et al. define monitoring as follows:
Monitoring is the primary way we gain visibility into the systems we run. It is the process of observing information about the state of things for use in both short-term and long-term decision-making. [178].
But how do we “observe” computing infrastructure? Monitoring tools are the software that watches the software (and systems more broadly).
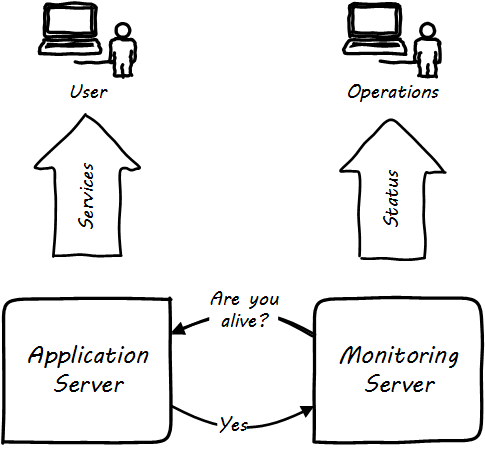
A variety of techniques are used to monitor computing infrastructure. Typically these involve communication over a network with the device being managed. Often, the network traffic is on the same network carrying the primary traffic of the computers. Sometimes, however, there is a distinct “out-of-band” network for management traffic. A simple monitoring tool will interact on a regular basis with a computing node, perhaps by “pinging” it periodically, and will raise an alert if the node does not respond within an expected timeframe (see Simple Monitoring).
More broadly, these tools provide a variety of mechanisms for monitoring and controlling operational IT systems; they may monitor:
-
Computing processes and their return codes
-
Performance metrics (e.g., memory and CPU utilization)
-
Events raised through various channels
-
Network availability
-
Log file contents (searching the files for messages indicating problems)
-
A given component’s interactions with other elements in the IT infrastructure; this is the domain of application performance monitoring tools, which may use highly sophisticated techniques to trace transactions across components of distributed infrastructure - see also the OpenTracing standard
-
And more (see Extended Monitoring)
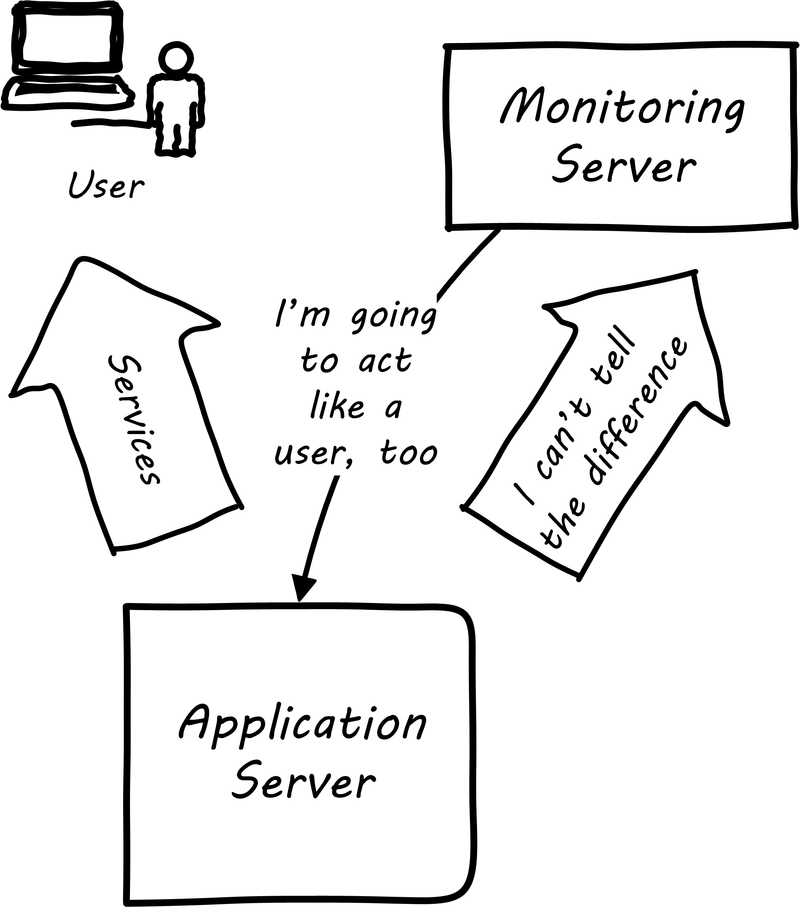
Some monitoring covers low-level system indicators not usually of direct interest to the end user. Other simulates end-user experience; SLAs are often defined in terms of the response time as experienced by the end user (see User Experience Monitoring). See [178], Chapters 16-17.
All of this data may then be forwarded to a central console and be integrated, with the objective of supporting the organization’s SLAs in priority order. Enterprise monitoring tools are notorious for requiring agents (small, continuously running programs) on servers; while some things can be detected without such agents, having software running on a given computer still provides the richest data. Since licensing is often agent-based, this gets expensive.
| Monitoring systems are similar to source control systems in that they are a critical point at which metadata diverges from the actual system under management. |
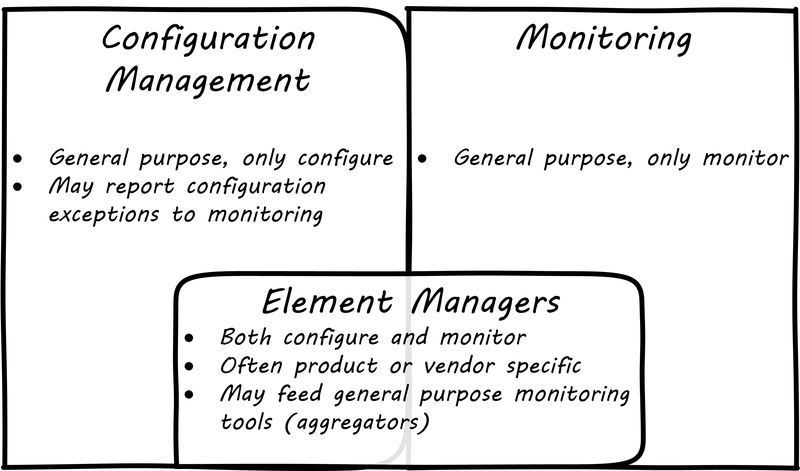
Related to monitoring tools is the concept of an element manager (see Configuration, Monitoring, and Element Managers). Element managers are low-level tools for managing various classes of digital or IT infrastructure. For example, Cisco provides software for managing network infrastructure, and EMC provides software for managing its storage arrays. Microsoft provides a variety of tools for managing various Windows components. Notice that such tools often play a dual role, in that they can both change the infrastructure configuration as well as report on its status. Many, however, are reliant on graphical user interfaces, which are falling out of favor as a basis for configuring infrastructure.
Specialized Monitoring
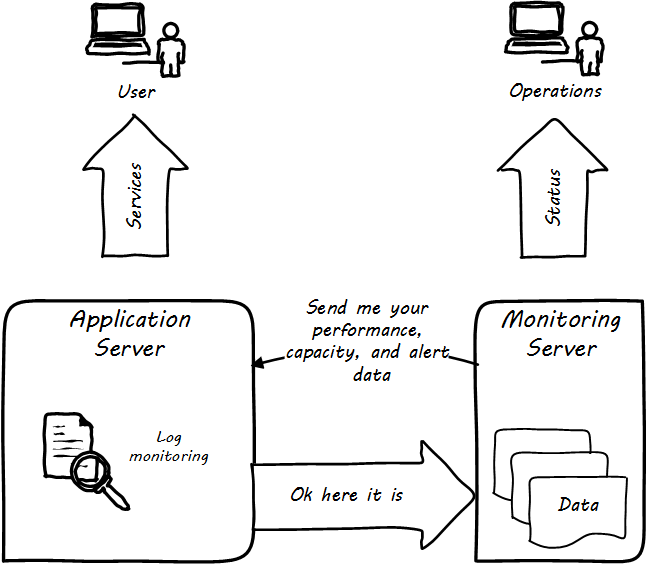
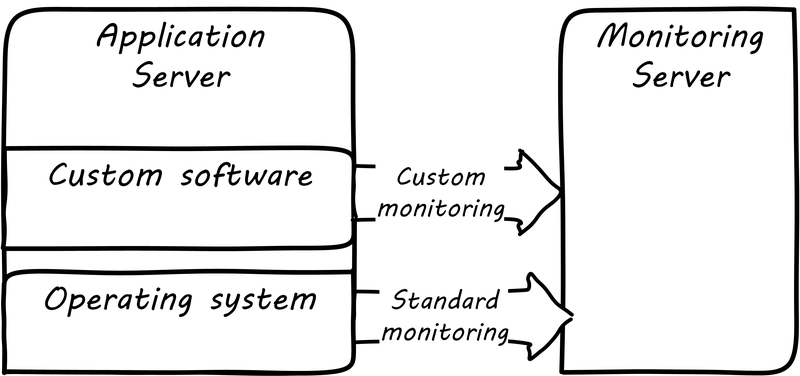
Monitoring tools, out of the box, can provide ongoing visibility to well-understood aspects of the digital product: the performance of infrastructure, the capacity utilized, and well-understood, common failure modes (such as a network link being down). However, the digital product or application also needs to provide its own specific telemetry in various ways (see Custom Software Requires Custom Monitoring). This can be done through logging to output files, or in some cases through raising alerts via the network.
A typical way to enable custom monitoring is to first use a standard logging library as part of the software development process. The logging library provides a consistent interface for the developer to create informational and error messages. Often, multiple “levels” of logging are seen, some more verbose than others. If an application is being troublesome, a more verbose level of monitoring may be turned on. The monitoring tool is configured to scan the logs for certain information. For example, if the application writes:
APP-ERR-SEV1-946: Unresolvable database consistency issues detected, terminating application.
Into the log, the monitoring tool can be configured to recognize the severity of the message and immediately raise an alert.
Finally, as the quote at the beginning of this section suggests, it is critical that the monitoring discipline is based on continuous improvement. (More to come on continuous improvement in Coordination and Process.) Keeping monitoring techniques current with your operational challenges is a never-ending task. Approaches that worked well yesterday, today generate too many false positives, and your operations team is now overloaded with all the noise. Ongoing questioning and improvement of your approaches are essential to keeping your monitoring system optimized for managing business impact as efficiently and effectively as possible.
Aggregation and Operations Centers
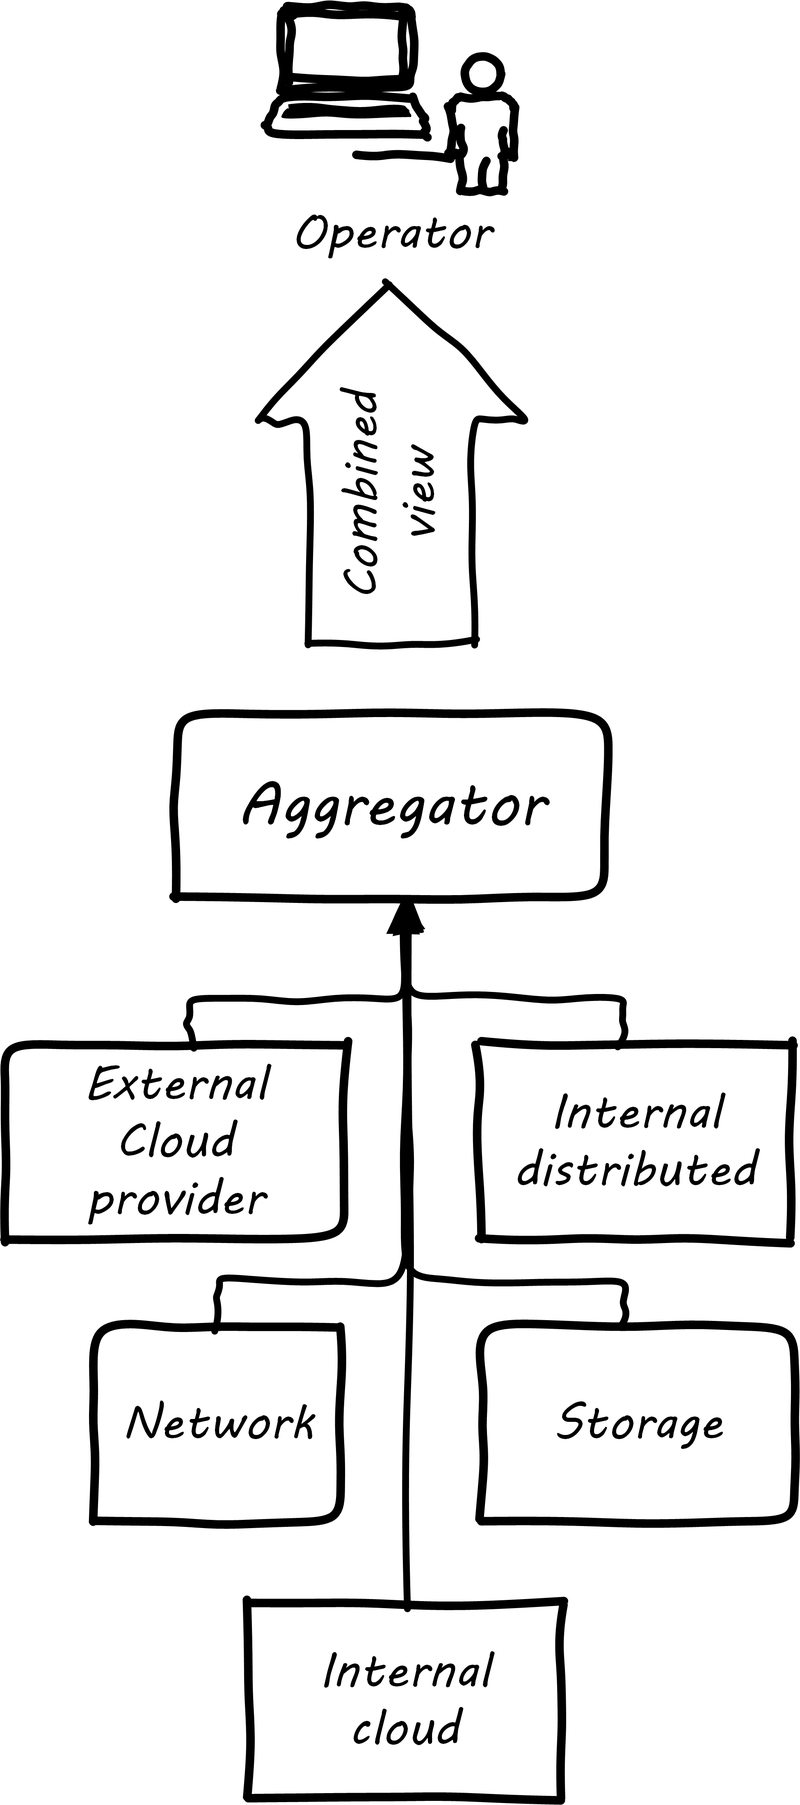
It is not possible for a 24x7 operations team to access and understand the myriads of element managers and specialized monitoring tools present in the large IT environment. Instead, these teams rely on aggregators of various kinds to provide an integrated view of the complexity (see Aggregated Monitoring). These aggregators may focus on status events, or specifically on performance aspects related either to the elements or to logical transactions flowing across them. They may incorporate dependencies from configuration management to provide a true “business view” into the event streams. This is directly analogous to the concept of Andon board from Lean practices or the idea of “information radiator” from Agile principles.
| 24x7 operations means operations conducted 24 hours a day, 7 days a week. |
A monitoring console may present a rich and detailed set of information to an operator. Too detailed, in fact, as systems become large. Raw event streams must be filtered for specific events or patterns of concern. Event de-duplication starts to become an essential capability, which leads to distinguishing the monitoring system from the event management system. Also, for this reason, monitoring tools are often linked directly to ticketing systems; on certain conditions, a ticket (e.g., an incident) is created and assigned to a team or individual.
Enabling a monitoring console to auto-create tickets, however, needs to be carefully considered and designed. A notorious scenario is the “ticket storm”, where a monitoring system creates multiple (perhaps thousands) of tickets, all essentially in response to the same condition.
Understanding Business Impact
At the intersection of event aggregation and operations centers is the need to understand business impact. It is not, for example, always obvious what a server is being used for. This may be surprising to new students, and perhaps those with experience in smaller organizations. However, in many large “traditional” IT environments, where the operations team is distant from the development organization, it is not necessarily easy to determine what a given hardware or software resource is doing or why it is there. Clearly, this is unacceptable in terms of security, value management, and any number of other concerns. However, from the start of distributed computing, the question “what is on that server?” has been all too frequent in large IT shops.
In mature organizations, this may be documented in a Configuration Management Database or System (CMDB/CMS). Such a system might start by simply listing the servers and their applications:
| Application | Server |
|---|---|
Quadrex |
SRV0001 |
PL-Q |
SRV0002 |
Quadrex |
DBSRV001 |
TimeTrak |
SRV0003 |
HR-Portal |
SRV0003 |
etc. |
etc. |
(Imagine the above list, 25,000 rows long.)
This is a start, but still doesn’t tell us enough. A more elaborate mapping might include business unit and contact:
| BU | Contact | Application | Server |
|---|---|---|---|
Logistics |
Mary Smith |
Quadrex |
SRV0001 |
Finance |
Aparna Chaudry |
PL-Q |
SRV0002 |
Logistics |
Mary Smith |
Quadrex |
DBSRV001 |
Human Resources |
William Jones |
TimeTrak |
SRV0003 |
Human Resources |
William Jones |
HR-Portal |
SRV0003 |
etc. |
etc. |
etc. |
etc. |
The above lists are very simple examples of what can be extensive record-keeping. But the key user story is implied: if we can’t ping SRV0001, we know that the Quadrex application supporting Logistics is at risk, and we should contact Mary Smith ASAP if she hasn’t already contacted us. (Sometimes, the user community calls right away; in other cases, they may not, and proactively contacting them is a positive and important step.)
The above approach is relevant to older models still reliant on servers (whether physical or virtual) as primary units of processing. The trend to more dynamic forms of computing such as containers and serverless computing is challenging these traditional practices, and what will replace them is currently unclear.
Capacity and Performance Management
Capacity and performance management are closely related, but not identical terms encountered as IT systems scale up and encounter significant load.
A capacity management system may include large quantities of data harvested from monitoring and event management systems, stored for long periods of time so that history of the system utilization is understood and some degree of prediction can be ventured for upcoming utilization.
The classic example of significant capacity utilization is the Black Friday/Cyber Monday experience of retailers. Both physical store and online e-commerce systems are placed under great strain annually around this time, with the year’s profits potentially on the line.
Performance management focuses on the responsiveness (e.g., speed) of the systems being used. Responsiveness may be related to capacity utilization, but some capacity issues don’t immediately affect responsiveness. For example, a disk drive may be approaching full. When it fills, the system will immediately crash, and performance is severely affected. But until then, the system performs fine. The disk needs to be replaced on the basis of capacity reporting, not performance trending. On the other hand, some performance issues are not related to capacity. A misconfigured router might badly affect a website’s performance, but the configuration simply needs to be fixed — there is no need to handle as a capacity-related issue.
At a simpler level, capacity and performance management may consist of monitoring CPU, memory, and storage utilization across a given set of nodes, and raising alerts if certain thresholds are approached. For example, if a critical server is frequently approaching 50% CPU utilization (leaving 50% “headroom”), engineers might identify that another server should be added. Abbot and Fisher suggest: “As a general rule … we like to start at 50% as the ideal usage percentage and work up from there as the arguments dictate” [4 p. 204].
So, what do we do when a capacity alert is raised, either through an automated system or through the manual efforts of a capacity analyst? There are a number of responses that may follow:
-
Acquire more capacity
-
Seek to use existing capacity more efficiently
-
Throttle demand somehow
Capacity analytics at its most advanced (i.e., across hundreds or thousands of servers and services) is a true Big Data problem domain and starts to overlap with IT asset management, capital planning, and budgeting in significant ways. As your organization scales up and you find yourself responding more frequently to the kinds of operational issues described in this section, you might start asking yourself whether you can be more proactive. What steps can you take when developing or enhancing your systems, so that operational issues are minimized? You want systems that are stable, easily upgraded, and that can scale quickly on-demand.
Evidence of Notability
Monitoring production systems is the subject of extensive discussion and literature in digital and IT management. See, for example, [14, 178, 34].
Limitations
Monitoring provides immediate insight via automated management of telemetry. It cannot tell responders what to do, in general.
Related Topics
Operational Response
Description
Monitoring communicates the state of the digital systems to the professionals in charge of them. Acting on that telemetry involves additional tools and practices, some of which we will review in this section.
Communication Channels
When signals emerge from the lower levels of the digital infrastructure, they pass through a variety of layers and cause assorted, related behavior among the responsible Digital Practitioners. The accompanying illustration shows a typical hierarchy, brought into action as an event becomes apparently more significant (see Layered Communications Channels).
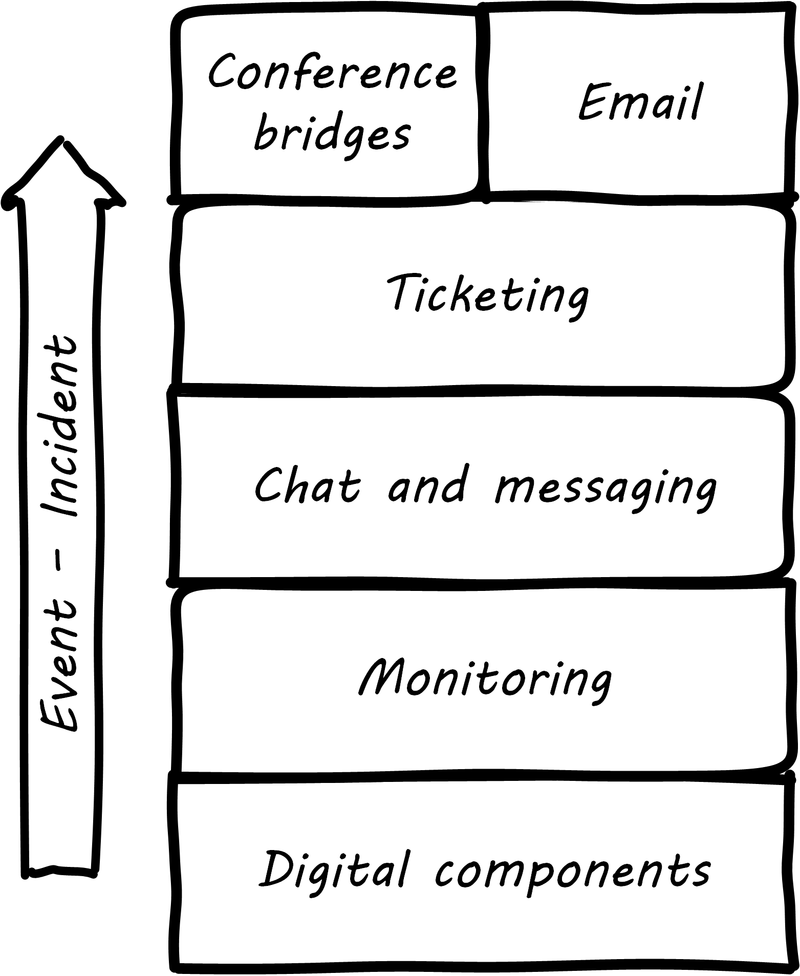
The digital components send events to the monitoring layer, which filters them for significant concerns; for example, a serious application failure. The monitoring tool might automatically create a ticket, or perhaps it first provides an alert to the system’s operators, who might instant message each other, or perhaps join a chatroom.
If the issue can’t be resolved operationally before it starts to impact users, an Incident ticket might be created, which has several effects:
-
First, the situation is now a matter of record, and management may start to pay attention
-
Accountability for managing the incident is defined, and expectations are that responsible parties will start to resolve it
-
If assistance is needed, the incident provides a common point of reference (it is a common reference point), in terms of work management
Depending on the seriousness of the incident, further communications by instant messaging, chat, cell phone, email, and/or conference bridge may continue. Severe incidents in regulated industries may require recording of conference bridges.
ChatOps is the tight integration of instant communications with operational execution. In a chatroom, a virtual agent or "bot" is enabled and monitors the human-to-human interactions. The human beings can issue certain commands to the bot, such as code deployments, team notifications, server restarts, or more [256].
Properly configured ChatOps provides a low-friction collaborative environment, enabling a powerful and immediate collective mental model of the situation and what is being done. It also provides a rich audit trail of who did what, when, and who else was involved. Fundamental governance objectives of accountability can be considered fulfilled in this way, on a par with paper or digital forms routed for approval (and without their corresponding delays).
Operational Process Emergence
Process is what makes it possible for teams to do the right thing, again and again.
Limoncelli, Chalup, and Hogan, in their excellent Cloud Systems Administration, emphasize the role of the “oncall” and “onduty” staff in the service of operations [178]. Oncall staff have a primary responsibility of emergency response, and the term oncall refers to their continuous availability, even if they are not otherwise working (e.g., they are expected to pick up phone calls and alerts at home and dial into emergency communications channels). Onduty staff are responsible for responding to non-critical incidents and maintaining current operations.
What is an emergency? It’s all a matter of expectations. If a system (by its SLA) is supposed to be available 24 hours a day, 7 days a week, an outage at 3 AM Saturday morning is an emergency. If it is only supposed to be available from Monday through Friday, the outage may not be as critical (although it still needs to be fixed in short order, otherwise there will soon be an SLA breach!).
IT systems have always been fragile and prone to malfunction. “Emergency” management is documented as a practice in “data processing” as early as 1971 [87 pp. 188-189]. In Competency Area 5, we discussed how simple task management starts to develop into process management. Certainly, there is a concern for predictability when the objective is to keep a system running, and so process management gains strength as a vehicle for structuring work. By the 1990s, a process terminology was increasingly formalized, by vendors such as IBM (in their “Yellow Book” series), the UK’s IT Infrastructure Library (ITIL), and other guidance such as the Harris Kern library (popular in the US before ITIL gained dominance). These processes include:
-
Request management
-
Incident management
-
Problem management
-
Change management
Even as a single-product team, these processes are a useful framework to keep in mind as operational work increases. See Basic Operational Processes for definitions of the core processes usually first implemented.
| Process | Definition |
|---|---|
Request management |
Respond to routine requests such as providing systems access. |
Incident management |
Identify service outages and situations that could potentially lead to them, and restore service and/or mitigate immediate risk. |
Problem management |
Identify the causes of one or more incidents and remedy them (on a longer-term basis). |
Change management |
Record and track proposed alterations to critical IT components. Notify potentially affected parties and assess changes for risk; ensure key stakeholders exercise approval rights. |
These processes have a rough sequence to them:
-
Give the user access to the system
-
If the system is not functioning as expected, identify the issue and restore service by any means necessary - don’t worry about why it happened yet
-
Once service is restored, investigate why the issue happened (sometimes called a post-mortem) and propose longer-term solutions
-
Inform affected parties of the proposed changes, collect their feedback and approvals, and track the progress of the proposed change through successful completion
At the end of the day, we need to remember that operational work is just one form of work. In a single-team organization, these processes might still be handled through basic task management (although user provisioning would need to be automated if the system is scaling significantly). It might be that the simple task management is supplemented with checklists since repeatable aspects of the work become more obvious. We will continue on the assumption of basic task management for the remainder of this Competency Area, and go deeper into the idea of defined, repeatable processes as we scale to a “team of teams” in Context III.
Post-Mortems, Blamelessness, and Operational Demand
We briefly mentioned problem management as a common operational process. After an incident is resolved and services are restored, further investigation (sometimes called “root cause analysis”) is undertaken as to the causes and long-term solutions to the problem. This kind of investigation can be stressful for the individuals concerned and human factors become critical.
| The term "root cause analysis” is viewed by some as misleading, as complex system failures often have multiple causes. Other terms are post-mortems or simply causal analysis. |
We have discussed psychological safety previously. Psychological safety takes on an additional and even more serious aspect when we consider major system outages, many of which are caused by human error. There has been a long history of management seeking individuals to “hold accountable” when complex systems fail. This is an unfortunate approach, as complex systems are always prone to failure. Cultures that seek to blame do not promote a sense of psychological safety.
The definition of "counterfactual” is important. A “counterfactual” is seen in statements of the form “if only Joe had not re-indexed the database, then the outage would not have happened”. It may be true that if Joe had not done so, the outcome would have been different. But there might be other such counterfactuals. They are not helpful in developing a continual improvement response. The primary concern in assessing such a failure is "how was Joe put in a position to fail?". Put differently, how is it that the system was designed to be vulnerable to such behavior on Joe’s part? How could it be designed differently, and in a less sensitive way?
This is, in fact, how aviation has become so safe. Investigators with the unhappy job of examining large-scale airplane crashes have developed a systematic, clinical, and rational approach for doing so. They learned that if the people they were questioning perceived a desire on their part to blame, the information they provided was less reliable. (This, of course, is obvious to any parent of a four-year old.)
John Allspaw, CTO of Etsy, has pioneered the application of modern safety and incident investigation practices in digital contexts and notably has been an evangelist for the work of human factors expert and psychologist Sidney Dekker. Dekker summarizes attitudes towards human error as falling into either the old or new views. He summarizes the old view as the Bad Apple theory:
-
Complex systems would be fine, were it not for the erratic behavior of some unreliable people (Bad Apples) in it
-
Human errors cause accidents: humans are the dominant contributor to more than two thirds of them
-
Failures come as unpleasant surprises; they are unexpected and do not belong in the system - failures are introduced to the system only through the inherent unreliability of people
Dekker contrasts this with the new view:
-
Human error is not a cause of failure - human error is the effect, or symptom, of deeper trouble
-
Human error is not random - it is systematically connected to features of people’s tools, tasks, and operating environment
-
Human error is not the conclusion of an investigation; it is the starting point [83]
Dekker’s principles are an excellent starting point for developing a culture that supports blameless investigations into incidents. We will talk more systematically of culture in Coordination and Process.
Finally, once a post-mortem or problem analysis has been conducted, what is to be done? If work is required to fix the situation (and when is it not?), this work will compete with other priorities in the organization. Product teams typically like to develop new features, not solve operational issues that may call for reworking existing features. Yet serving both forms of work is essential from a holistic, design thinking point of view.
In terms of queuing, operational demand is too often subject to the equivalent of queue starvation — which as Wikipedia notes is usually the result of “naive scheduling algorithms”. If we always and only work on what we believe to be the “highest priority” problems, operational issues may never get attention. One result of this is the concept of technical debt, which we discuss in Context IV.
Drills, Game Days, and Chaos Engineering
As noted above, it is difficult to fully reproduce complex production infrastructures as “lower” environments. Therefore, it is difficult to have confidence in any given change until it has been run in production.
The need to emulate “real-world” conditions is well understood in the military, which relies heavily on drill and exercises to ensure peak operational readiness. Analogous practices are emerging in digital organizations, such as the concept of “Game Days” — defined periods when operational disruptions are simulated and the responses assessed. A related set of tools is the Netflix Simian Army, a collection of resiliency tools developed by the online video-streaming service Netflix. It represents a significant advancement in digital risk management, as previous control approaches were too often limited by poor scalability or human failure (e.g., forgetfulness or negligence in following manual process steps).
Chaos Monkey is one of a number of tools developed to continually “harden” the Netflix system, including:
-
Latency Monkey — introduces arbitrary network delays
-
Conformity Monkey — checks for consistency with architectural standards, and shuts down non-conforming instances
-
Doctor Monkey — checks for longer-term evidence of instance degradation
-
Janitor Monkey — checks for and destroys unused running capacity
-
Security Monkey — an extension of Conformity Monkey, checks for correct security configuration
-
10-18 Monkey — checks internationalization
-
Finally, Chaos Gorilla simulates the outage of an entire Amazon availability zone
On the whole, the Simian Army behaves much as antibodies do in an organic system. One notable characteristic is that the monkeys as described do not generate a report (a secondary artifact) for manual follow-up. They simply shut down the offending resources.
Such direct action may not be possible in many environments but represents an ideal to work toward. It keeps the security and risk work “front and center” within the mainstream of the digital pipeline, rather than relegating it to the bothersome “additional work” it can so easily be seen as.
A new field of chaos engineering is starting to emerge centered on these concepts.
Site Reliability Engineering
Site Reliability Engineering (SRE) is a new term for operations-centric work, originating from Google and other large digital organizations. It is clearly an operational discipline; the SRE team is responsible for the “availability, latency, performance, efficiency, change management, monitoring, emergency response, and capacity planning of their service” [34 p. 7].
Google site reliability engineers have strong technical backgrounds, frequently computer science, which is atypical for operations staff in the traditional IT industry. SREs are strongly incented to automate as much as possible, avoiding “toil” (i.e., repetitive, non-value-add tasks). In other words, as Benjamin Sloss says: “we want systems that are automatic, not just automated” [34].
Google has pioneered a number of innovative practices with its SRE team, including:
-
A 50% cap on aggregate “ops” work — the other 50% is supposed to be spent on development
-
The concept of an “error budget” as a control mechanism — teams are incented not for “zero downtime” but rather to take the risk and spend the error budget
-
“Release Engineer” as a specific job title for those focused on building and maintaining the delivery pipeline
Evidence of Notability
Identifying the need for and marshaling operational response is an essential capability in managing digital systems.
Limitations
Operational response is typically urgent and time-bound. It is not reflective nor, in general, creative or innovative (except out of necessity).
Related Topics
Operations-Driven Product Demand
Description
Designing complex systems that can scale effectively and be operated efficiently is a challenging topic. Many insights have been developed by the large-scale public-facing Internet sites, such as Google, Facebook, Netflix, and others.
A reasonable person might question why systems design questions are appearing here in this Competency Area on operations. We have discussed certain essential factors for system scalability previously: cloud, Infrastructure as Code, version control, and continuous delivery. These are all necessary, but not sufficient to scaling digital systems. Once a system starts to encounter real load, further attention must go to how it runs, as opposed to what it does. It is not easy to know when to focus on scalability. If product discovery is not on target, the system will never get the level of use that requires scalability. Insisting that the digital product has a state-of-the-art and scalable design might be wasteful if the team is still searching for an MVP (in Lean Startup terms). Of course, if you are doing systems engineering and building a “cog”, not growing a “flower", you may need to be thinking about scalability earlier.
Eventually, scale matters. Cloud computing abstracts many concerns, but as your IT service’s usage increases, you will inevitably find that technical details such as storage and network architecture increasingly matter. What often happens is that the system goes through various prototypes until something with market value is found and, at that point, as use starts to scale up, the team scrambles for a more robust approach. The implementation decisions made by the Digital Practitioner and their service providers may become inefficient for the particular “workload” the product represents. The brief technical writeup, Latency Numbers Every Programmer Should Know is recommended.
There are dozens of books and articles discussing many aspects of how to scale systems. In this section, we will discuss two important principles: the CAP principle and the AKF scaling cube. If you are interested in this topic in depth, consult the references in this Competency Area.
The CAP Principle
Scaling digital systems used to imply acquiring faster and more powerful hardware and software. If a 4-core server with 8 gigabytes of RAM isn’t enough, get a 32-core server with 256 gigabytes of RAM (and upgrade your database software accordingly, for millions of dollars more). This kind of scaling is termed “vertical” scaling. However, web-scale companies such as Facebook and Google determined that this would not work indefinitely. Vertical scaling in an infinite capacity is not physically (or financially) possible. Instead, these companies began to experiment aggressively with using large numbers of inexpensive commodity computers.
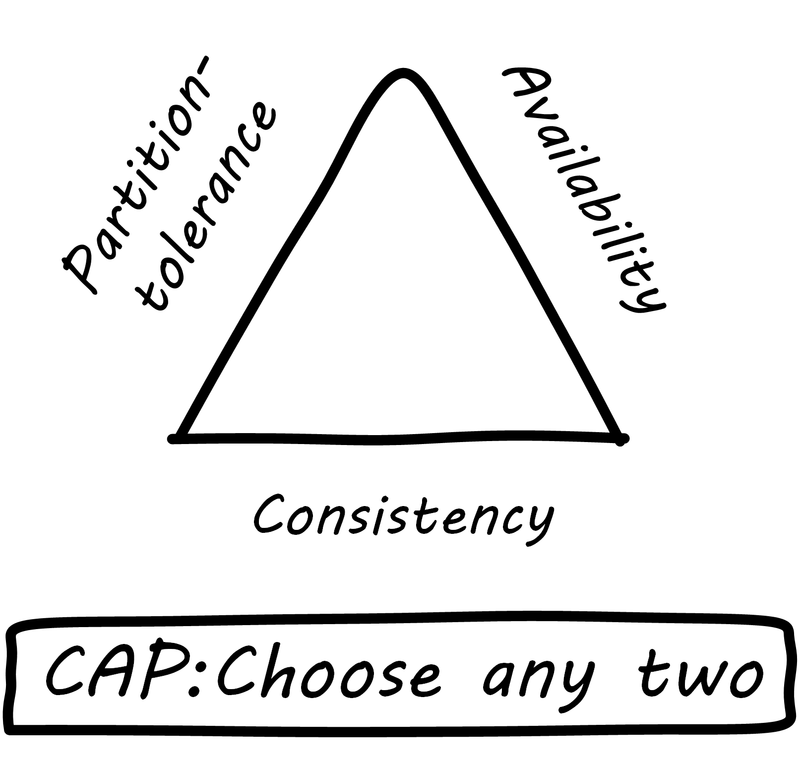
The advantage to vertical scaling is that all your data can reside on one server, with fast and reliable access. As soon as you start to split your data across servers, you run into the practical implications of the CAP principle (see CAP Principle).
CAP stands for:
-
Consistency
-
Availability
-
Partition-tolerance
and the CAP principle (or theorem) states that it is not possible to build a distributed system that guarantees all three [106]. What does this mean? First, let’s define our terms.
Consistency means that all the servers (or “nodes”) in the system see the same data at the same time. If an update is being processed, no node will see it before any other. This is often termed a transactional guarantee, and it is the sort of processing relational databases excel at.
For example, if you change your flight, and your seat opens up, a consistent reservation application will show the free seat simultaneously to anyone who inquires, even if the reservation information is replicated across two or more geographically distant nodes. If the seat is reserved, no node will show it available, even if it takes some time for the information to replicate across the nodes. The system will simply not show anyone any data until it can show everyone the correct data.
Availability means what it implies: that the system is available to provide data on request. If we have many nodes with the same data on them, this can improve availability, since if one is down, the user can still reach others.
Partition-tolerance is the ability of the distributed system to handle communications outages. If we have two nodes, both expected to have the same data, and the network stops communicating between them, they will not be able to send updates to each other. In that case, there are two choices: either stop providing services to all users of the system (failure of availability) or accept that the data may not be the same across the nodes (failure of consistency).
In the earlier years of computing, the preference was for strong consistency, and vendors such as Oracle® profited greatly by building database software that could guarantee it when properly configured. Such systems could be consistent and available, but could not tolerate network outages — if the network was down, the system, or at least a portion of it, would also be down.
Companies such as Google and Facebook took the alternative approach. They said: “We will accept inconsistency in the data so that our systems are always available”. Clearly, for a social media site such as Facebook, a posting does not need to be everywhere at once before it can be shown at all. To verify this, simply post to a social media site using your computer. Do you see the post on your phone, or your friend’s, as soon as you submit it on your computer? No, although it is fast, you can see some delay. This shows that the site is not strictly consistent; a strictly consistent system would always show the same data across all the accessing devices.
The challenge with accepting inconsistency is how to do so. Eventually, the system needs to become consistent, and if conflicting updates are made they need to be resolved. Scalable systems in general favor availability and partition-tolerance as principles, and therefore must take explicit steps to restore consistency when it fails. The approach taken to partitioning the system into replicas is critical to managing eventual consistency, which brings us to the AKF scaling cube.
For further discussion, see [178], Section 1.5.
The AKF Scaling Cube
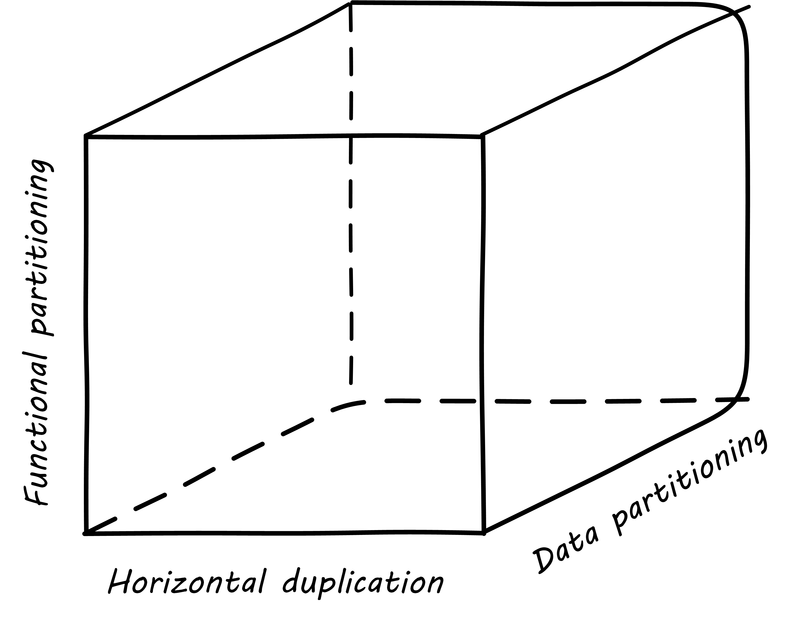
Another powerful tool for thinking about scaling systems is the AKF Scaling Cube (see AKF Scaling Cube, similar to [4 p. 376]). AKF stands for Abbott, Keeven, and Fisher, authors of The Art of Scalability [4]. The AKF cube is a visual representation of the three basic options for scaling a system:
-
Replicate the complete system (x-axis)
-
Split the system functionally into smaller layers or components (y-axis)
-
Split the system’s data (z-axis)
A complete system replica is similar to the Point of Sale (POS) terminals in a retailer. Each is a self-contained system with all the data it needs to handle typical transactions. POS terminals do not depend on each other; therefore you can keep increasing the capacity of your store’s checkout lines by simply adding more of them.
Functional splitting is when you separate out different features or components. To continue the retail analogy, this is like a department store; you view and buy electronics, or clothes, in those specific departments. The store “scales” by adding departments, which are self-contained in general; however, in order to get a complete outfit, you may need to visit several departments. In terms of systems, separating web and database servers is commonly seen — this is a component separation. E-commerce sites often separate “show” (product search and display) from “buy” (shopping cart and online checkout); this is a feature separation. Complex distributed systems may have large numbers of features and components, which are all orchestrated together into one common web or smartphone app experience.
Data splitting (sometimes termed "sharding”) is the concept of “partitioning” from the CAP discussion, above. For example, consider a conference with check-in stations divided by alphabet range; for example:
-
A-H register here
-
I-Q register here
-
R-Z register here
This is a good example of splitting by data. In terms of digital systems, we might split data by region; customers in Minnesota might go to the Kansas City data center, while customers in New Jersey might go to a North Carolina data center. Obviously, the system needs to handle situations where people are traveling or move.
There are many ways to implement and combine the three axes of the AKF scaling cube to meet the CAP constraints (Consistency, Availability, and Partition-tolerance). With further study of scalability, you will encounter discussions of:
-
Load balancing architectures and algorithms
-
Caching
-
Reverse proxies
-
Hardware redundancy
-
Designing systems for continuous availability during upgrades
Evidence of Notability
Operational insights result in requirements for products to be changed. This is an important feedback loop from the operations to the development phase, and a major theme in IT operations management literature. See, for example, [178], "Part I Design: Building It".
Limitations
Operational demand focuses on how the system runs, not what it does. Both, however, are valid concerns for product management.
Related Topics