Work Management
Area Description
When a team or a startup hires its first employees, and increases in size from two people to three or four, it is confronted with the fundamental issue of how work is tracked. The product team is now getting feedback from users calling for prioritization, the allocation of resources, and the tracking of effort and completion. These are the critical day-to-day questions for any business larger than a couple of co-founders:
-
What do we need to do?
-
In what order?
-
Who is doing it?
-
Do they need help?
-
Do they need direction?
-
When will they be done?
-
What do we mean by done?
People have different responsibilities and specialties, yet there is a common vision for delivering an IT-based product of some value. How is the work tracked towards this end? Perhaps the team is still primarily in the same location, but people sometimes are off-site or keeping different hours. Beyond product strategy, the team is getting support calls that result in fixes and new features. The initial signs of too much work-in-progress (slow delivery of final results, multi-tasking, and more) may be starting to appear.
The team has a product owner. They now institute Scrum practices of a managed backlog, daily standups, and sprints. They may also use Kanban-style task boards or card walls (to be described in this Competency Area), which are essential for things like support or other interrupt-driven work. The relationship of these to your Scrum practices is a matter of ongoing debate. In general the team does not yet need full-blown project management (covered in Context III). The concept of "ticketing” will likely arise at this point. How this relates to your Scrum/Kanban approach is a question.
Furthermore, while Agile principles and practices were covered in previous Competency Areas, there was limited discussion of why they work. This Competency Area covers Lean theory of product management that provides a basis for Agile practices; in particular, the work of Don Reinertsen.
The Competency Area title “Work Management” reflects earlier stages of organizational growth. At this point, neither formal project management, nor a fully realized process framework is needed, and the organization may not see a need to distinguish precisely between types of work processes. “It’s all just work” at this stage.
Work Management and Lean
Description
Product development drives a wide variety of work activities. As your product matures, you encounter both routine and non-routine work. Some of the work depends on other work getting done. Sometimes you do not realize this immediately. All of this work needs to be tracked.
Work management may start with verbal requests, emails, even postal mail. If you ask your colleague to do one thing, and she doesn’t have anything else to do, it is likely that the two of you will remember. If you ask her to do four things over a few days, you might both still remember. But if you are asking for new things every day, it is likely that some things will get missed. You each might start keeping your own “to do” list, and this mechanism can handle a dozen or two dozen tasks. Consider an example of three people, each with their own to do list (see Work Flowing Across Three To-Do Lists).
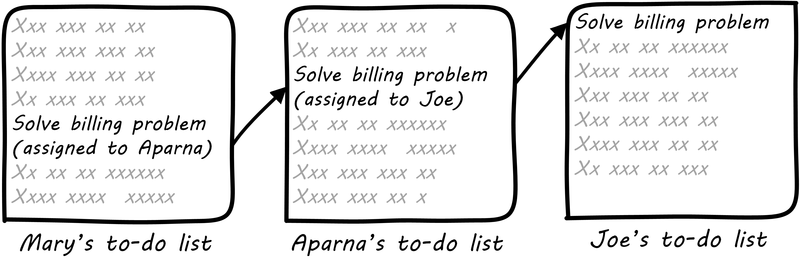
In this situation, each person has their own “mental model” of what needs to be done, and their own tracking mechanism. We don’t know how the work is being transmitted: emails, phone calls, hallway conversations. ("Say, Joe, there is an issue with Customer X’s bill, can you please look into it?”)
But what happens when there are three of you? Mary asks Aparna to do something, and in order to complete it, she needs something from Joe, whom Mary is also asking to complete other tasks. As an organization scales, this can easily lead to confusion and “dropped balls”.
At some point, you need to formalize your model of the work, how it is described, and how it flows. This is such a fundamental problem in human society that many different systems, tools, and processes have been developed over the centuries to address it.
Probably the most important is the shared task reference point. What does this mean? The “task” is made “real” by associating it with a common, agreed artifact.
For example, a “ticket” may be created, or a "work order”. Or a “story”, written down on a sticky note. At our current level of understanding, there is little difference between these concepts. The important thing they have in common is an independent existence. That is, Mary, Aparna, and Joe might all change jobs, but the artifact persists independently of them. Notice also that the artifact — the ticket, the post-it note — is not the actual task, which is an intangible, consensus concept. It is a representation of this intangible “intent to perform”. We will discuss these issues of representation further in Information Management.
A complex IT-based system is not needed if you are all in the same room! (Nor for that matter a complex process framework, such as ITIL or COBIT®. There is a risk in using such frameworks at this stage of evolution — they add too much overhead for your level of growth.) It is also still too early for formal project management. The “project team” would be most or all of the organization, so what would be the point? A shared white board in a public location might be all that is needed (see Common List). This gives the team a “shared mental model” of who is doing what.
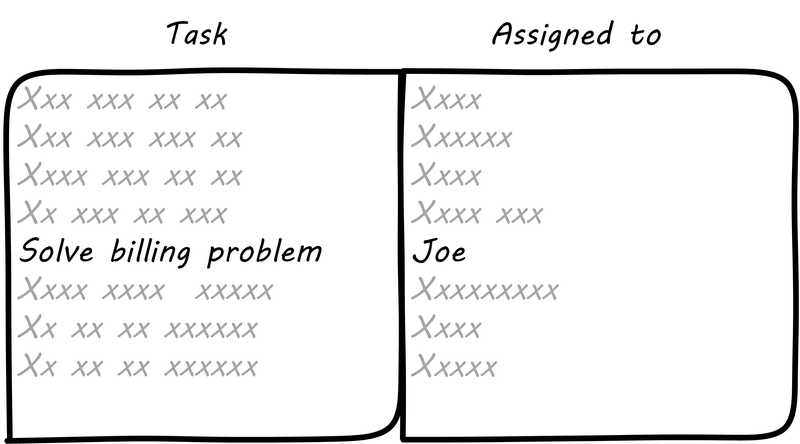
The design of the task board above has some issues, however. After the team gets tired of erasing and rewriting the tasks and their current assignments, they might adopt something more like this:
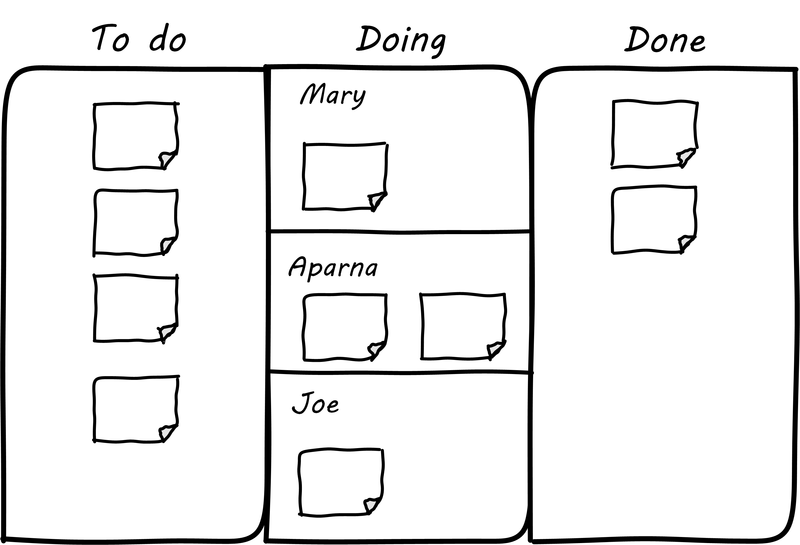
The board itself might be a white board or a cork bulletin board with push pins (see Simple Task Board). The notes could be sticky, or index cards. There are automated solutions as well. The tool doesn’t really matter. The important thing is that, at a glance, the entire team can see its flow of work and who is doing what.
This is sometimes called a “Kanban board”, although David Anderson (originator of the Kanban software method [20]) himself terms the basic technique a "card wall”. It also has been called a "Scrum Board”. The board at its most basic is not specific to either methodology. The term “Kanban” itself derives from Lean manufacturing principles; we will cover this in-depth in the next section. The basic board is widely used because it is a powerful artifact. Behind its deceptive simplicity are considerable industrial experience and relevant theory from operations management and human factors. However, it has scalability limitations. What if the team is not all in the same room? We will cover this and related issues in Context III.
The card wall or Kanban board is the first channel we have for demand management. Demand management is a term meaning “understanding and planning for required or anticipated services or work”. Managing day-to-day incoming work is a form of demand management. Capturing and assessing ideas for next year’s project portfolio (if you use projects) is also demand management at a larger scale.
Lean Background
To understand Kanban we should start with Lean. Lean is a term invented by American researchers who investigated Japanese industrial practices and their success in the 20th century. After the end of World War II, no-one expected the Japanese economy to recover the way it did. The recovery is credited to practices developed and promoted by Taiichi Ohno and Shigeo Shingo at Toyota [212]. These practices included:
-
Respect for people
-
Limiting work-in-process
-
Small batch sizes (driving towards “single piece flow”)
-
Just-in-time production
-
Decreased cycle time
Credit for Lean is also sometimes given to US thinkers such as W. Edwards Deming, Peter Juran, and the theorists behind the Training Within Industry methodology, each of whom played influential roles in shaping the industrial practices of post-war Japan.
Kanban is a term originating from Lean and the Toyota Production System. Originally, it signified a “pull” technique in which materials would only be transferred to a given workstation on a definite signal that the workstation required the materials. This was in contrast to “push” approaches where work was allowed to accumulate on the shop floor, on the (now discredited) idea that it was more “efficient” to operate workstations at maximum capacity.
Factories operating on a “push” model found themselves with massive amounts of inventory (work-in-process) in their facilities. This tied up operating capital and resulted in long delays in shipment. Japanese companies did not have the luxury of large amounts of operating capital, so they started experimenting with "single-piece flow”. This led to a number of related innovations, such as the ability to re-configure manufacturing machinery much more quickly than US factories were capable of.
David J. Anderson was a product manager at Microsoft who was seeking a more effective approach to managing software development. In consultation with Don Reinertsen (introduced below) he applied the original concept of Kanban to his software development activities [20].
Scrum (covered in the previous chapter) is based on a rhythm with its scheduled sprints; for example, every two weeks (this is called cadence). In contrast, Kanban is a continuous process with no specified rhythm. Work is “pulled” from the backlog into active attention as resources are freed from previous work. This is perhaps the most important aspect of Kanban — the idea that work is not accepted until there is capacity to perform it.
You may have a white board covered with sticky notes, but if they are stacked on top of each other with no concern for worker availability, you are not doing Kanban. You are accepting too much work-in-process, and you are likely to encounter a “high-queue state” in which work becomes slower and slower to get done. (More on queues below.)
The Theory of Constraints
Eliyahu Moshe Goldratt was an Israeli physicist and management consultant, best known for his pioneering work in management theory, including The Goal, which is a best-selling business novel frequently assigned in MBA programs. It and Goldratt’s other novels have had a tremendous effect on industrial theory and, now, digital management. One of the best known stories in The Goal centers around a Boy Scout march. Alex, the protagonist struggling to save his manufacturing plant, takes a troop of Scouts on a ten-mile hike. The troop has hikers of various speeds, yet the goal is to arrive simultaneously. As Alex tries to keep the Scouts together, he discovers that the slowest, most overweight scout (Herbie) also has packed an unusually heavy backpack. The contents of Herbie’s pack are redistributed, speeding up both Herbie and the troop.
This story summarizes the Goldratt approach: finding the “constraint” to production (his work as a whole is called the Theory of Constraints). In Goldratt’s view, a system is only as productive as its constraint. At Alex’s factory, it is found that the “constraint” to the overall productivity issues is the newest computer-controlled machine tool — one that could (in theory) perform the work of several older models but was now jeopardizing the entire plant’s survival. The story in this novelization draws important parallels with actual Lean case studies on the often-negative impact of such capital-intensive approaches to production.
The Shared Mental Model of the Work to be Done
Joint activity depends on interpredictability of the participants’ attitudes and actions. Such interpredictability is based on common ground — pertinent knowledge, beliefs, and assumptions that are shared among the involved parties. [167]
“Common Ground and Coordination in Joint Activity"
The above quote reflects one of the most critical foundations of team collaboration: a common ground, a base of “knowledge, beliefs, and assumptions” enabling collaboration and coordination. Common ground is an essential quality of successful teamwork, and we will revisit it throughout the book. There are many ways in which common ground is important, and we will discuss some of the deeper aspects in terms of information in Information Management. Whether you choose Scrum, Kanban, or choose not to label your work management at all, the important thing is that you are creating a shared mental model of the work: its envisioned form and content, and your progress towards it.
Below, we will discuss:
-
Visualization of work
-
The concept of Andon
-
The definition of done
-
Time and space shifting
Visualization is a good place to introduce the idea of common ground.
Visualization
As simple as the white board is, it makes work-in-progress continuously visible, it enforces work-in-progress constraints, it creates synchronized daily interaction, and it promotes interactive problem solving. Furthermore, teams evolve methods of using white boards continuously, and they have high ownership in their solution. In theory, all this can be replicated by a computer system. In practice, I have not yet seen an automated system that replicates the simple elegance and flexibility of a manual system.
Principles of Product Development Flow
Why are shared visual representations important? Depending on how you measure, between 40% to as much as 80% of the human cortex is devoted to visual processing. Visual processing dominates mental activity, consuming more neurons than the other four senses combined [252]. Visual representations are powerful communication mechanisms, well suited to our cognitive abilities.
This idea of common ground, a shared visual reference point, informing the mental model of the team, is an essential foundation for coordinating activity. This is why card walls or Kanban boards located in the same room are so prevalent. They communicate and sustain the shared mental model of a human team. A shared card wall, with its two dimensions and tasks on cards or sticky notes, is more informative than a simple to-do list (e.g., in a spreadsheet). The cards occupy two-dimensional space and are moved over time to signify activity, both powerful cues to the human visual processing system.
Similarly, monitoring tools for systems operation make use of various visual clues. Large monitors may be displayed prominently on walls so that everyone can understand operational status. Human visual orientation is also why Enterprise Architecture persists. People will always draw to communicate. (See also visualization and Enterprise Architecture.)
Card walls and publicly displayed monitors are both examples of information radiators. The information radiator concept derives from the Japanese concept of Andon, important in Lean thinking.
Andon, and the Andon Cord
The Andon cord (not to be confused with Andon in the general sense) is another well-known concept in Lean manufacturing. It originated with Toyota, where line workers were empowered to stop the production line if any defective materials or assemblies were encountered. Instead of attempting to work with the defective input, the entire line would shut down, and all concerned would establish what had happened and how to prevent it. The concept of Andon cord concisely summarizes the Lean philosophy of employee responsibility for quality at all levels [212]. Where Andon is a general term for information radiator, the Andon cord implies a dramatic response to the problems of flow — all progress is stopped, everywhere along the line, and the entire resources of the production line are marshaled to collaboratively solve the issue so that it does not happen again. As Toyota thought leader Taiichi Ohno states:
Stopping the machine when there is trouble forces awareness on everyone. When the problem is clearly understood, improvement is possible. Expanding this thought, we establish a rule that even in a manually operated production line, the workers themselves should push the stop button to halt production if any abnormality appears.
Andon and information radiators provide an important stimulus for product teams, informing priorities and prompting responses. They do not prescribe what is to be done; they simply indicate an operational status that may require attention.
Definition of Done
As work flows through the system performing it, understanding its status is key to managing it. One of the most important mechanisms for doing this is to define what is meant by “done simply”. The Agile Alliance states:
“The team agrees on, and displays prominently somewhere in the team room, a list of criteria which must be met before a product increment, often a user story, is considered “done” [9]. Failure to meet these criteria at the end of a sprint normally implies that the work should not be counted toward that sprint’s velocity.” There are various patterns for defining “done”; for example, Thoughtworks recommends that the business analyst and developer both must agree that some task is complete (it is not up to just one person). Other companies may require peer code reviews [206]. The important point is that the team must agree on the criteria.
This idea of defining “done” can be extended by the team to other concepts such as “blocked”. The important thing is that this is all part of the team’s shared mental model, and is best defined by the team and its customers. (However, governance and consistency concerns may arise if teams are too diverse in such definitions.)
Time and Space Shifting
At some point, your team will be faced with the problems of time and/or space shifting. People will be on different schedules, or in different locations, or both. There are two things we know about such working relationships. First, they lead to sub-optimal team communications and performance. Second, they are inevitable.
The need for time and space shifting is one of the major drivers for more formalized IT systems. It is difficult to effectively use a physical Kanban board if people aren’t in the office. The outcome of the daily standup needs to be captured for the benefit of those who could not be there.
However, acceptance of time and space shifting may lead to more of it, even when it is not absolutely required. Constant pressure and questioning are recommended, given the superior bandwidth of face-to-face communication in the context of team collaboration.
But not all work requires the same degree of collaboration. While we are still not ready for full-scale process management, at this point in our evolution, we likely will encounter increasing needs to track customer or user service interactions, which can become quite numerous even for small, single-team organizations. Such work is often more individualized and routine, not requiring the full bandwidth of team collaboration. We will discuss this further with the topic of the help or service desk, later in this Competency Area.
Queues and Limiting Work-in-Process
Even at this stage of our evolution, with just one co-located collaborative team, it is important to consider work-in-process and how to limit it. One topic we will emphasize throughout the rest of this document is queuing.
A queue, intuitively, is a collection of tasks to be done, being serviced by some worker or resource in some sequence; for example:
-
Feature “stories” being developed by a product team
-
Customer requests coming into a service desk
-
Requests from a development team to an infrastructure team for services (e.g., network or server configuration, consultations, etc.)
Queuing theory is an important branch of mathematics used extensively in computing, operations research, networking, and other fields. It is a topic getting much attention of late in the Agile and related movements, especially as it relates to digital product team productivity.
The amount of time that any given work item spends in the queue is proportional to how busy the servicing resource is. The simple formula, known as Little’s Law, is:
Wait time = (% Busy)/(% Idle)
In other words, if you divide the percentage of busy time for the resource by its idle time, you see the average wait time. So, if a resource is busy 40% of the days, but idle 60% of the days, the average time you wait for the resource is:
0.4/0.6= 0.67 hours (2/3 of a day)
Conversely, if a resource is busy 95% of the time, the average time you will wait is:
0.95/0.05 = 5.67 (19 days!)
If you use a graphing calculator, you see the results in Time in Queue Increases Exponentially with Load.
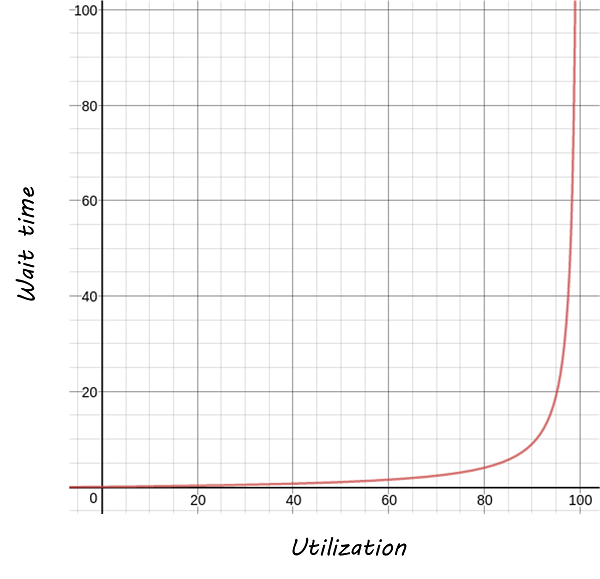
Notice how the wait time approaches infinity as the queue utilization approaches 100%. And yet, full utilization of resources is often sought by managers in the name of “efficiency”. These basic principles are discussed by Gene Kim et al. in The Phoenix Project [165], Chapter 23, and more rigorously by Don Reinertsen in The Principles of Product Development Flow [230], Chapter 3. A further complication is when work must pass through multiple queues; wait times for work easily expand to weeks or months. Such scenarios are not hypothetical, they are often seen in the real world and are a fundamental cause of IT organizations getting a bad name for being slow and unresponsive. Fortunately, Digital Practitioners are gaining insight into these dynamics and matters are improving across the industry.
Understanding queuing behavior is critical to productivity. Reinertsen suggests that poorly managed queues contribute to:
-
Longer cycle time
-
Increased risk
-
More variability
-
More overhead
-
Lower quality
-
Reduced motivation
These issues were understood by the pioneers of Lean manufacturing, an important movement throughout the 20th century. One of its central principles is to limit work-in-process. Work-in-process is obvious on a shop floor because physical raw materials (inventory) are quite visible.
Don Reinertsen developed the insight that product design and development had an invisible inventory of “work-in-process” that he called design-in-process. Just as managing physical work-in-process on the factory floor is key to a factory’s success, so correctly understanding and managing design-in-process is essential to all kinds of R&D organizations — including digital product development; e.g., building software(!). In fact, because digital systems are largely invisible even when finished, understanding their work-in-process is even more challenging.
It is easy and tempting for a product development team to accumulate excessive amounts of work-in-process. And, to some degree, having a rich backlog of ideas is an asset. But, just as some inventory (e.g., groceries) is perishable, so are design ideas. They have a limited time in which they might be relevant to a customer or a market. Therefore, accumulating too many of them at any point in time can be wasteful.
What does this have to do with queuing? Design-in-progress is one form of queue seen in the digital organization. Other forms include unplanned work (incidents and defects), implementation work, and many other concepts we will discuss in this chapter.
Regardless of whether it is a “requirement”, a “user story”, an “epic”, “defect", “issue”, or “service request”, you should remember it is all just work. It needs to be logged, prioritized, assigned, and tracked to completion. Queues are the fundamental concept for doing this, and it is critical that digital management specialists understand this.
Multi-Tasking
Multi-tasking (in this context) is when a human attempts to work on diverse activities simultaneously; for example, developing code for a new application while also handling support calls. There is broad agreement that multi-tasking destroys productivity, and even mental health [57]. Therefore, minimize multi-tasking. Multi-tasking in part emerges as a natural response when one activity becomes blocked (e.g., due to needing another team’s contribution). Approaches that enable teams to work without depending on outside resources are less likely to promote multi-tasking. Queuing and work-in-process therefore become even more critical topics for management concern as activities scale up.
Scrum, Kanban, or Both?
So, do you choose Scrum, Kanban, both, or neither? We can see in comparing Scrum and Kanban that their areas of focus are somewhat different:
-
Scrum is widely adopted in industry and has achieved a level of formalization, which is why Scrum training is widespread and generally consistent in content
-
Kanban is more flexible but this comes at the cost of more management overhead; it requires more interpretation to translate to a given organization’s culture and practices
-
As Scrum author Ken Rubin notes: “Scrum is not well suited to highly interrupt-driven work” [243]; Scrum on the service desk doesn’t work (but if your company is too small, it may be difficult to separate out interrupt-driven work; we will discuss the issues around interrupt-driven work further in Operations Management)
-
Finally, hybrids exist (Ladas' “Scrumban” [172])
Ultimately, instead of talking too much about “Scrum” or “Kanban”, the student is encouraged to look more deeply into their fundamental differences. We will return to this topic in the section on Lean Product Development.
Lean Guidelines
-
Finish what you start, if you can, before starting anything else - when you work on three things at once, the multi-tasking wastes time, and it takes you three times longer to get any one of the things done (more on multi-tasking in this chapter)
-
Infinitely long to-do lists (backlog) sap motivation - consider limiting backlog as well as work-in-process
-
Visibility into work-in-process is important for the collective mental model of the team
There are deeper philosophical and cultural qualities to Kanban beyond workflow and queuing. Anderson and his colleagues continue to evolve Kanban into a more ambitious framework. Mike Burrows [48] identifies the following key principles:
-
Start with what you do now
-
Agree to pursue evolutionary change
-
Initially, respect current processes, roles, responsibilities, and job titles
-
Encourage acts of leadership at every level in your organization — from individual contributor to senior management
-
Visualize
-
Limit work-in-progress
-
Manage flow
-
Make policies explicit
-
Implement feedback loops
-
Improve collaboratively, evolve experimentally (using models and the scientific method)
Evidence of Notability
Work and task management is a fundamental problem in human organizations. It is the foundation of workflow and BPM. Lean generally is one of the most significant currents of thought in modern management [212, 307, 308, 239, 238]. Kanban is widely discussed at Agile and DevOps conferences. Using a lightweight, generalized task tracking tool, often physical, is seen in digital organizations worldwide.
Limitations
Kanban’s generalized workflow does not scale to complex processes with many steps and decision points. This will be covered further in the section on workflow management. Not all activities reduce well to a list of tasks. Some are more intangible and outcome-focused. As Bjarne Stroustrup, the inventor of C+, stated: "The idea of software development as an assembly line manned by semi-skilled interchangeable workers is fundamentally flawed and wasteful" +[271]. It is critical to distinguish Lean as applied to digital systems development (as a form of applied R&D) versus Lean in its manufacturing aspects. Reinertsen’s contributions ([229, 230]) are unique and notable in this regard and are discussed in the next section.
Related Topics
Lean Product Development
Description
One of the challenges with applying Lean to IT (as noted previously) is that many IT professionals (especially software developers) believe that manufacturing is a “deterministic” field, whose lessons don’t apply to developing technical products. “Creating software is like creating art, not being on an assembly line”, is one line of argument.
The root cause of this debate is the distinction between product development and production. It is true that an industrial production line - for example, producing forklifts by the thousands - may be repetitive. But how did the production line come to be? How was the forklift invented, or developed? It was created as part of a process of product development. It took mechanical engineering, electrical engineering, chemistry, materials science, and more. Combining fundamental engineering principles and techniques into a new, marketable product is not a repetitive process; it is a highly variable, creative process, and always has been.
One dead end that organizations keep pursuing is the desire to make R&D more “predictable"; that is, to reduce variation and predictably create innovation. This never works well; game-changing innovations are usually complex responses to complex market systems dynamics, including customer psychology, current trends, and many other factors. The process of innovating cannot, by its very nature, be made repeatable.
Developing innovative products and services drives the enterprise’s growth. The future enterprise’s performance is largely determined by the quality of product development. Products and services that fit market needs generate more profitable growth. Designing efficient product delivery processes determines up to 70% of your run or production costs.
Lean Product and Process Development (or LPPD) is not just applying Lean tools from the manufacturing floor to the LPPD environment. It is a unique set of principles, methods, and tools that build on the experience of enterprises such as Toyota, Ford, or Harley-Davidson.
The key characteristics of LPPD are:
-
Clear definition of value from a customer perspective to inform product development from start to finish
-
Chief Engineer system that integrates cross-functional expertise to architect a product that delivers value to customers and contributes to the economic success of the enterprise
-
Front-loading the development process to explore thoroughly alternative solutions while there is maximum design space
-
Set-Based Concurrent Engineering (SBCE) to facilitate the smooth integration of products' components
-
High degree of teamwork facilitated by the Obeya process
-
Knowledge and responsibility-based approach with planned learning cycles
-
Levelled workload through Cadence, Pull, and Flow
Define Value from a Customer Perspective
One of the Lean Product Development practices is "Go & See". Instead of relying on secondary information such as market studies or marketing reports (as also discussed in Product Discovery), product team members are encouraged to experience first hand customers' needs, problems, and emotions. For example, one of the Toyota Chief Engineers rented a car in Canada and drove for several months in the winter time to understand the unique needs of the Canadian driver. Design thinking possibly combined with anthropological approaches help understand value from a customer’s perspective.
The Chief Engineer System
Toyota’s Chief Engineers are not program managers who focus on controlling and reporting development activities. They are leaders who create and communicate a compelling and feasible vision. They define a clear and logical architecture for the product and value stream. Their T-shaped profile gives them enough understanding of the various disciplines at play so they can help solve cross-disciplinary problems. Chief Engineers are accountable for the economic success of their products. Last but not the least, their leadership skills help them inspire excellent engineers. The Chief Engineer does not have formal authority on the teams that develop the product. Team members report to functional department heads. New Agile at scale organizational models such as the Spotify model are similar with teams members reporting to chapters or guilds and not squad leaders. The Product Owner plays a role comparable to the Chief Engineer’s one at a smaller scale.
Front Load the Development Process
Poor decisions made early in the development process have negative consequences that increase exponentially over time because reversing them later in the lifecycle becomes more and more difficult. Amazon CEO Jeff Bezos classifies decisions into type 1 and type 2 categories [35]. Type 1 decisions are not reversible, and you have to be very careful making them. Type 2 decisions are like walking through a door — if you don’t like the decision, you can always go back. Because type 1 decisions are difficult to reverse, alternatives should be thoroughly explored before the final decision is made. This tendency to front load the development process could slow the development process.
Set-Based Concurrent Engineering
Set-Based Concurrent Engineering or SBCE makes front loading compatible with short product development lead times. Instead of focusing on the rapid completion of individual component designs in isolation, SBCE looks at how individual designs will interact within a system before the design is complete. The focus is on system integration before individual design completion. The concurrent nature of the design process contributes to shortening product development lead time while front loading combined with the integration focus helps minimize bad design decisions which would at the end slow the development process and increase "non-quality". A good metaphor for SBCE is doodle.com which offers a much better way of scheduling a meeting compared to the old iterative "point-based" way of finding a time that works for all.
The Obeya Process
We introduced the concept of Andon previously. Lean Product Development has a similar practice, Obeya. The Obeya process begins with the entire team posting in a physical room visual artifacts representing the product’s components. Product component owners are responsible for posting status information such as timing, issues, key design questions, etc. Because the information is shared in a transparent manner, useful conversations are elicited. When problems are identified they are analyzed using problem solving approaches such as PDCA and A3. Collocation greatly intensifies communication and helps solve problems earlier. One of the advantages of the Obeya process is that it does not force the enterprise to change its departmental organization or to co-locate hundreds of engineers. When an Obeya room cannot be set up at the same place, virtual ones can be created using specialized collaborative software. The Obeya process proved to be a critical element of the Toyota product development system helping radically reduce lead time.
Knowledge and Responsibility-Based
Traditional task-based project management is based on tasks completed and not on technical results. Because project managers do not understand the reality that hides behind the Gantt chart, problems can remain hidden for a long time. In contrast, the Chief Engineer defines integrating events at fixed dates. Required results are communicated to responsible engineers who are free to plan and organize as needed to meet these dates and deliver expected results. Top-down detailed planning and control is replaced by top-down objectives, the detailed planning and execution being delegated to autonomous teams. The responsibility style helps develop a learning development organization. Bureaucracy is eliminated and the creation of useful knowledge encouraged.
Levelled Workload through Cadence, Pull, and Flow
Unevenness (Mura) and overburden (Muri) are root causes of waste (Muda) in both production and development value streams. In the context of LPPD work should be released in the organization on a regular cadence in order to level the workload. Integrating events gives freedom to developers to plan their work to meet those events. In this way development work is pulled (as covered in the Kanban discussion) rather than scheduled. Similarly information is pulled by developers based on what they need to know rather than being pushed according to some centrally planned schedule. Don Reinertsen, the author of The Principles of Product Development Flow, proposes a method to maximize the economic benefit of a portfolio of projects. The key idea is that the sequencing of projects should consider both the cost of delay of each project and the amount of time that the project will block scarce development resources. This approach is known as a Weighted Shortest Job First (WSJF) queueing discipline. It has influenced the Agile community; SAFe specifies WSJF to prioritize backlogs.
Reinertsen’s Product Flow Model
In IT, simply developing software for a new problem (or even new software for an old problem) is an R&D problem, not a production line problem. It is iterative, uncertain, and risky, just like other forms of product development. That does not mean it is completely unmanageable, or that its creation is a mysterious, artistic process. It is just a more variable process with a higher chance of failure, and with a need to incorporate feedback quickly to reduce the risk of open-loop control failure. These ideas are well known to the Agile community and its authors. However, there is one thought leader who stands out in this field: an ex-Naval officer and nuclear engineer named Donald Reinertsen who was introduced in our previous discussions on beneficial variability in product discovery and queuing.
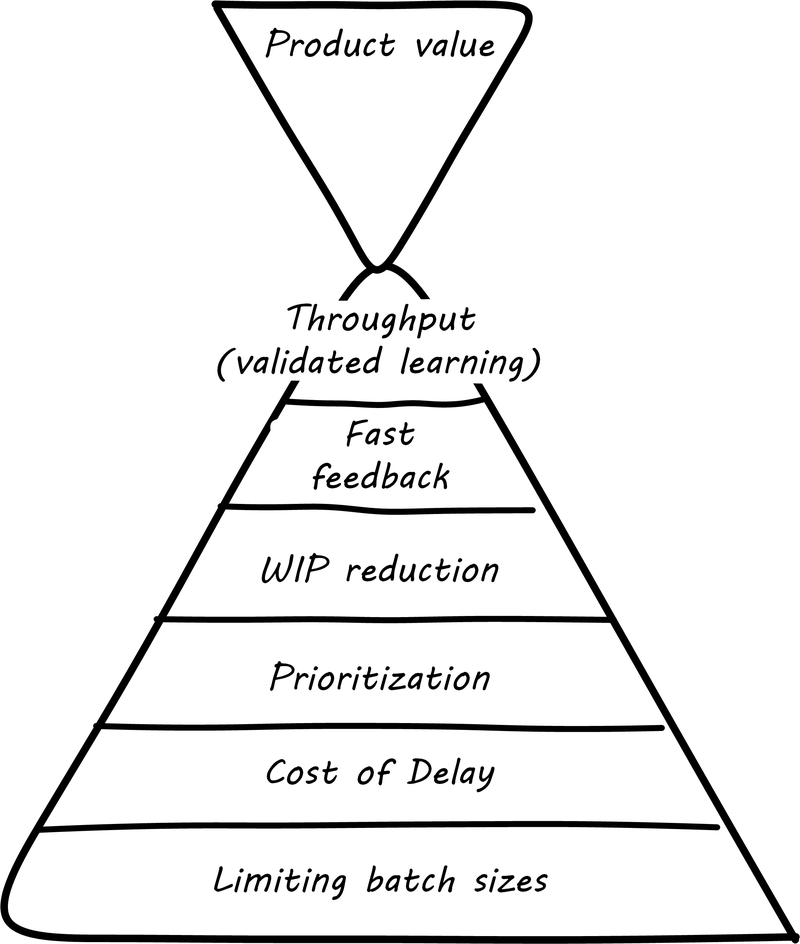
Reinertsen’s work dates back to 1991, and (originally as a co-author with Preston G. Smith) presaged important principles of the Agile movement [263], from the general perspective of product development. Reinertsen’s influence is well documented and notable. He was partnering with David Anderson when Anderson created the “software Kanban” approach. He wrote the introduction to Leffingwell’s Agile Software Requirements, the initial statement of SAFe. His influence is pervasive in the Agile community. His work is deep and based on fundamental mathematical principles such as queueing theory. His work can be understood as a series of interdependent principles:
-
The flow or throughput of product innovation is the primary driver of financial success (notice that innovation must be accepted by the market — simply producing a new product is not enough)
-
Product development is essentially the creation of information
-
The creation of information requires fast feedback
-
Feedback requires limiting work-in-process
-
Limiting work-in-process in product design contexts requires rigorous prioritization capabilities
-
Effective, economical prioritization requires understanding the cost of delay for individual product features
-
Understanding cost of delay requires smaller batch sizes, consisting of cohesive features, not large projects (this supporting point to Reinertsen’s work was introduced by Josh Arnold [22])
These can be summarized as in Lean Product Development Hierarchy of Concerns.
If a company wishes to innovate faster than competitors, it requires fast feedback on its experiments (whether traditionally understood, laboratory-based experiments, or market-facing validation as in Lean Startup. In order to achieve fast feedback, work-in-process must be reduced in the system, otherwise high-queue states will slow feedback down.
But how do we reduce work-in-process? We have to prioritize. Do we rely on the HiPPO, or do we try something more rational? This brings us to the critical concept of cost of delay.
Cost of Delay
Don Reinertsen is well known for advocating the concept of “cost of delay” in understanding product economics. The term is intuitive; it represents the loss experienced by delaying the delivery of some value. For example, if a delayed product misses a key trade show, and therefore its opportunity for a competitive release, the cost of delay might be the entire addressable market. Understanding cost of delay is part of a broader economic emphasis that Reinertsen brings to the general question of product development. He suggests that product developers, in general, do not understand the fundamental economics of their decisions regarding resources and work-in-process.
In order to understand the cost of delay, it is first necessary to think in terms of a market-facing product (such as a smartphone application). Any market-facing product can be represented in terms of its lifecycle revenues and profits (see Product Lifecycle Economics by Year, Product Lifecycle Economics, Charted).
| Year | Annual Cost | Annual Revenue | Annual Profit | Cumulative Profit |
|---|---|---|---|---|
Year 1 |
100 |
0 |
–100 |
–100 |
Year 2 |
40 |
80 |
40 |
–60 |
Year 3 |
30 |
120 |
90 |
30 |
Year 4 |
25 |
150 |
125 |
155 |
Year 5 |
25 |
90 |
65 |
220 |
Year 6 |
20 |
60 |
40 |
260 |
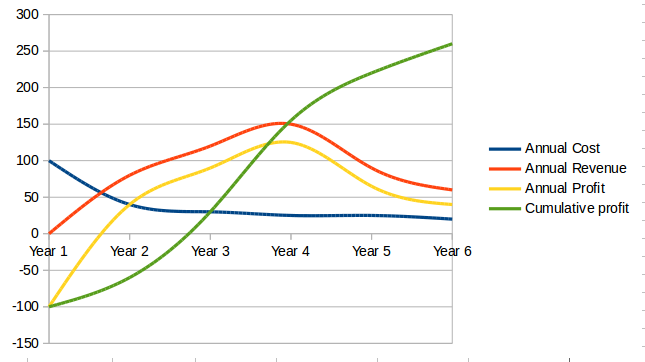
The numbers above represent a product lifecycle, from R&D through production to retirement. The first year is all cost, as the product is being developed, and net profits are negative. In year 2, a small net profit is shown, but cumulative profit is still negative, as it remains in year 3. Only into year 3 does the product break even, ultimately achieving lifecycle net earnings of 175. But what if the product’s introduction into the market is delayed? The consequences can be severe.
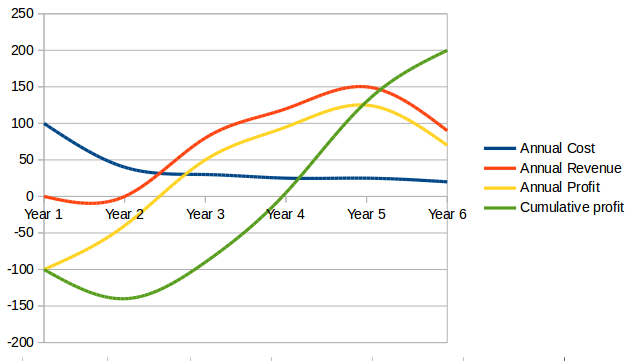
Simply delaying delivery by a year, all things being equal in our example, will reduce lifecycle profits by 30% (see Product Lifecycle, Simple Delay, Product Lifecycle, Simple Delay, Charted).
| Year | Annual Cost | Annual Revenue | Annual Profit | Cumulative Profit |
|---|---|---|---|---|
Year 1 |
100 |
0 |
–100 |
–100 |
Year 2 |
40 |
0 |
–40 |
–140 |
Year 3 |
30 |
80 |
50 |
–90 |
Year 4 |
25 |
120 |
95 |
5 |
Year 5 |
25 |
150 |
125 |
130 |
Year 6 |
20 |
90 |
70 |
200 |
But all things are not equal. What if, in delaying the product for a year, we allow a competitor to gain a superior market position? That could depress our sales and increase our per-unit costs — both bad (see Product Lifecycle, Aggravated Delay, Product Lifecycle, Aggravated Delay, Charted).
| Year | Annual Cost | Annual Revenue | Annual Profit | Cumulative Profit |
|---|---|---|---|---|
Year 1 |
100 |
0 |
–100 |
–100 |
Year 2 |
40 |
0 |
–40 |
–140 |
Year 3 |
35 |
70 |
35 |
–105 |
Year 4 |
30 |
100 |
70 |
–35 |
Year 5 |
30 |
120 |
90 |
55 |
Year 6 |
25 |
80 |
55 |
110 |
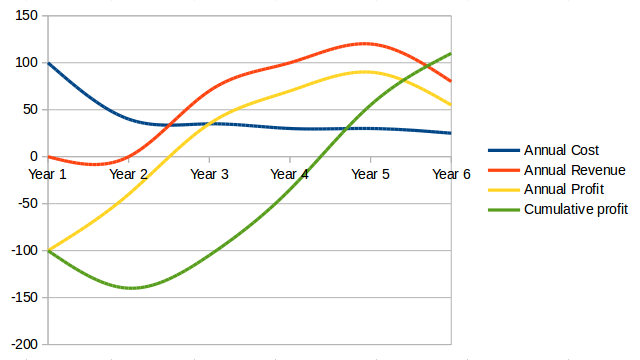
The advanced cost of delayed analysis argues that different product lifecycles have different characteristics. Josh Arnold of Black Swan Farming has visualized these as a set of profiles [22]. See Simple Cost of Delay (similar to [22]) for the simple delay profile.
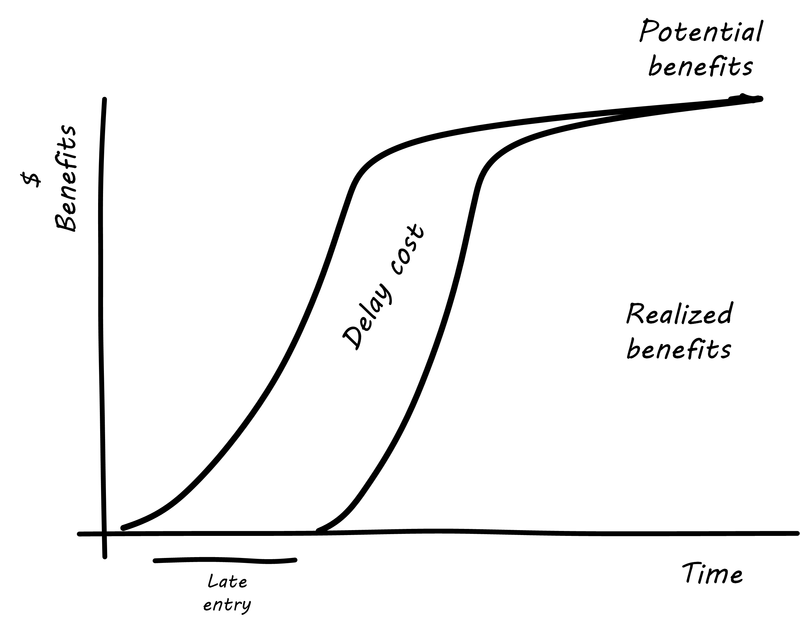
In this delay curve, while profits and revenues are lost due to late entry, it is assumed that the product will still enjoy its expected market share. We can think of this as the “iPhone versus Android” profile, as Android was later but still achieved market parity. The aggravated cost of delay profile, however, looks like Aggravated Cost of Delay (similar to [22]).
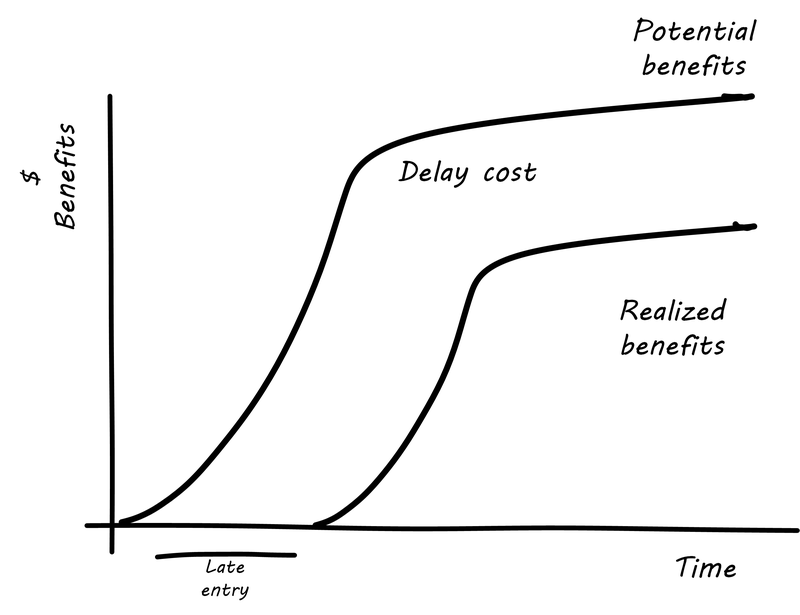
In this version, the failure to enter the market in a timely way results in long-term loss of market share. We can think of this as the “Amazon Kindle™ versus Barnes & Noble Nook” profile, as the Nook has not achieved parity, and does not appear likely to. There are other delay curves imaginable, such as delay curves for tightly time-limited products (e.g., such as found in the fashion industry) or cost of delay that is only incurred after a specific date (such as in complying with a regulation).
Reinertsen observes that product managers may think that they intuitively understand cost of delay, but when he asks them to estimate the aggregate cost of (for example) delaying their product’s delivery by a given period of time, the estimates provided by product team participants in a position to delay delivery may vary by up to 50:1. This is powerful evidence that a more quantitative approach is essential, as opposed to relying on “gut feel” or the HiPPO.
Finally, Josh Arnold notes that cost of delay is much easier to assess on small batches of work. Large projects tend to attract many ideas for features, some of which have stronger economic justifications than others. When all these features are lumped together, it makes understanding the cost of delay a challenging process, because it then becomes an average across the various features. But since features, ideally, can be worked on individually, understanding the cost of delay at that level helps with the prioritization of the work.
The combination of product roadmapping, a high-quality DEEP backlog, and cost of delay is a solid foundation for digital product development. It is essential to have an economic basis for making the prioritization decision. Clarifying the economic basis is a critical function of the product roadmap. Through estimation of story points, we can understand the team’s velocity. Estimating velocity is key to planning, which we will discuss further in Investment and Portfolio. Through understanding the economics of product availability to the market or internal users, the cost of delay can drive backlog prioritization.
Evidence of Notability
Lean influences on software development and the management of digital systems are the subject of conference talks, books, and articles, and much other evidence demonstrating an engaged community of interest. Notable works include [165, 20, 221, 27, 230].
Limitations
Lean has broad applicability but the nature of the digital work must be understood carefully. Classic Lean applies well to less-variable operational work in digital systems. Developing new digital systems requires Lean Product Development principles, and some aspects of classic Lean (e.g., always reducing variability) are less applicable or may even be harmful. See, for example, [230] for further discussion (Chapter 4, "The Economics of Product Development Variability").
Related Topics
Work Management Capabilities and Approaches
Description
As a digital product starts to gain a user base, and as a company matures and grows, there emerges a need for human-to-human support. This is typically handled by a help desk or service desk, serving as the human face of IT when the IT systems are not meeting people’s expectations. We were first briefly introduced to the concept in our Service Lifecycle (see The Essential States of the Digital Product).
The service desk is an interrupt-driven, task-oriented capability. It serves as the first point of contact for IT services that require some human support or intervention. As such, its role can become broad from provisioning access to assisting users in navigation and usage, to serving as an alert channel for outage reporting. The service desk ideally answers each user’s request immediately, requiring no follow-up. If follow-up is required, a “ticket” is “issued”.
As a “help desk”, it may be focused on end-user assistance and reporting incidents. As a “service desk”, it may expand its purview to accepting provisioning or other requests of various types (and referring and tracking those requests). Note that in some approaches, service request and incident are considered to be distinct processes.
The term "ticket” dates to paper-based industrial processes, where the “help desk” might actually be a physical desk, where a user seeking services might be issued a paper ticket. Such “tickets” were also used in field services.
In IT-centric domains, tickets are virtual; they are records in databases, not paper. The user is given a ticket “ID” or “number” for tracking (e.g., so they can inquire about the request’s status). The ticket may be “routed” to someone to handle, but again in a virtual world what really happens is that the person it is routed to is directed to look at the record in the database. (In paper-based processes, the ticket might well be moved physically to various parties to perform the needed work.)
A service desk capability needs:
-
Channels for accepting contacts (e.g., telephone, email, chat)
-
Staffing appropriate to the volume and nature of those requests
-
Robust workflow capabilities to track their progress
-
Routing and escalation mechanisms, since clarifying the true nature of contacts and getting them serviced by the most appropriate means are non-trivial challenges
Work management in practice has divided between development and operations practices and tools. However, DevOps and Kanban are forcing a reconsideration and consolidation. Historically, here are some of the major tools and channels through which tasks and work are managed on both sides:
| Development | Operations |
|---|---|
User story tracking system |
Service or help desk ticketing system |
Issue/risk/action item log |
Incident management system |
Defect tracker |
Change management system |
All of these systems have common characteristics. All can (or should) be able to:
-
Register a new task
-
Describe the work to be done (development or break/fix/remediate)
-
Represent the current status of the work
-
Track who is currently accountable for it (individual and/or team)
-
Indicate the priority of the work, at least in terms of a simple categorization such as high/medium/low
More advanced systems may also be able to:
-
Link one unit of work to another (either as parent/child or peer-to-peer)
-
Track the effort spent on the work
-
Prioritize and order work
-
Track the referral or escalation trail of the work, if it is routed to various parties
-
Link to communication channels such as conference bridges and paging systems
The first automated system (computer-based) you may find yourself acquiring along these lines is a help desk system. You may be a small company, but when you start to build a large customer base, keeping them all happy requires more than a manual, paper-based card wall or Kanban board.
Towards Process Management
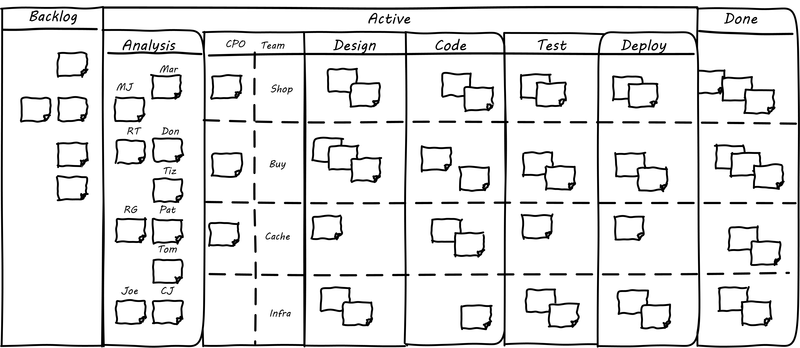
The Kanban board has started to get complicated (see Medium-Complex Kanban Board, loosely based on Image from [171]). We are witnessing an increasing amount of work that needs to follow a sequence, or checklist, for the sake of consistency.
Process management is when we need to start managing:
-
Multiple
-
Repeatable
-
Measurable sequences of activity
-
Considering their interdependencies
-
Perhaps using common methods to define them
-
And even common tooling to support multiple processes
Process Basics
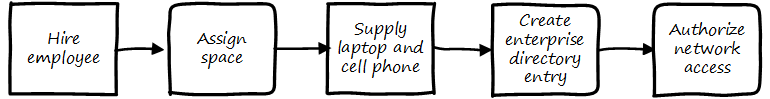
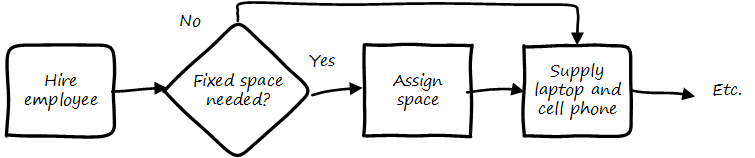
We have discussed some of the factors leading to the need for process management, but we have not yet come to grips with what it is. To start, think of a repeatable series of activities, such as when a new employee joins (see Simple Process Flow).
Process management can represent conditional logic (see Conditionality).
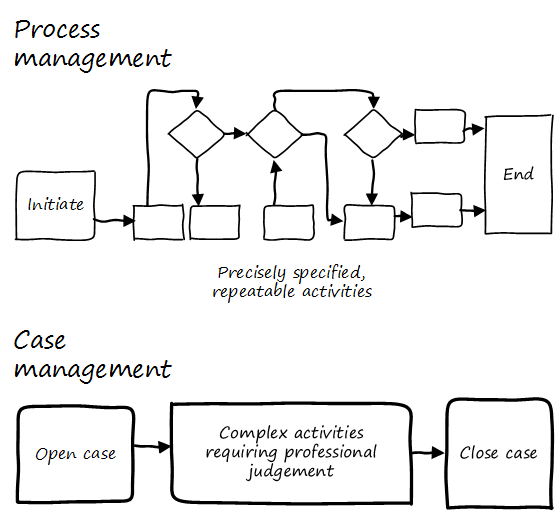
Process models can become extremely intricate, and can describe both human and automated activity. Sometimes, the process simply becomes too complicated for humans to follow. Notice how different the process models are from the card wall or Kanban board. In Kanban, everything is a work item, and the overall flow is some simple version of “to do, doing, done”. This can become complex when the flow gets more elaborate (e.g., various forms of testing, deployment checks, etc.). In a process model, the activity is explicitly specified on the assumption it will be repeated. The boxes representing steps are essentially equivalent to the columns on a Kanban board, but since sticky notes are not being used, process models can become very complex — like a Kanban board with dozens or hundreds of columns! Process management as a practice is discussed extensively in Context III. However, before we move on, two simple variations on process management are:
-
Checklists
-
Case Management
The Checklist Manifesto
The Checklist Manifesto is the name of a notable book by author/surgeon Atul Gawande [109]. The title can be misleading; the book in no way suggests that all work can be reduced to repeatable checklists. Instead, it is an in-depth examination of the relationship between standardization and complexity. Like Case Management, it addresses the problem of complex activities requiring professional judgment.
Unlike Case Management (discussed below), it explores more time-limited and often urgent activities such as flight operations, large-scale construction, and surgery. These activities, as a whole, cannot be reduced to one master process; there is too much variation and complexity. However, within the overall bounds of flight operations, or construction, or surgery, there are critical sequences of events that must be executed, often in a specific order. Gawande discusses the airline industry as a key exemplar of this. Instead of one “master checklist” there are specific, clear, brief checklists for a wide variety of scenarios, such as a cargo hold door becoming unlatched.
There are similarities and differences between core BPM approaches and checklists. Often, BPM is employed to describe processes that are automated and whose progress is tracked in a database. Checklists, on the other hand, may be more manual, intended for use in a closely collaborative environment (such as an aircraft cockpit or operating room), and may represent a briefer period of time.
Full process management specifies tasks and their flow in precise detail. We have not yet got to that point with our Kanban board, but when we start adding checklists, we are beginning to differentiate the various processes at a detailed level. We will revisit Gawande’s work in Context III with the coordination technique of the submittal schedule.
Case Management
| Do not confuse “Case” here with Computer Assisted Software Engineering. |
Case Management is a concept used in medicine, law, and social services. Case Management can be thought of as a high-level process supporting the skilled knowledge worker applying their professional expertise. Cases are another way of thinking about the relationship between the Kanban board and process management (see Process Management versus Case Management).
IT consultant and author Rob England contrasts “Case Management” with “Standard Process” in his book Plus! The Standard+Case Approach: See Service Response in a New Light [94]. Some processes are repeatable and can be precisely standardized, but it is critical for anyone working in complex environments to understand the limits of a standardized process. Sometimes, a large “case” concept is sufficient to track the work. The downside may be that there is less visibility into the progress of the case — the person in charge of it needs to provide a status that can’t be represented as a simple report. We will see process management again in Operations Management in our discussion of operational process emergence.
Evidence of Notability Workflow management in the basic emergent sense is a key precursor to full BPM. See, for example, [255].
Limitations Not all work can or should be reduced to a procedural paradigm. Higher-touch, more variable services and R&D work require different approaches, such as Case Management.
Related Topics
Systems Thinking and Feedback
Description
So, what is a system? A system is a set of things - people, cells, molecules, or whatever - interconnected in such a way that they produce their own pattern of behavior over time. The system may be buffeted, constricted, triggered, or driven by outside forces. But the system’s response to these forces is characteristic of itself, and that response is seldom simple in the real world.
Thinking in Systems
Systems thinking, and systems theory, are broad topics extending far beyond IT and the digital profession. Meadows defines a system as: “an interconnected set of elements that is coherently organized in a way that achieves something” [1]. Systems are more than the sum of their parts; each part contributes something to the greater whole, and often the behavior of the greater whole is not obvious from examining the parts of the system.
Systems thinking is an important influence on digital management. Digital systems are complex, and when the computers and software are considered as a combination of the people using them, we have a sociotechnical system. Digital systems management seeks to create, improve, and sustain these systems.
A digital management capability is itself a complex system. While the term “Information Systems (IS)” was widely replaced by “Information Technology (IT)” in the 1990s, do not be fooled. Enterprise IT is a complex sociotechnical system, that delivers the digital services to support a myriad of other complex sociotechnical systems.
The Merriam-Webster dictionary defines a system as: “a regularly interacting or interdependent group of items forming a unified whole". These interactions and relationships quickly take center stage as the focus moves from individual work to team efforts. Consider that while a two-member team only has one relationship to worry about, a ten-member team has 45, and a 100-person team has 4,950!
A Brief Introduction to Feedback
The harder you push, the harder the system pushes back.
The Fifth Discipline
As the Senge quote implies, brute force does not scale well within the context of a system. One of the reasons for systems stability is feedback. Within the bounds of the system, actions lead to outcomes, which in turn affect future actions. This is a positive thing, as it is required to keep a complex operation on course.
Feedback is a problematic term. We hear terms like positive feedback and negative feedback and associate such usage with performance coaching and management discipline. That is not the sense of feedback in this document. The definition of feedback as used in this document is based on engineering and control theory.
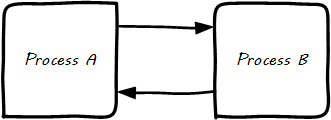
Reinforcing Feedback Loop illustrates the classic illustration of a reinforcing feedback loop.
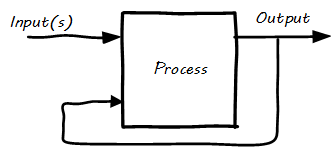
For example (as in Reinforcing (Positive?) Feedback, with Rabbits), “rabbit reproduction” can be considered as a process with a reinforcing feedback loop.
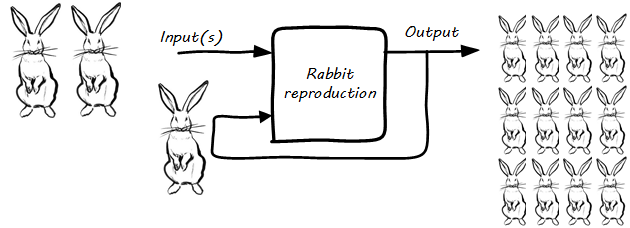
The more rabbits, the faster they reproduce, and the more rabbits. This is sometimes called a “positive” feedback loop, although the local gardener may not agree. This is why feedback experts (e.g., [268]) prefer to call this “reinforcing” feedback because there is not necessarily anything “positive” about it.
We can also consider feedback as the relationship between two processes (see Feedback Between Two Processes).
In the example, what if Process B is fox reproduction; that is, the birth rate of foxes (who eat rabbits) (see Balancing (Negative?) Feedback, with Rabbits and Foxes)?
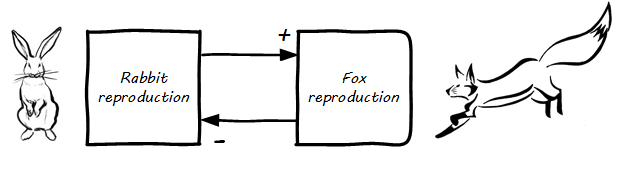
More rabbits equal more foxes (notice the “+” symbol on the line) because there are more rabbits to eat! But what does this do to the rabbits? It means fewer rabbits (the “--” on the line). Which, ultimately, means fewer foxes, and at some point, the populations balance. This is classic negative feedback. However, the local gardeners and foxes don’t see it as negative. That is why feedback experts prefer to call this “balancing” feedback. Balancing feedback can be an important part of a system’s overall stability.
What does Systems Thinking Have to do with IT?
In an engineering sense, positive feedback is often dangerous and a topic of concern. A recent example of bad positive feedback in engineering is the London Millennium Bridge. On opening, the Millennium Bridge started to sway alarmingly, due to resonance and feedback which caused pedestrians to walk in cadence, increasing the resonance issues. The bridge had to be shut down immediately and retro-fitted with $9 million worth of tuned dampers [75].
As with bridges, at a technical level, reinforcing feedback can be a very bad thing in IT systems. In general, any process that is self-amplified without any balancing feedback will eventually consume all available resources, just like rabbits will eat all the food available to them. So, if you create a process (e.g., write and run a computer program) that recursively spawns itself, it will sooner or later crash the computer as it devours memory and CPU. See runaway processes.
Balancing feedback, on the other hand, is critical to making sure you are “staying on track”. Engineers use concepts of control theory; for example, damping, to keep bridges from falling down.
Digital Fundamentals covered the user’s value experience, and also how services evolve over time in a lifecycle. In terms of the dual-axis value chain, there are two primary digital value experiences:
-
The value the user derives from the service (e.g., account lookups, or a flawless navigational experience)
-
The value the investor derives from monetizing the product, or comparable incentives (e.g., non-profit missions)
Additionally, the product team derives career value. This becomes more of a factor later in the game. We will discuss this further in Coordination and Process — on organization — and Context IV, on architecture lifecycles and technical debt.
The product team receives feedback from both value experiences. The day-to-day interactions with the service (e.g., help desk and operations) are understood, and (typically on a more intermittent basis) the portfolio investor also feeds back the information to the product team (the boss’s boss comes for a visit).
Balancing feedback in a business and IT context takes a wide variety of forms:
-
The results of a product test in the marketplace; for example, users' preference for a drop down box versus checkboxes on a form
-
The product owner clarifying for developers their user experience vision for the product, based on a demonstration of developer work-in-process
-
The end users calling to tell you the “system is slow” (or down)
-
The product owner or portfolio sponsor calling to tell you they are not satisfied with the system’s value
In short, we see these two basic kinds of feedback:
-
Positive/reinforcing, “do more of that”
-
Negative/balancing, “stop doing that”, “fix that”
The following should be considered:
-
How you are accepting and executing on feedback signals?
-
How is the feedback relationship with investors evolving, in terms of your product direction?
-
How is the feedback relationship with users evolving, in terms of both operational criteria and product direction?
One of the most important concepts related to feedback, one we will keep returning to, is that product value is based on feedback. We have discussed Lean Startup, which represents a feedback loop intended to discover product value. Don Reinertsen has written extensively on the importance of fast feedback to the product discovery process.
Reinforcing Feedback: The Special Case Investors Want
At a business level, there is a special kind of reinforcing feedback that defines the successful business (see The Reinforcing Feedback Businesses Want).
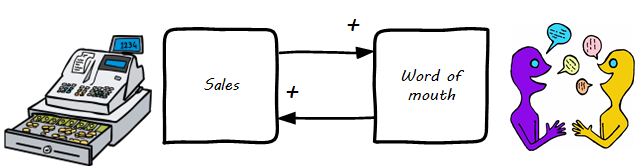
This is reinforcing feedback and positive for most people involved: investors, customers, employees. At some point, if the cycle continues, it will run into balancing feedback:
-
Competition
-
Market saturation
-
Negative externalities (regulation, pollution, etc.)
Open versus Closed-Loop Systems
Finally, we should talk briefly about open-loop versus closed-loop systems.
-
Open-loop systems have no regulation, no balancing feedback
-
Closed-loop systems have some form of balancing feedback
In navigation terminology, the open-loop attempt to stick to a course without external information (e.g., navigating in the fog, without radar or communications) is known as "dead reckoning", in part because it can easily get you dead!
A good example of an open-loop system is the children’s game “pin the tail on the donkey” (see Pin the Tail on the Donkey[1]). In “pin the tail on the donkey”, a person has to execute a process (pinning a paper or cloth “tail” onto a poster of a donkey — no live donkeys are involved!) while blindfolded, based on their memory of their location (and perhaps after being deliberately disoriented by spinning in circles). Since they are blindfolded, they have to move across the room and pin the tail without the ongoing corrective feedback of their eyes. (Perhaps they are getting feedback from their friends, but perhaps their friends are not reliable.)

Without the blindfold, it would be a closed-loop system. The person would rise from their chair and, through the ongoing feedback of their eyes to their central nervous system, would move towards the donkey and pin the tail in the correct location. In the context of a children’s game, the challenges of open-loop may seem obvious, but an important aspect of IT management over the past decades has been the struggle to overcome open-loop practices. Reliance on open-loop practices is arguably an indication of a dysfunctional culture. An IT team that is designing and delivering without sufficient corrective feedback from its stakeholders is an ineffective, open-loop system. Mark Kennaley [164] applies these principles to software development in much greater depth, and is recommended.
Engineers of complex systems use feedback techniques extensively. Complex systems do not work without them.
OODA
After the Korean War, the US Air Force wished to clarify why its pilots had performed in a superior manner to the opposing pilots who were flying aircraft viewed as more capable. A colonel named John Boyd was tasked with researching the problem. His conclusions are based on the concept of feedback cycles, and how fast humans can execute them. Boyd determined that humans go through a defined process in building their mental model of complex and dynamic situations. This has been formalized in the concept of the OODA loop (see OODA Loop[2]).
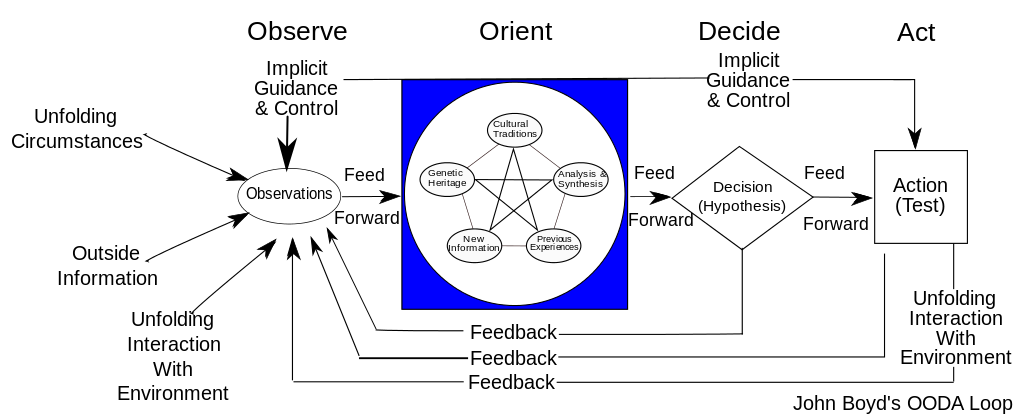
OODA stands for:
-
Observe
-
Orient
-
Decide
-
Act
Because the US fighters were lighter, more maneuverable, and had better visibility, their pilots were able to execute the OODA loop more quickly than their opponents, leading to victory. Boyd and others have extended this concept into various other domains including business strategy. The concept of the OODA feedback loop is frequently mentioned in presentations on Agile methods. Tightening the OODA loop accelerates the discovery of product value and is highly desirable.
The DevOps Consensus as Systems Thinking
We covered continuous delivery and introduced DevOps in Competency Area 3. Systems theory provides us with powerful tools to understand these topics more deeply.
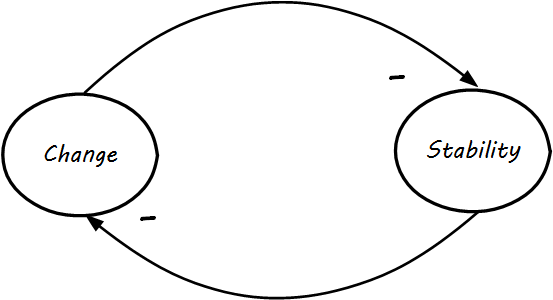
One of the assumptions we encounter throughout digital management is the idea that change and stability are opposing forces. In systems terms, we might use a diagram like Change versus Stability (see [33] for original exploration]). As a Causal Loop Diagram (CLD), it is saying that change and stability are opposed — the more we have of one, the less we have of the other. This is true, as far as it goes — most systems issues occur as a consequence of change; systems that are not changed in general do not crash as much.
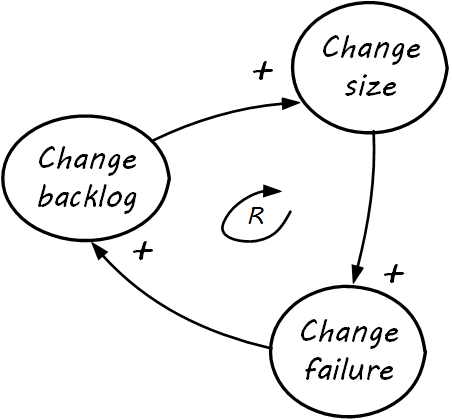
The trouble with viewing change and stability as diametrically opposed is that change is inevitable. If simple delaying tactics are put in, these can have a negative impact on stability, as in Change Vicious Cycle. What is this diagram telling us? If the owner of the system tries to prevent change, a larger and larger backlog will accumulate. This usually results in larger and larger-scale attempts to clear the backlog (e.g., large releases or major version updates). These are riskier activities which increase the likelihood of change failure. When changes fail, the backlog is not cleared and continues to increase, leading to further temptation for even larger changes.
How do we solve this? Decades of thought and experimentation have resulted in continuous delivery and DevOps, which can be shown in terms of system thinking in The DevOps Consensus.
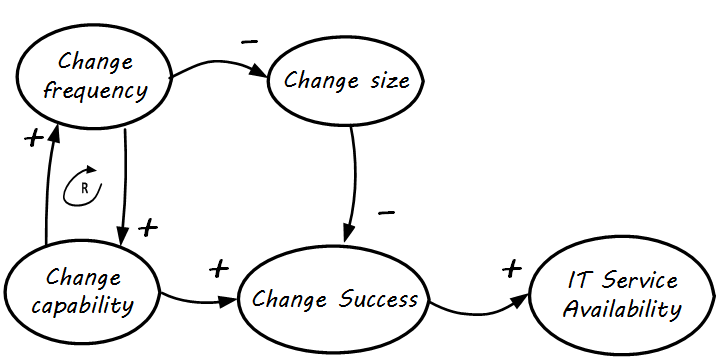
To summarize a complex set of relationships:
-
As change occurs more frequently, it enables smaller change sizes
-
Smaller change sizes are more likely to succeed (as change size goes up, change success likelihood goes down; hence, it is a balancing relationship)
-
As change occurs more frequently, organizational learning happens (change capability); this enables more frequent change to occur, as the organization learns
-
This has been summarized as: “if it hurts, do it more” (Martin Fowler in [92]).
-
-
The improved change capability, coupled with the smaller perturbations of smaller changes, together result in improved change success rates
-
Improved change success, in turn, results in improved system stability and availability, even with frequent changes; evidence supporting this de facto theory is emerging across the industry and can be seen in cases presented at the DevOps Enterprise Summit and discussed in The DevOps Handbook [166]
Notice the reinforcing feedback loop (the “R” in the looped arrow) between change frequency and change capability. Like all diagrams, this one is incomplete. Just making changes more frequently will not necessarily improve the change capability; a commitment to improving practices such as monitoring, automation, and so on is required, as the organization seeking to release more quickly will discover.
Evidence of Notability
Discussions of systems thinking, feedback, and OODA occur repeatedly throughout IT and digital management literature; e.g., ITIL’s Service Strategy volume [282] and The DevOps Handbook [166].
Limitations
Systems thinking is an advanced and somewhat theoretical topic, and discussions of it should carefully consider the audience.
Related Topics