Information Management
Area Description
Information is nothing new to the scaling digital organization. Like other topics in this document in the enterprise context, the digital organization has been managing information in some way since the earliest days of your organization.
Perhaps the company started by offering a social media-oriented service. It needed to track users and their activity. Or perhaps it started off with a focus on data science and analytics; the first product was based on harvesting insights from large data sets. Just as this document does not cover the specifics of programming languages or technical architectures, it also leaves the more technical aspects of data science and analytics to other guidance.
However, it is at the largest scale that organizations require the establishment of formal governance, control, and management techniques for information as a distinct and coherent problem domain. Before, the practitioner might have been interested in “customer data” or “sales data” or “supply chain data”. Now, they are concerned with data in general, and how to manage it, wherever and whatever it is.
They are also concerned with information, knowledge, records, reports, and a wide variety of other overlapping, and often difficult to define, concepts.
Information is the lifeblood of business. Simple records are the foundation of survival: lose the customer’s order, and the business won’t be in business long. Beyond such basics, the insights that can be gained from your data are increasingly critical competitive advantage. Whether or not the company started with a focus on data science, it probably has data scientists at this level of scale.
The sheer scale of the data is starting to become unmanageable. It costs money to store, and how much is needed? Lawyers start questioning whether it is truly necessary to keep certain data indefinitely; they seem to think there is risk there.
We are also periodically confronted with seemingly wasteful duplication of data — isn’t it possible to be a bit more efficient? Quality and security concerns are also increasing. We see competitors go out of business due to cyberattacks, and pervasive data quality issues also can be a serious threat to your operations and customer relationships.
Yet, when attempts are made to manage for more efficient or better-governed uses of data, the resulting cost and bureaucracy cause concern (not to mention receiving complaints about development delays and loss of business agility). It is an ongoing challenge, and it does not seem anyone anywhere has it entirely figured out.
| As with other Competency Areas in this document, this Competency Area will introduce this topic “on its own terms”. It will then add additional context and critique in subsequent Competency Categories. |
Information and Value
Description
The Origins of Digital Information
Writing provides a way of extending human memory by imprinting information into media less fickle than the human brain.
We have talked of representation previously, in the context of task management. Common representation is essential to achieving common ground when human interactions are time or space-shifted. Understanding representation is fundamental to understanding information.
Humans have been representing information since at least the creation of writing. As early as 3000 BCE, the ancient Sumerians used cuneiform to record information. Cuneiform was created by pressing wedge-shaped sticks into wet clay. A particular impression or set of impressions corresponded to a citizen, or how much grain they grew, or how much beer they received. Certainly, the symbols shown are not the same as the beer, or the grain, or the long-dead Sumerian. This may seem obvious, but it can be tempting to confuse the representation with the reality. This is known as the reification fallacy.
The Measurable Value of Information
All information management can be understood as a reduction in uncertainty. And we can and should quantify the value of having the information versus the cost of capturing and maintaining it.
Doug Hubbard, in the classic How to Measure Anything [134], asks the following questions when the measurement is proposed (p.47):
-
What is the decision this measurement is supposed to support?
-
What is the definition of the thing being measured in terms of observable consequences?
-
How, exactly, does this thing matter to the decision being asked?
-
How much do you know about it now (i.e., what is your current level of uncertainty)?
-
What is the value of additional information?
As he states: “All measurements that have value must reduce the uncertainty of something that affects some decision with economic consequences.” While Hubbard is proposing these questions in the context of particular analysis initiatives, they are also excellent questions to ask of any proposal to manage information or data.
Information management, in the context of digital systems, adds value through improving efficiency, effectiveness, and optimizing risk (our three primary categories of value). Since digital systems started off primarily as efficiency aids, we will discuss efficiency first.
Information, Efficiency, and Effectiveness
We have periodically discussed historical aspects of computing and digital systems, but not yet covered some of the fundamental motivations for their invention and development.
As technology progressed through the late 19th and early 20th centuries, applied mathematics became increasingly important in a wide variety of areas such as:
-
Ballistics (e.g., artillery) calculations
-
Cryptography
-
Atomic weapons
-
Aeronautics
-
Stress and load calculations
Calculations were performed by “computers”. These were not automated devices, but rather people, often women, tasked with endless, repetitive operation of simple adding machines, by which they manually executed tedious calculations to compile (for example) tables of trigonometric angles.
It was apparent at least since the mid-19th century that it would be possible to automate such calculation. In fact, mathematical devices had long existed; for example, the abacus, Napiers' Bones, and the slide rule. But such devices had many limitations. The vision of automating digital calculations first came to practical realization through the work of Charles Babbage and Ada Lovelace, who took significant steps through the design and creation of the Difference and Analytical Engines.
After Babbage, the development of automated computation encountered a hiatus. Purely mechanical approaches based on gears and rods could not scale, and the manufacturing technology of Babbage’s day was inadequate to his visions — the necessary precision and power could not be achieved by implementing a general-purpose computer using his legions of gears, cams, and drive shafts. However, mathematicians continued to explore these areas, culminating in the work of Alan Turing who established both the potential and the limits of computing, initially as a by-product of investigations into certain mathematical problems of interest at the time.
Around the same time, the legendary telecommunications engineer Claude Shannon had developed essential underpinning engineering in expressing Boolean logic in terms of electronic circuits, and rigorous mathematical theory describing the fundamental characteristics and limitations of information transmission (e.g., the physical limits of copying one bit of data from one location from another) [254]. Advances in materials and manufacturing techniques resulted in the vacuum tube, ideally suited to the combination of Shannon digital logic with Turing’s theories of computation, and thus the computer was born. It is generally recognized that the first practical general-purpose computer was developed by the German Konrad Zuse.
Turing and a fast-growing cohort of peers driven by (among other things) the necessities of World War II developed both theory and the necessary practical understandings to automate digital computation. The earliest machines were used to calculate artillery trajectories. During World War II, mathematicians and physicists such as John von Neumann recognized the potential of automated computation, and so computers were soon also used to simulate nuclear explosions. This was a critical leap beyond the limits of manual “computers” pounding out calculations on adding machines.
The business world was also attentive to the development of computers. Punched cards had been used for storing data for decades preceding the invention of automated computers. Record-keeping at scale has always been challenging — the number of Sumerian clay tablets still in existence testifies to that! Industrial-era banks, insurers, and counting-houses managed massive repositories of paper journals and files, at great cost. A new form of professional emerged: the "white collar worker.
Any means of reducing the cost of this record-keeping was of keen interest. Paper files were replaced by punched cards. Laborious manual tabulation was replaced by mechanical and electro-mechanical techniques, that could, for example, calculate sums and averages across a stack of punched cards, or sort through the stack, compare it against a control card, and sort the cards accordingly.
During World War II, many business professionals found themselves in the military, and some encountered the new electronic computers being used to calculate artillery trajectories or decrypt enemy messages. Edmund Berkeley, the first secretary of the Association for Computing Machinery, was one such professional who grasped the potential of the new technology [11]. After the war, Berkeley advocated for the use of these machines to the leadership of the Prudential insurance company in the US, while others did the same with firms in the UK.
What is the legacy of Babbage and Lovelace and their successors in terms of today’s digital economy? The reality is that digital value for the first 60 years of fully automated computing systems was primarily in service of efficiency. In particular, record-keeping was a key concern. Business computing (as distinct from research computing) had one primary driver: efficiency. Existing business models were simply accelerated with the computer. 300 clerks could be replaced by a $10 million machine and a staff of 20 to run it (at least, that was what the sales representative promised). And while there were notable failures, the value proposition held up such that computer technology continued to attract the necessary R&D spending, and new generations of computers started to march forth from the laboratories of Univac, IBM, Hewlett-Packard, Control Data, Burroughs, and others.
Efficiency ultimately is only part of the business value. Digital technology relentlessly wrings out manual effort, and this process of automation is now so familiar and widespread that it is not necessarily a competitive advantage. Harvard Business Review editor Nicholas Carr became aware of this in 2003. He wrote a widely discussed article “IT Doesn’t Matter” in which he argued that: “When a resource becomes essential to competition but inconsequential to strategy, the risks its creates become more important than the advantages it provides.” [56]. Carr compared IT to electricity, noting that companies in the early 20th century had vice-presidents of electricity and predicting the same for CIOs. His article provoked much discussion at the time and remains important and insightful. Certainly, to the extent IT’s value proposition is coupled only to efficiency (e.g., automating clerical operations), IT is probably less important to strategy.
But as we have discussed throughout this document, IT is permeating business operations, and the traditional CIO role is in question as mainstream product development becomes increasingly digital. The value of correctly and carefully applied digital technology is more variable than the value of electricity. At this 2018 writing, the five largest companies by market capitalization — Apple, Amazon, Google, Facebook, and Microsoft — are digital firms, based on digital products, the result of digital strategies based on correct understanding and creative application of digital resources.
In this world, information enables effectiveness as much as, or even more than, efficiency.
The Importance of Context
Information management as we will discuss in the rest of this Competency Area arises from the large-scale absorption of data into highly efficient, miniaturized, automated digital infrastructures with capacity orders of magnitude greater than anything previously known. However, cuneiform and quipu, hash marks on paper, financial ledgers, punched cards, vacuum tubes, transistors, and hard disks represent a continuum, not a disconnected list. Whether we are looking at a scratch on a clay tablet or the magnetic state of some atoms in a solid state drive, there is one essential question:
What do we mean by that?
Consider the state of those atoms on a solid state drive. They represent the numbers 547. But without context, that number is meaningless. It could be:
-
The numeric portion of a street address
-
A piece of a taxpayer identification number
-
The balance on a bank account
-
A piece of the data uniquely identifying DNA in a crime
The state of this data may have significant consequences. A destination address might be wrong, a tax return mis-identified. A credit card might be accepted or declined. A mortgage might be approved or denied. Or the full force of the law may be imposed on an offender, including criminal penalties resulting from a conviction on the evidence stored in the computer.
The COBIT Enabling Information guide [145] proposes a layered approach to this problem:
| Layer | Implication |
|---|---|
Physical |
The media (paper, electronic) storing the data |
Empirical |
The layer that observes the signals from the physical, and distinguishes signal from noise |
Syntactic |
The layer that encodes the data into symbols (e.g., ASCII) |
Semantic |
The layer providing the rules for constructing meaning from syntactical elements |
Pragmatic |
The layer providing larger, linguistic structuring |
Social |
The layer that provides the context and ultimately consequence of the data (e.g., legal, financial, entertainment) |
Without all these layers, the magnetic state of those atoms is irrelevant.
The physical, empirical, and syntactic layers (hardware and lowest-level software) are in general out of scope for this document. They are the concern of broad and deep fields of theory, research, development, market activity, and standards. (Digital Infrastructure on infrastructure is the most closely related).
A similar but simpler hierarchy is:
-
Data
-
Information
-
Knowledge
Data is the context-less raw material.
Information is data + context, which makes it meaningful and actionable.
Knowledge is the situational awareness to make use of information.
Semantic, pragmatic, and social concerns (information and knowledge) are fundamental to this document and Competency Area. At digital scale — terabytes, petabytes, exabytes — establishing the meaning and social consequence of data is a massive undertaking. Data management and records management are two practices by which such meaning is developed and managed operationally. We will start by examining data management as a practice.
Evidence of Notability
Information management and its related value is the basis of computing and IT. Its notability is evidenced in the history of the human race’s approaches to managing it, from cuneiform to the present day.
Limitations
Information tends to be static and passive, where process is dynamic.
Related Topics
Enterprise Information Management
Description
Data Management and the DMBOK®
Data management is a long established practice in larger IT organizations. As a profession, it is represented by the Data Management Association (DAMA). DAMA developed and supported the Data Management Body of Knowledge (DMBOK), which is a primary influence on this Competency Category.
The Data Management Body of Knowledge (DMBOK)
The Data Management Body of Knowledge (DMBOK) [80] is similar to other frameworks presented in this document (e.g., ITIL, COBIT, and PMBOK). It includes ten major functions:
-
Data Governance
-
Data Architecture Management
-
Data Development
-
Data Operations Management
-
Data Security Management
-
Reference and Master Data Management
-
Data Warehousing and Business Intelligence Management
-
Document and Content Management
-
Metadata Management
-
Data Quality Management
Attentive readers will notice some commonalities with general areas covered in this document: Governance, Architecture, Operations, and Security in particular. Data at scale is a significant problem area, and so the DMBOK provides a data-specific interpretation of these broader concerns, as well as more specialized topics.
We will not go through each of the DMBOK functions in order, but we will be addressing most of them throughout this Competency Category.
Data Architecture and Development
Data and Process
In order to understand data, we must understand how it is being used. We covered process management in Organization and Culture. Data is often contrasted with process since processes take data inputs and produce data outputs. The fundamental difference between the two can be seen in the core computer science concepts of algorithms (process) and data structures. Data emerges, almost unavoidably, when processes are conceived and implemented. A process such as “Hire Employee” implies that there is an employee, and also a concept of “hire” with associated date and other circumstances. It may seem obvious, but data structures are surprisingly challenging to develop and gain consensus on.
The Ontology Problem
The boundaries of an entity are arbitrary, our selection of entity types is arbitrary, the distinction between entities, attributes, and relationships is arbitrary.
Preface to Kent's Data and Reality
Suppose you are discussing the concept of “customer” with a teammate. You seem to be having some difficulty understanding each other. (You are from support and she is from sales.) You begin to realize that you have two different definitions for the same word:
-
You believe that “customer” means someone who has bought something
-
She believes that “customer” includes sales leads
This is a classic issue in data management: when one term means two things. It can lead to serious confusion and technical difficulties if these misunderstandings affect how systems are built and operated. Because of this, it is critical to have rational and clear discussions about “what we mean”. In a startup driven by one or two visionary founders, perhaps little or no time is needed for this. The mental model of the problem domain may be powerfully understood by the founder, who controls the key architectural decisions. In this way, a startup can progress far with little formalized concern for data management.
But as a company scales, especially into multi-product operations, unspoken (tacit) understandings do not scale correspondingly. Team members will start to misunderstand each other unless definitions are established. This may well be needed regardless of whether data is being held in a database. The concept of a "controlled vocabulary” is, therefore, key to Enterprise Information Management.
In many areas of business, the industry defines the vocabulary. Retailers are clear on terms like “supplier”, “cost”, and “retail” (as in amount to be charged for the item; they do not favor the term “price” as it is ambiguous). The medical profession defines “patient”, “provider”, and so forth. However, in more flexible spaces, where a company may be creating its own business model, defining a controlled vocabulary may be essential. We see this even in books, which provide glossaries. Why does a book have a glossary, when dictionaries exist? Glossaries within specific texts are defining a controlled, or highly specific, vocabulary. General-purpose dictionaries may list multiple meanings for the same word, or not be very precise. By developing a glossary, the author can make the book more consistent and accurate.
There are techniques for developing controlled vocabularies in efficient and effective ways. The term “ontology engineering” is sometimes used [82]. While specialists may debate the boundaries, another important practice is “conceptual data modeling”. All of these concepts (controlled vocabularies, glossaries, ontologies, conceptual data models) are independent of computers. But the initial development of controlled vocabulary is the first step towards automating the information with computers.
Data Modeling
An information system (e.g., database) is a model of a small, finite subset of the real world … We expect certain correspondences between constructs inside the information system and in the real world. We expect to have one record in the employee file for each person employed by the company. If an employee works in a certain department, we expect to find that department’s number in that employee’s record.
Data and Reality
Databases are the physical representation of information within computing systems. As we discussed above, the data contained within them corresponds to some “real world” concept we hold.
There are well-known techniques for translating concepts (e.g., controlled vocabularies) into technical database structures. The best known of these is relational data modeling.
Relational data modeling is often presented as having three layers:
-
Conceptual
-
Logical
-
Physical
The following descriptions of the layers are typical:
Conceptual |
Independent of computing platform — no assumption of any database. Does include simple relationships. Does not include attributes. |
Logical |
Assumes a database, but not what kind. Includes more detailed relationships and attributes. Human-readable names. |
Physical |
Intended for a specific database platform (e.g., Oracle or MySQL). Computer-compatible names. Can be used to generate data definition scripts. |
A simple conceptual model might appear as shown in Conceptual Data Model.

The above model might be a fragment from a sales system. It shows that their are four major entities:
-
Customer
-
Invoice
-
Line Item
-
Product
This might be elaborated into a logical model (see Logical Data Model).
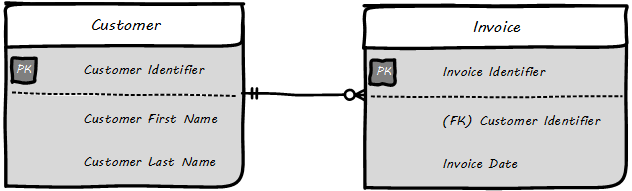
The logical model includes attributes (Customer First Name). The line between them has particular “adornments” representing a well-known data modeling notation called “crow’s foot”. In this case, the notation is stipulating that one customer may have zero to many invoices, but any invoice must have one and only one customer. Notice also that the entity and attribute names are human-readable.
Then, the logical model might be transformed into physical (see Physical Data Model).
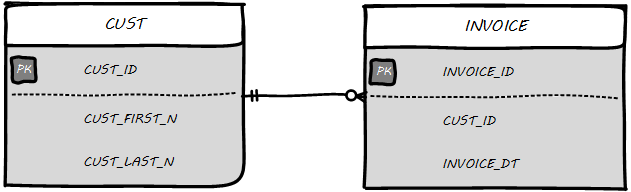
The names are no longer human-readable in full, nor do they have spaces. Common data types such as “name” and “date” have been replaced with brief codes (“N” and “DT”). In this form, the physical data model can be (in theory) translated to data definition language that can result in the creation of the necessary database tables.
Database Administration
Continuing from above: the data modeling work might have been performed by a data architect or analyst, or a developer. Perhaps a pictorial representation is not even created (formal data modeling as above is less likely in a startup). But at some point (assuming a relational database) the following statement will be developed:
CREATE TABLE SALES.CUST
(CUST_ID NUMBER,
CUST_FIRST_N VARCHAR2(32),
CUST_LAST_N VARCHAR2(32))
In the above SQL (Structured Query Language) statement, the Customer entity has been finally represented as a series of encoded statements an Oracle database can understand, including specification of the data types needed to contain Customer Identifier (a number type) and the customer’s first and last names (a 32-character long string field, called “VARCHAR” in Oracle).
If a DBA issues that statement to the Oracle database, the table will be created. Once the structure is created, it can (within limits) hold any number of customers, in terms of knowing their first and last names and an ID number, which might or might not be assigned automatically by the system. (Of course, we would want many more attributes; e.g., customer address.)
| Notice that this database would only work for regions where customers have “first” and “last” names. This may not be true in all areas of the world. See Falsehoods Programmers Believe about Names. |
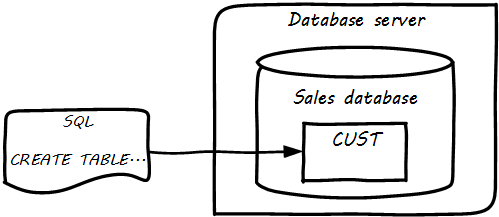
The Oracle software is installed on some node or machine and receives the statement. The database adds the table suggested (see Database Creates Table).
Further tables can easily be added in the same manner (see Multiple Tables in Database).
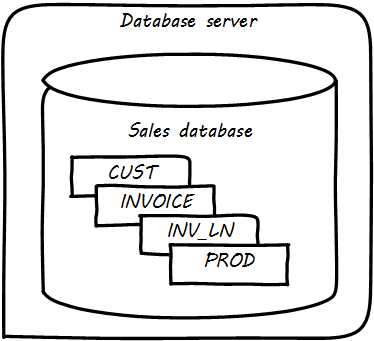
What is a database in this sense? The important point is that it is a common query space — you can ask for data from either the CUST, INVOICE, or Inventory LINe (INV_LN) table or ask the database to “join” them so you can see data from both. (This is how, for example, we would report on sales by customer.)
Patterns and Reference Architectures
Reference architectures and design patterns are examples of approaches that are known to work for solving certain problems. In other words, they are reusable solutions for commonly occurring scenarios. They apply to core software development, often suggesting particular class structures [108]. However, the concept can also be applied to data and system architectures; e.g., [101], [31]. David Hay [127], and Len Silverston [258], [257], [259] have documented data models for a variety of industries.
Reference architectures also can provide guidance on data structures, as they often contain industry learnings. Examples include:
| Organization | Domain | Standard(s) |
|---|---|---|
TM Forum |
Telecommunications |
Frameworx, ETOM — Enhanced Telecommunications Operating Model, TAM, SIDS |
Association for Retail Technology Standards |
Retail |
ARTS Model |
ACORD.org |
Insurance |
ACORD Framework |
Banking Industry Architecture Network |
Banking |
BIAN Service Landscape |
The Open Group Exploration, Mining, Metals, and Minerals (EMMM™) Forum |
Exploration, Mining, and Minerals |
Exploration and Mining Business Reference Model |
The Open Group IT4IT Forum |
Information Technology Management |
IT4IT Standard |
Patterns and reference architectures can accelerate understanding, but they also can over-complicate solutions. Understanding and pragmatically applying them is the challenge. Certainly, various well-known problems such as customer address management have surprising complexity and can benefit from leveraging previous work.
The above description is brief and “classic” — the techniques shown here date back decades, and there are many other ways the same problem might be represented, analyzed, and solved. But in all cases in data management, the following questions must be answered:
-
What do we mean?
-
How do we represent it?
The classic model shown here has solved many business problems at large scale. But there are critical limitations. Continuing to expand one “monolithic” database does not work past a certain point, but fragmenting the data into multiple independent systems and data stores also has challenges. We will discuss these further as this Competency Category progresses.
Enterprise Information Management
The previous section was necessary but narrow. From those basic tools of defining controlled vocabularies and mapping them onto computing platforms, has come today’s digital economy and its exabytes of data.
The relational database as represented in the previous Competency Category can scale, as a single unit, to surprising volumes and complexity. Perhaps the most sophisticated and large-scale examples are seen in ERP (more detail on this in the Topics section). An ERP system can manage the supply chain, financials, human resources, and manufacturing operations for a Fortune 50 corporation, and itself constitute terabytes and tens of thousands of tables.
However, ERP vendors do not sell solutions for leading-edge Digital Transformation. They represent the commoditization phase of the innovation cycle. A digital go-to-market strategy cannot be based solely on them, as everyone has them. Competing in the market requires systems of greater originality and flexibility, and that usually means some commitment to either developing them with internal staff or partnering closely with someone who has the necessary skills. And as these unique systems scale up, a variety of concerns emerge, requiring specialized perspectives and practices.
The previous Competency Category gave us the basics of data storage. We turn to some of the emergent practices seen as Enterprise Information Management scales up:
-
Master data, data integration, and the System of Record
-
Reference data management
-
Data quality management
Data Integration and the “System of Record”
In the last section, we analyzed a business problem as a data model and created a simple database. Notice that if data is not in the database table, the database doesn’t know about it. Therefore, if there is data held in other parts of the company, it must be loaded into the database before it can be combined with that database’s other data. This can also apply to data held by cloud providers.
Let’s go back to our emergence model. Think about moving from one database to two.
In the example below, the CRM system is in the cloud, and data is also being imported from the product database (see Data Integrations).
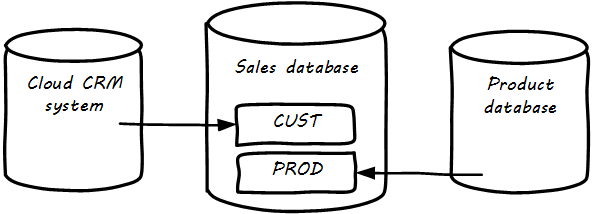
The process of identifying such remote data and loading it into a database to enable work to be done is known as “integration” and is a complex domain [129]. There are many ways data can be integrated, and industry views of what is “good practice” have changed over the years.
| Thinking in terms of the emergence model, you have likely been integrating data in various ways for some time. However, in a large, governed organization, you need to formalize your understandings and approach. |
Take the above diagram and multiply it by several hundred times, and you will start to get an idea of the complexity of Enterprise Information Management at scale in the enterprise. How do we decide what data needs to flow where? What happens if we acquire another company and can’t simply move them over to our systems immediately? What department should properly own a given database? These and similar questions occupy data professionals worldwide.
As we see from the above picture, the same data may exist in multiple systems. Understanding what system is the “master” is critical. Product data should (in general) not flow from the sales database back into the product system. But what about sales information flowing from the sales database back to the CRM system? This might be helpful so that people using the CRM system understand how much business a customer represents.
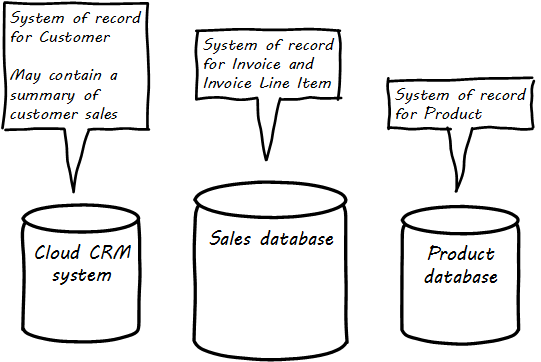
The “System of Record” concept is widely used in data management, records management, and Enterprise Architecture to resolve these kinds of questions. It is often said that the System of Record is the “master” for the data in question, and sustaining the System of Record concept may also be called Master Data Management. In general, the System of Record represents data that is viewed as:
-
The most complete and accurate
-
Authoritative, in terms of resolving questions
-
Suitable for legal and regulatory purposes
-
The “source” for other systems to refer to
It is important to realize that the designation “System of Record” is a role that a given database (or system) plays with respect to some data. The “sales” database above might be the System of Record for invoices, but is not the System of Record for products or customers (see System of Record).
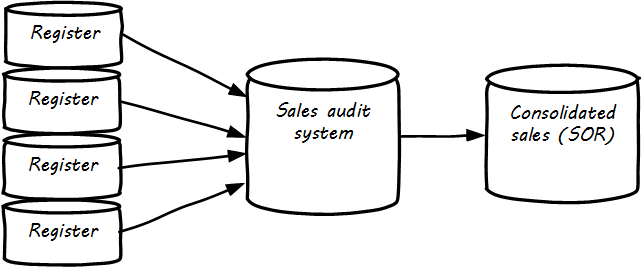
The System of Record is often the system of origin — the system where the data is first captured — but not always. In retail, sales transactions are not considered authoritative until they pass through sales audit, and so the System of Record for a transaction is not the cash register, which has a database in it (see Data Flow for Sales Information).
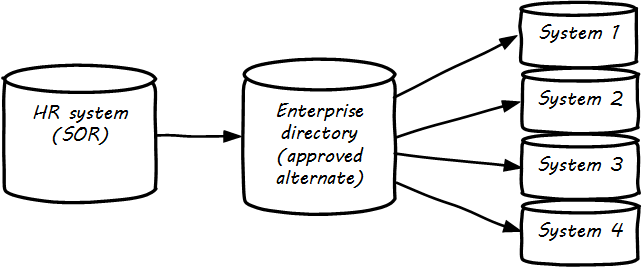
System of Record logically would be the first place to pull data from, but sometimes due to performance or security concerns, data may be replicated into an alternate source better suited for distributing the data. A good example of this is a human resources system that feeds the corporate directory; the human resources system (e.g., Oracle HR, or Workday) is the actual System of Record for employee names and identifiers, but most people and other systems in the company will pull the data from the directory (e.g., Microsoft Exchange — see Data Flow for Human Resources Data).
Reference Data Management
Reference data is any kind of data that is used solely to categorize other data found in a database, or solely for relating data in a database to information beyond the boundaries of the enterprise.
Managing Reference Data
There are various ways to categorize data. Frequently, it is categorized by business process or functional area (sales, marketing, support, etc.). However, another important way to understand data is by its non-functional characteristics. Keep in mind that some data is transactional (e.g., Invoice and Invoice Line Item in the above example) and some is more persistent (Customer, Product).
When data is highly persistent and used primarily for categorizing across an enterprise, we may call it “reference” data. Classic examples of reference data include:
-
Geographic information (cities, states, zip codes)
-
Widely used “codes” in the business (medical insurance makes extensive use of these)
-
An organization’s chart of accounts
Reference data is among the first data to be shared between systems. It is often the basis for dimensions in analytic processing, which we cover in the next Competency Category.
Commercial Data
Data is not just an internal artifact of organizations. Data can be bought and sold on the open market like any other commodity. Marketing organizations frequently acquire contact information for email and other campaigns. Here are examples of commercial data available through market sources:
| Data type | Market provider |
|---|---|
Stock prices |
Bloomberg, Reuters |
Credit ratings |
Trans-Union, Experian |
Known security issues |
NIST Common Vulnerability database |
Technology products and availability dates |
BDNA Technopedia |
Other forms include:
-
Transactions of record (e.g., real estate)
-
Governmental actions (these may be nominally free from the government, but frequently are resold by vendors who make the data more accessible)
For a detailed examination of the privacy issues relating to commercial data, especially when governmental data is commercialized, see [86].
Data Quality
Human beings cannot make effective business decisions with flawed, incomplete, or misleading data.
Executing Data Quality Projects
We touched on quality management and continuous improvement in Organization and Culture. Data is an important subject for continuous improvement approaches. Sometimes, the best way to improve a process is to examine the data it is consuming and producing, and an entire field of data quality management has arisen.
Poor data quality costs the enterprise in many ways:
-
Customer dissatisfaction (“they lost my order/reservation”)
-
Increased support costs (30 minutes support operator time spent solving the problem)
-
Governance issues and regulatory risk (auditors and regulators often check data quality as evidence of compliance to controls and regulations)
-
Operational and supply chain issues
-
Poor business outcomes
The following activities are typically seen in data quality management (derived and paraphrased from [80]):
-
Identify measurable indicators of data quality
-
Establish a process for acting upon those indicators (what do we do if we see bad data?)
-
Actively monitor the quality
-
Fix both data quality exceptions, and their reasons for occurring
Data quality indicators may be automated (e.g., reports that identify exceptions) or manual (e.g., audits of specific records and comparison against what they are supposed to represent).
It is important to track trending over time so that the organization understands if progress is being made.
Enterprise Records Management
Not all enterprise information is stored in structured databases; in fact, most isn’t. (We will leave aside the issues of rich content such as audio, images, and video.) Content management is a major domain in and of itself, which shades into the general topic of knowledge management (to be covered in the Topics section). Here, we will focus on records management. As discussed above, businesses gained efficiency through converting paper records to digital forms. But we still see paper records to this day: loan applications, doctor’s forms, and more. If you have a car, you likely have an official paper title to it issued by a governmental authority. Also, we above defined the concept of a System of Record as an authoritative source. Think about the various kinds of data that might be needed in the case of disputes or legal matters:
-
Employee records
-
Sales records (purchase orders and invoices)
-
Contracts and other agreements
-
Key correspondence with customers (e.g., emails directing a stock broker to “buy”)
These can take the form of:
-
Paper documents in a file cabinet
-
Documents scanned into a document management system
-
Records in a database
In all cases, if they are “official” — if they represent the organization’s best and most true understanding of important facts — they can be called “records”.
This use of the word “records” is distinct from the idea of a “record” in a database. Official records are of particular interest to the company’s legal staff, regulators, and auditors. Records management is a professional practice, represented by the Association of Records Management Administrators (www.arma.org). Records management will remain important in digitally transforming enterprises, as lawyers, regulators, and auditors are not going away.
One of the critical operational aspects of records management is the concept of the retention schedule. It is not usually in an organization’s interest to maintain all data related to all things in perpetuity. Obviously, there is a cost to doing this. However, as storage costs continue to decrease, other reasons become more important. For example, data maintained by the company can be used against it in a lawsuit. For this reason, companies establish records management policies such as:
-
Human resources data is to be deleted seven years after the employee leaves the company
-
POS data is to be deleted three years after the transaction
-
Real estate records are to be deleted ten years after the property is sold or otherwise disposed of
This is not necessarily encouraging illegal behavior. Lawsuits can be frivolous, and can “go fishing” through a company’s data if a court orders it. A strict retention schedule that has demonstrated high adherence can be an important protection in the legal domain.
| If you or your company are involved in legal issues relating to the above, seek a lawyer. This discussion is not intended as legal advice. |
We will return to records management in the discussion below on e-discovery and cyberlaw.
Records management drives us to consider questions such as “who owns that data” and “who takes care of it”. This leads us to the concept of data governance.
Data Governance
This document views data governance as based in the fundamental principles of governance from Governance, Risk, Security, and Compliance:
-
Governance is distinct from management
-
Governance represents a control and feedback mechanism for the digital pipeline
-
Governance is particularly concerned with the external environment (markets, brands, channels, regulators, adversaries)
By applying these principles, we can keep the topic of “data governance” to a reasonable scope. As above, let’s focus on the data aspects of:
-
Risk management, including security
-
Compliance
-
Policy
-
Assurance
Information-Related Risks
The biggest risk with information is unauthorized access, discussed previously as a security concern. Actual destruction, while possible, is also a concern; however, information can be duplicated readily to mitigate this. Other risks include regulatory and civil penalties for mis-handling, and operational risks (e.g., from bad data quality).
There is a wide variety of specific threats to data, leading to risk; for example:
-
Data theft (e.g., by targeted exploit)
-
Data leakage (i.e., unauthorized disclosure by insiders)
-
Data loss (e.g., by disaster and backup failure)
The standard risk and security approaches suggested in Governance, Risk, Security, and Compliance are appropriate to all of these. There are particular technical solutions such as data leakage analysis that may figure in a controls strategy.
A valuable contribution to information management is a better understanding of the risks represented by data. We have discussed simple information sensitivity models (for example Public, Internal, Confidential, Restricted). However, a comprehensive information classification model must accommodate:
-
Basic sensitivity (e.g., confidential)
-
Ownership/stewardship (e.g., senior vice-president HR, HR/IS director)
-
Regulatory aspects (e.g., SOX or HIPAA)
-
Records management (e.g., “Human Resources”, “Broker/Client Communications”, “Patient History”)
Beyond sensitivity, the regulatory aspects drive both regulatory and legal risks. For example, transmitting human resources data related to German citizens off German soil is illegal, by German law. (There are similar regulations at the European Union level.) But if German human resources data is not clearly understood for what it is, it may be transmitted illegally. Other countries have different regulations, but privacy is a key theme through many of them. The US HIPAA regulations are stringent in the area of US medical data. In order to thoroughly manage such risks, data stores should be tagged with the applicable regulations and the records type.
The broad topic of individuals' expectations for how data relating to them is stored and secured is called data privacy. It drives regulations, lawsuits, standards, and is a frequent topic of news coverage (e.g., when a mass data breach occurs). Bad data quality also presents risks as mentioned above. In fact, [84] sees data quality as a kind of control (in the sense of risk mitigation).
E-discovery and Cyberlaw
Information systems and the data within them can be the subject of litigation, both civil and criminal. A criminal investigation may ensue after a security breach. Civil and regulatory actions may result from (for example) inappropriate behavior by the organization, such as failing to honor a contract. In some cases, records are placed under a “legal hold”. This means that (whether physical or digital) the records must be preserved. The US Federal Rules of Civil Procedure [277] covers the discovery of information stored in computing systems. Successfully identifying the data in scope for the hold requires disciplined approaches to records management and data classification, as described above.
| Again, if you or your company are involved in legal issues relating to the above, seek a lawyer. This discussion is not intended as legal advice. |
Evidence of Notability
Information management is the basis of computing and IT. Its notability is evidenced in the existence of professional associations like the Data Management Association and the Information and Records Management Association, as well as the revenues of companies like Oracle and IBM for their data management products, and finally the broad career paths available for DBAs and data scientists.
Limitations
Data management, as a discipline concerned with the general question of information, is abstract and only arises as a formal focus of attention in larger organizations.
Related Topics
Analytics
Description
Analytics in Context
One important aspect of digital product development is data analytics. Analysis of organizational records has always been a part of any concern large enough to have formal records management. The word for this originally was simply “reporting”. A set of files or ledgers would be provided to one or more clerks, who would manually review them and extract the needed figures.
We have touched on reporting previously, in our discussion of metrics. Here is a more detailed examination. The compilation of data from physical sources and its analysis for the purposes of organizational strategy was distinct from the day-to-day creation and use of the data. The clerk who attended to the customer and updated their account records had a different role than the clerk who added up the figures across dozens or hundreds of accounts for the annual corporate report.
What do we mean by the words “analysis” or “analytics” in this older context? Just compiling totals and averages was expensive and time-consuming. Cross-tabulating data (e.g., to understand sales by region) was even more so. As information became more and more automated, the field of "decision support” (and its academic partner "decision sciences”) emerged. The power of extensively computerized information that could support more and more ambitious forms of analysis gave rise to the concept and practice of "data warehousing” [141]. A robust profession and set of practices emerged around data warehousing and analytics. As infrastructure became more powerful and storage less expensive, the idea of full-lifecycle or closed-loop analytics originated.
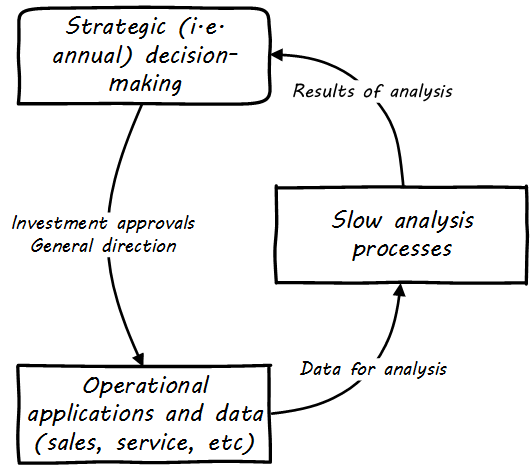
When analyzing data is costly and slow, the data analysis can only affect large, long-cycle decisions. It is not a form of fast feedback. The annual report may drive next year’s product portfolio investment decisions, but it cannot drive the day-to-day behavior of sales, marketing, and customer service (see Strategic Analytics).
However, as analysis becomes faster and faster, it can inform operational decisions (see Operational Analytics (Closed-Loop)).
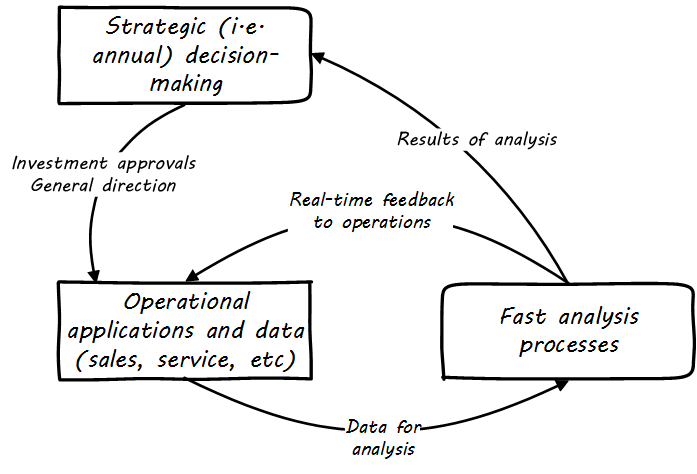
And, for certain applications (such as an online traffic management application on your smartphone), analytics is such a fundamental part of the application that it becomes operational. Such pervasive use of analytics is one of the hallmarks of Digital Transformation.
Data Warehousing and Business Intelligence
The reason to build a DW is to have the ability to make better decisions faster based on information using current and historical data.
Data Warehousing: Using the Wal-Mart Model
According to the DMBOK, “A Data Warehouse (DW) is a combination of two primary components. The first is an integrated decision support database. The second is the related software programs used to collect, cleanse, transform, and store data from a variety of operational and external sources … Data warehousing is a technology solution supporting Business Intelligence (BI)” [80]. The vision of an integrated DW for decision support is compelling and has provided enough value to support an industry sector of specialized hardware, software, training, and consulting. It can be seen as a common architectural pattern, in which disparate data is aggregated and consolidated for purposes of analysis, reporting, and for feedback into strategy, tactics, and operational concerns.
Figure: Data Warehousing/Business Intelligence Architecture illustrates a Data Warehousing/Business Intelligence (DW/BI) implementation pattern. The diagram expands on the above contextual diagrams, showing the major business areas (sales, etc.) as data sources. (In a large organization this might be dozens or hundreds of source systems.) These systems feed a "data services layer” that both aggregates data for analytics, as well as providing direct services such as data cleansing and master data management.
It is important to understand that in terms of this document’s emphasis on product-centric development that the data services layer itself is an internal product. Some might call it more of a component than a feature, but it is intended in any case as a general-purpose platform that can support a wide variety of use-cases.
“Factoring out” data services in this way may or may not be optimal for any given organization, depending on maturity, business objectives, and a variety of other concerns. However, at scale, the skills and practices do become specialized, and so it is anticipated that we will continue to see implementation strategies similar to this figure. Notice also that the data services layer is not solely for analytics; it also supports direct operational services. Here are discussions of the diagrams' various elements:
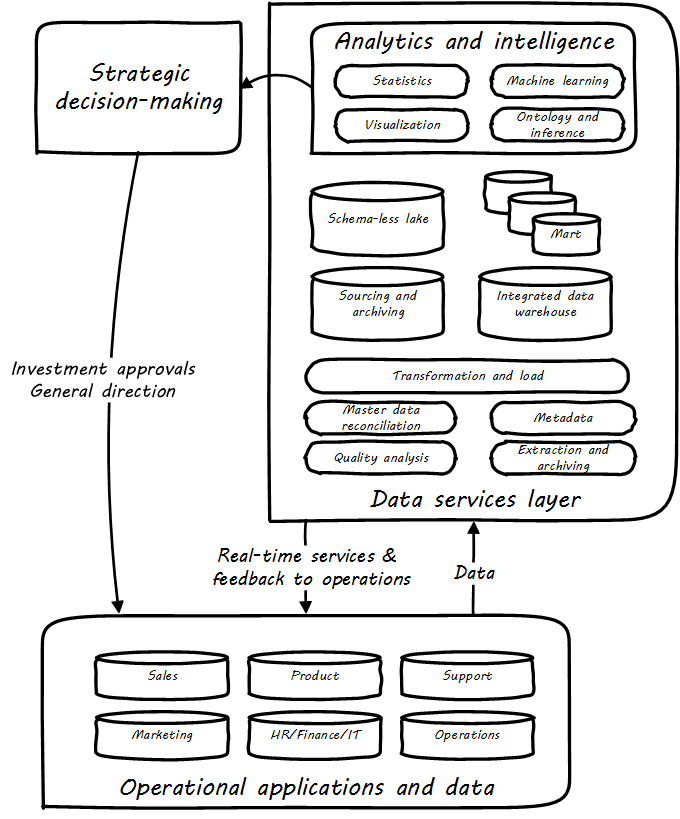
Operational applications. These are the source systems that provide the data and require data services.
Quality analysis. This is the capability to analyze data for consistency, integrity, and conformity with expectations, and to track associated metrics over time. (See data quality.)
Extraction and archiving. As data storage has become less expensive, maintaining a historical record of data extracts in original format is seen more often in data warehousing. (This may use a schema-less data lake for implementation.)
Master data reconciliation. When master data exists in diverse locations (e.g., in multiple System of Record) the ability to reconcile and define the true or “golden” master may be required. This is useful directly to operational systems, as an online service (e.g., postal service address verification), and is also important when populating the DW or mart. Master data includes reference data, and in the data warehousing environment may be the basis for “dimensions”, a technical term for the ways data can be categorized for analytic purposes (e.g., retail categorizes sales by time, region, and product line). Maintaining a history of dimensions is a challenging topic; search on the “slowly changing dimension” problem for further information.
Metadata. Commonly understood as “data about data”, we have previously encountered the concept of metadata and will further discuss it in the next Competency Category.
Transformation and load. Converting data to a consistent and normalized form has been the basis of enterprise data warehousing since it was first conceived. (We will discuss the schema-less data lake approach in the next Competency Category.) A broad market segment of "Extract, Transform, Load” (ETL) tooling exists to support this need.
Sourcing and archiving. This represents the physical data store required for the extraction and archiving capability. Again, it may be implemented as a schema-less data lake, or as a traditional relational structure.
Integrated DW. The integrated or enterprise DW is the classic, normalized, often massive, historical data store envisioned originally by Bill Inmon [141]. While the development effort in creating fully normalized DWs has limited them, they nevertheless are important, valuable, and frequently encountered in larger organizations.
Data lake. A newer form of data aggregation is seen in the schema-less "data lake”. As discussed in the next Competency Category, schema-less approaches accept data in native formats and defer the hard question of normalizing the data to the reporting and analysis stage.
Data mart(s). The integrated DW is intended to provide a consistent and universal platform across the enterprise. The data mart on the other hand is usually seen as specific to a particular organization or problem.
Statistics. Statistical analysis of the aggregated and cleansed data is a common use-case, often performed using commercial software or the R programming language.
Machine learning. Machine learning is broadly defined as “a field of study that gives computers the ability to learn without being explicitly programmed”. [Arthur Samuel as quoted in Simon, waiting on the book]. Machine learning allows computers to develop and improve algorithmic models for making predictions or decisions. Spam filters that “learn” are a good example.
Visualization. Representing complex information effectively so that humans can understand it and derive value is itself a challenging topic. Many graphical forms have been developed to communicate various aspects of data. See, for example, the open source visualization library D3.js.
Ontology and inference. This includes text mining and analytics, and also the ability to infer meaning from unstructured data sets. More in the next Competency Category discussion on schema-less.
Evidence of Notability
Analytics and "Big Data", and their more advanced expression in cognitive applications, are significant areas of R&D and industry interest.
Limitations
Analytics is a broad topic, ranging from simple reporting to AI. Clarity on what the term may mean in a given context is essential.
Related Topics
Agile Information Management
Description
Data infrastructure, like any complex systems development effort, is most effective and least risky when undertaken iteratively and incrementally. An organization’s analysis needs will change unpredictably over time and so a fast feedback loop of testing and learning is essential. The enterprise DW can support a wide variety of analysis objectives flexibly. Its challenge has always been the lead time required to develop the data structures and ETL logic. This will be discussed further in the next Competency Category.
Software versus Data
Services and applications can have their own gravity, but data is the most massive and dense. Therefore, it has the most gravity. Data if large enough can be virtually impossible to move [193].
Enterprise Information Management (including data management) has had a contentious relationship to Agile methods. There are inherent differences in perspective between those who focus on implementing software versus those who are concerned with data and information, especially at scale. The tendency among software engineers is to focus on the conceptual aspects of software, without concern for the physical issues of computing. (Logical versus physical is arguably the fundamental distinction at the heart of the development versus operations divide). Enterprise information managers also are tasked with difficult challenges of semantic interoperability across digital portfolios, concerns that may appear remote or irrelevant for fast-moving Agile teams.
As we have previously discussed, refactoring is one of the critical practices of Agile development, keeping systems flexible and current when used appropriately. The simple act of turning one overly large software class or module into two or three more cohesive elements is performed every day by developers around the world, as they strive for clean, well engineered code.
DevOps and Agile techniques can be applied to databases; in fact, there are important technical books such as Refactoring Databases by Ambler and Sadalage [19]. With smaller systems, there is little reason to avoid ongoing refactoring of data along with the code. Infrastructure as Code techniques apply. Database artifacts (e.g., SQL scripts, export/import scripts, etc.) must be under version control and should leverage continuous integration techniques. Test-driven development can apply equally well to database-related development.
But when data reaches a certain scale, its concerns start to become priorities. The bandwidth of UPS is still greater than that of the Internet [205]. That is to say, it is more effective and efficient, past a certain scale, to physically move data by moving the hard drives around, than to copy the data. The reasons are well understood and trace back to fundamental laws of physics and information first understood by Claude Shannon [254]. The concept of “data gravity” (quote above) seems consistent with Shannon’s work.
Notice that these physical limitations apply not just to simple movement of data, but also to complex refactoring. It is one thing to refactor code — even the SQL defining a table. Breaking an existing, overly large database table and its contents into several more specialized tables is a different problem if data is large. Data, in the sense understood by digital and IT professionals, is persistent. It exists as physical indications of state in the physical world: whether knotted ropes, clay tablets, or electromagnetic state.
If you are transforming 3 billion rows in a table, each row of data has to be processed. The data might take hours or days to be restructured, and what of the business needs in the meantime? These kinds of situations often have messy and risky solutions, that cannot easily be “rolled back":
-
A copy might be made for the restructuring, leaving the original table in place
-
When the large restructuring operation (perhaps taking hours or days) is completed, and new code is released, a careful conversion exercise must identify the records that changed while the large restructuring occurred
-
These records must then go through the conversion process again and be updated in the new data structure; they must replace the older data that was initially converted in step 1
All in all, this is an error-prone process, requiring careful auditing and cross-checking to mitigate the risk of information loss. It can and should be automated to the maximum degree possible. Modern web-scale architectures are often built to accommodate rolling upgrades in a more efficient manner (see [178], Chapter 11: “Upgrading Live Services”). Perhaps the data can be transformed on an “if changed, then transform” basis, or via other techniques. Nevertheless, schema changes can still be problematic. Some system outage may be unavoidable, especially in systems with strong transactional needs for complete integrity. (See earlier discussion of CAP theorem.)
Because of these issues, there will always be some contention between the software and information management perspectives. Software developers, especially those schooled in Agile practices, tend to rely on heuristics such as “do the simplest thing that could possibly work”. Such a heuristic might lead to a preference for a simpler data structure, that will not hold up past a certain scale.
An information professional, when faced with the problem of restructuring the now-massive contents of the data structure, might well say: “Why did you build it that way? Couldn’t you have thought a little more about this?” In fact, data management personnel often sought to intervene with developers, sometimes placing procedural requirements upon the development teams when database services were required. This approach is seen in waterfall development and when database teams are organized functionally.
We saw the classic model earlier in this Competency Category; in turn, define:
-
Conceptual data model
-
Logical data model
-
Physical schema
as a sequential process. However, organizations pressed for time often go straight to defining physical schemas. And indeed, if the cost of delay is steep, this behavior will not change. The only reason to invest in a richer understanding of information (e.g., conceptual and logical modeling), or more robust and proven data structures, is if the benefits outweigh the costs. Data and records management justifies itself when:
-
Systems are easier to adapt because they are well understood, and the data structures are flexible
-
Occurrence, costs, and risks of data refactoring are reduced
-
Systems are easier to use because the meaning of their information is documented for the end consumer (reducing support costs and operational risks)
-
Data quality is enabled or improved
-
Data redundancy is lessened, saving storage and management attention
-
Data and records-related risks (security, regulatory, liability) are mitigated through better data management
Again, back to our emergence model. By the time you are an enterprise, faced with the full range of governance, risk, security, and compliance concerns, you likely need at least some of the benefits promised by Enterprise Information Management. The risk is that data management, like any functional domain, can become an end in itself, losing sight of the reasons for its existence.
Next-Generation Practices in Information Management
Cross-Functional Teams
The value of cross-functional teams was discussed at length in Product and Function. This applies to including data specialists as team members. This practice alone can reduce many data management issues.
Domain-Driven Design’s (DDD) Contribution to Information Management
As you try to model a larger domain, it gets progressively harder to build a single unified model [105].
The relational database, with its fast performance and integrated schemas allowing data to be joined with great flexibility, has fundamentally defined the worldview of data managers for decades now. This model arguably reached its peak in highly-scaled mainframe systems, where all corporate data might be available for instantaneous query and operational use.
However, when data is shared for many purposes, it becomes very difficult to change. The analysis process starts to lengthen, and cost of delay increases for new or enhanced systems. This started to become a real problem right around the time that cheaper distributed systems became available in the market. Traditional data managers of large-scale mainframe database systems continued to have a perspective that “everything can fit in my database”. But the demand for new digital product outstripped their capacity to analyze and incorporate the new data.
The information management landscape became fragmented. One response was the enterprise conceptual data model. The idea was to create a sort of “master schema” for the enterprise, that would define all the major concepts in an unambiguous way. However, attempting to establish such a model can run into difficulties getting agreement on definitions. (See the ontology problem above.) Seeking such agreement again can impose the cost of delay if gaining agreement is required for the system. And if gaining agreement is optional, then why is agreement being sought? The risk is that the data architect becomes “ivory tower”.
| In fact, there are theoretical concerns at the heart of philosophy with attempting to formulate universal ontologies. They are beyond the scope of this document but if you are interested, start by researching semiotics and postmodernism. Such concerns may seem academic, but we see their consequences in the practical difficulty of creating universal data models. |
A pragmatic response to these difficulties is represented in the Martin Fowler quote above. Fowler recommends the practice of DDD, which accepts the fact that “different groups of people will use subtly different vocabularies in different parts of a large organization” [105] and quotes Eric Evans that “total unification of the domain model for a large system will not be feasible or cost-effective” [96].
Instead, there are various techniques for relating these contexts, beyond the scope of this document. (See [96].) Some will argue for the use of microservices, but data always wants to be recombined, so microservices have limitations as a solution for the problems of information management. And, before you completely adopt a DDD approach, be certain you understand the consequences for data governance and records management. Human resources records must be handled appropriately. Regulators and courts will not accept DDD as a defense for non-compliance.
Generic Structures and Inferred Schemas
Schema development — the creation of detailed logical and physical data and/or object models — is time-consuming and requires certain skills. Sometimes, application developers try to use highly generic structures in the database. Relational databases and their administrators prefer distinct tables for Customer, Invoice, and Product, with specifically identified attributes such as Invoice Date. Periodically, developers might call up the DBA and have a conversation like this (only slightly exaggerated):
“I need some tables.”
“OK, what are their descriptions?”
“Just give me 20 or so tables with 50 columns each. Call them Table1 through Table20 and Column1 through Column50. Make the columns 5,000-character strings, that way they can hold anything.”
“Ummm … You need to model the data. The tables and columns have to have names we can understand.”
“Why? I’ll have all that in the code.”
These conversations usually would result in an unsatisfied developer and a DBA further convinced that developers just didn’t understand data. A relational database, for example, will not perform well at scale using such an approach. Also, there is nothing preventing the developer from mixing data in the tables, using the same columns to store different things. This might not be a problem for smaller organizations, but in organizations with compliance requirements, knowing with confidence what data is stored where is not optional.
Such requirements do not mean that the developer was completely off track. New approaches to data warehousing use generic schemas similar to what the developer was requesting. The speed of indexing and proper records management can be solved in a variety of ways. Recently, the concept of the "data lake” has gained traction. Some data has always been a challenge to adapt into traditional, rigid, structured relational databases. Modern “web-scale” companies such as Google have pioneered new, less structured data management tools and techniques. The data lake integrates data from a large variety of sources but does not seek to integrate them into one master structure (also known as a schema) when they are imported. Instead, the data lake requires the analysts to specify a structure when the data is extracted for analysis. This is known as “schema-on-read”, in contrast to the traditional model of “schema-on-write”.
Data lakes, and the platforms that support them (such as Hadoop), were originally created as high-volume web data such as generated by Google. There was no way that traditional relational databases could scale to these needs, and the digital exhaust data was not transactional – it was harvested and in general never updated afterwards. This is an increasingly important kind of workload for digital organizations. As the IoT takes shape, and digital devices are embedded throughout daily experiences, high-volume, adaptable data stores (such as data lakes) will continue to spread.
Because log formats change, and the collaboration data is semi-structured, analytics will likely be better served with a “schema-on-read” approach. However, this means that the operational analysis is a significant development. Simplifying the load logic only defers the complexity. The data lake analyst must have a thorough understanding of the various event formats and other data brought into the lake, in order to write the operational analysis query.
“Schema-on-read” still may be a more efficient approach, however. Extensive schema development done up-front may be invalidated by actual data use, and such approaches are not as compatible with fast feedback. (Data services are also a form of product development and therefore fast feedback on their use is beneficial; the problem again is one of data gravity. Fast feedback works in software because code is orders of magnitude easier to change.)
Schema inference at the most general shades into ontology mining. In ontology mining, data (usually text-heavy) is analyzed by algorithms to derive the data model. If we read a textbook about the retail business, we might easily infer that there are concepts such as “store”, “customer”, “warehouse”, and “supplier”. IT has reached a point where such analysis itself can be automated, to a degree. Certain analytics systems have the ability to display an inferred table structure derived from unstructured or semi-structured data. This is an active area of research, development, and product innovation.
The challenge is that data still needs to be tagged and identified; regulatory concerns do not go away just because a NoSQL database is being used.
Append-Only to the Rescue?
Another technique that is changing the data management landscape is the concept of append-only. Traditional databases change values; for example, if you change “1004 Oak Av.” to “2010 Elm St.” in an address field, the old value is (in general) gone, unless you have specifically engineered the system to preserve it.
A common approach is the idea of “audited” or “effective-dated” fields, which have existed for decades. In an effective-dated approach, the “change” to the address actually looks like this in the database:
| Street address | From | To |
|---|---|---|
1004 Oak Av. |
12/1/1995 |
9/1/2016 |
2010 Elm St. |
9/2/2016 |
Present |
Determining the correct address requires a query on the To date field. (This is only an example; there are many ways of solving the problem.)
In this approach, data accumulates and is not deleted. (Capacity problems can, of course, be the result.) Append-only takes the idea of effective dating and applies it across the entire database. No values are ever changed, they are only superseded by further appends. This is a powerful technique, especially as storage costs go down. It can be combined with the data lake to create systems of great flexibility. But there are no silver bullets. Suppose that a distributed system has sacrificed consistency for availability and partition-tolerance (see CAP theorem). In that case, the system may wind up with data such as:
| Street address | From | To |
|---|---|---|
1004 Oak Av. |
12/1/1995 |
9/1/2016 |
2010 Elm St. |
9/2/2016 |
Present |
574 Maple St. |
9/2/2016 |
Present |
This is now a data quality issue, requiring after-the-fact exception analysis and remediation, and perhaps more complicated application logic.
Finally, append-only complements architectural and programming language trends towards immutability.
Test Data
… when teams have adequate test data to run automated tests, and can create that data on-demand, they see better IT performance.
2016 State of DevOps Report
A non-obvious and non-trivial problem at the intersection of Enterprise Information Management and DevOps is test data management.
What is test data management?
Suppose you are a developer working on a data-intensive system, one that (for example) handles millions of customer or supply chain records. Your code needs to support a wide variety of data inputs and outputs. At first, you just entered a few test names and addresses, like “Mickey Mouse” or “Bugs Bunny, 123 Carrot Way, Albuquerque, New Mexico 10001”. However, this nonsensical data quickly was shown not to work. For example, if you are testing integration with an address-scrubbing service, you will get an error with an address in New Mexico that shows a ZIP code of 10001. (Actually, the nonsensical data is useful in testing that particular error scenario. But that is only one of many error scenarios.)
Based on hearing anecdotal concerns, the authors of the 2016 State of DevOps report examined test data management practices and found that they correlated positively with “better IT performance, lower change failure rates, and lower levels of deployment pain and rework” [44 p. 29]. In particular, the report suggests that test data be minimized and created from a blank slate wherever possible.
Taking data from production systems as a basis for testing is also frequently done. However, such data must be sanitized — sensitive information such as social security number must be removed. This can be done automatically, but then such automation must itself be developed and maintained, and the extensive production data set may (in effect) be driving a large amount of non-value-add testing.
In general, test data management techniques will vary greatly by application and problem domain. The primary recommendation here is to invest in solving the problem, understanding that up-front investments in automation will pay off. The high-performing product team will have to solve the “how” of doing it appropriately for their particular situation.
Evidence of Notability
Agile methods and data management have had an uneasy relationship since Agile’s origins. See the writings of Scott Ambler for evidence of this topic’s notability.
Limitations
There are fundamental problems with data’s gravity in relationship to Agile methods. Multi-terabyte data sets often cannot be "refactored" with the ease and efficiency of their accessing software.
Related Topics
Information Management Topics
Description
Social, Mobile, Analytics, and Cloud
Discussions of Digital Transformation often reference the algorithm SMAC:
-
Social
-
Mobile
-
Analytics
-
Cloud computing
Others would add IoT. These are not equivalent terms; in fact, they have relationships to each other (see Social, Mobile, Analytics, and Cloud).
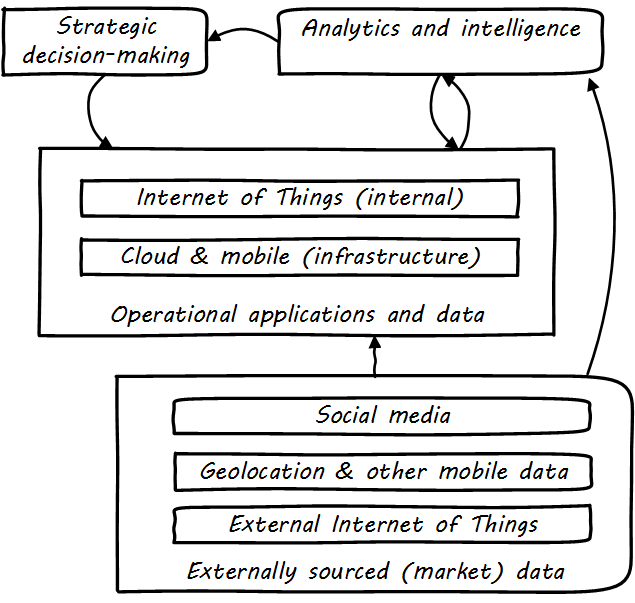
Social media is generally external to an organization and manifests as a form of commercial data, that provides essential insights into bow a company’s products are performing and being received.
Mobile (or mobility) has two distinct aspects: mobility as an engagement platform (e.g., for deployment of “apps” as one product form), versus the commercial data available from mobile carriers, notably geolocation data.
IoT can be either an internal or external data source, often extremely high volume and velocity, requiring analysis services for sense-making and value extraction.
Big Data
The term "Big Data” in general refers to data that exceeds the traditional data management and data warehousing approaches we have discussed above.
As proposed by analyst Doug Laney in 2001 [173], its most well-known definition identifies three dimensions of scale:
-
Volume
-
Variety
-
Velocity
For example, high-volume data is seen in the search history logs of search engines such as Google.
High-variety data encompasses rich media and unstructured data, such as social media interactions.
High-velocity data includes telemetry from IoT devices or other sources capable of emitting large volumes of data very quickly.
All of these dimensions require increasingly specialized techniques as they scale, and the data management product ecosystem has continued to diversify as a result.
Managing the Information of Digital Delivery
| We have talked about metadata previously, and understanding business impact with the CMDB. You should review that material before continuing. |
Regarding our previous data warehousing architecture, the digital pipeline can be seen as related to four areas (see The Data Architecture of Digital Management):
-
Product management
-
IT
-
Support
-
Operations
Assume the primary product of the organization is an information-centric digital service, based ultimately on data. How do you manage data? How do you manage anything? In part, through collecting data about it. Wait — “data about data"? There’s a word for that: metadata. We will take some time examining it, and its broader relationships to the digital delivery pipeline. The association of business definitions with particular data structures is one form of metadata. Data governance, records management, and ongoing support for digital consumers all require some layer of interpretation and context to enrich the raw data resource.
Consider the following list:
| Server | Database |
|---|---|
SRV001 |
DB0023 |
SRV001 |
DB0045 |
SRV002 |
DB0067 |
Not very useful, is it? Compare it to:
| Server | Database | Product | Regulatory |
|---|---|---|---|
SRV001 |
DB0023 |
Online reviews |
Customer privacy |
SRV001 |
DB0045 |
Employee records management |
HIPAA, PII |
SRV002 |
DB0067 |
Online sales |
PCI, PII |
We could also include definitions of the tables and columns held in each of those databases. However, what system would contain such data? There have been a couple of primary answers over the years: metadata repositories and CMDBs.
In terms of this document’s general definition of metadata as non-runtime information related to digital assets, both the metadata repository and the CMDB contain metadata. However, they are not the only systems in which data related to digital services is seen. Other systems include monitoring systems, portfolio management systems, risk and policy management systems, and much more. All of these systems themselves can be aggregated into a data warehousing/BI closed-loop infrastructure.
This means that the digital organization, including organizations transforming from older IT-centric models, can apply Big Data, machine learning, text analytics, and the rest of the techniques and practices covered in this Competency Category.
| We will examine a full “business of IT/digital delivery pipeline” architecture in the next Competency Category. |
Evidence of Notability
Considered in each specific topic area.
Limitations
Considered in each specific topic area.
Competency Category "Topics in Information Management" Example Competencies
-
Identify the themes of social, mobile, analytics, and cloud as modern digital channels and platforms
-
Identify the data management concerns of the digital pipeline itself
Related Topics