5. Work Management
5.1. Introduction
As two more assistants were added, however, coordination problems did arise. One day, Miss Bisque tripped over a pail of glaze and broke five pots; another day, Ms. Raku opened the kiln to find that the hanging planters had all been glazed fuchsia by mistake. At this point, she realized that seven people in a small pottery studio could not coordinate all their work through the simple mechanism of informal communication.
Structure in Fives
You’re a team. You need to get work done. When your startup hired its first employees, and you went from two people to three or four, you had to think about this. You are now getting feedback from both your users and your product team calling for prioritization, the allocation of resources, and the tracking of effort and completion. These are the critical day-to-day questions for any business larger than a couple of co-founders:
-
What do we need to do?
-
In what order?
-
Who is doing it?
-
Do they need help?
-
Do they need direction?
-
When will they be done?
-
What do we mean by done?
People have different responsibilities and specialties, yet there is a common vision for delivering an IT-based product of some value. How do you keep track of the work? Mostly, you are in the same location, but people sometimes are off-site or keeping different hours. Beyond your product strategy, you have support calls increasingly coming in that result in fixes and new features, and it’s all getting complicated.
You already have a product owner. You now institute Scrum practices of a managed backlog, daily standups, and sprints. You may also use Kanban-style task boards or card walls (to be described in this chapter), which are essential for things like support or other interrupt-driven work. The relationship of these to your Scrum practices is a matter of ongoing debate. You don’t think you need full-blown project management -— yet. You also may become aware of the idea of "ticketing,” if you have people with previous service desk experience. How this relates to your Scrum/Kanban approach is a question.
Furthermore, while we covered Agile principles and practices in some detail in Chapters 3 and 4, we did not discuss why they work. In this chapter, we will cover the Lean theory of product management that provides a basis for Agile practices, in particular, the work of Don Reinertsen.
The chapter title “Work Management” reflects earlier stages of organizational growth. At this point, neither formal project management, nor a fully realized process framework is needed, and the organization may not see a need to distinguish precisely between types of work processes. “It’s all just work” at this stage.
5.1.1. Chapter 5 outline
-
Introduction
-
Task management
-
Learning from manufacturing
-
Kanban and its Lean origins
-
The Theory of Constraints
-
Queues and limiting work in process
-
Scrum, Kanban, or both?
-
-
The shared mental model of the work to be done
-
Visualization
-
Andon, and the Andon Cord
-
Definition of done
-
Time and space shifting
-
-
The service desk and related tools
-
Lean product development and Don Reinertsen
-
Lean product development
-
Cost of delay
-
-
Advanced topics
-
Essay: Kanban, process, and respect for people
-
-
Conclusion
5.1.2. Chapter 5 learning objectives
-
Understand the basic concept of task management
-
Describe how to apply insights from manufacturing to digital product management correctly
-
Define Kanban and identify its key practices
-
Compare and contrast Scrum and Kanban
-
Understand concepts from Lean Product Management
5.2. Task management
Task management is the process of managing a task through its lifecycle. It involves planning, testing, tracking, and reporting. Task management can help individuals achieve goals, or groups of individuals collaborate and share knowledge for the accomplishment of collective goals.
Task Management
Product development drives a wide variety of work activities. As your product matures, you encounter both routine and non-routine work. Some of the work depends on other work getting done. Sometimes you do not realize this immediately. All of this work needs to be tracked.
Work management may start with verbal requests, emails, even postal mail. If you ask your colleague to do one thing, and she doesn’t have anything else to do, it’s likely that the two of you will remember. If you ask her to do four things over a few days, you might both still remember. But if you are asking for new things every day, it is likely that some things will get missed. You each might start keeping your own “to do” list, and this mechanism can handle a dozen or two dozen tasks. Consider an example of three people, each with their own to do list (see Work flowing across three to-do lists).
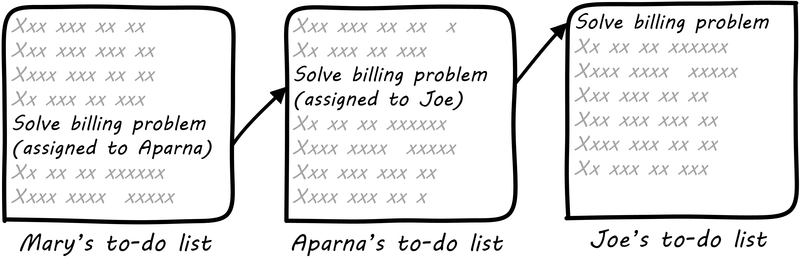
In this situation, each person has their own “mental model” of what needs to be done, and their own tracking mechanism. We don’t know how the work is being transmitted: emails, phone calls, hallway conversations. ("Say, Joe, there is an issue with Customer X’s bill, can you please look into it?”)
But what happens when there are three of you? Mary asks Aparna to do something, and in order to complete it, she needs something from Joe, whom Mary is also asking to complete other tasks. As an organization scales, this can easily lead to confusion and “dropped balls” (see Task handoffs present risk [1]).

At some point, you need to formalize your model of the work, how it is described, and how it flows. This is such a fundamental problem in human society that many different systems, tools, and processes have been developed over the centuries to address it.
Probably the most important is the shared task reference point. What does this mean? The “task” is made “real” by associating it with a common, agreed artifact.
For example, a “ticket” may be created, or a "work order.” Or a “story,” written down on a sticky note. At our current level of understanding, there is little difference between these concepts. The important thing they have in common is an independent existence. That is, Mary, Aparna, and Joe might all change jobs, but the artifact persists independently of them. Notice also that the artifact — the ticket, the post-it note — is not the actual task, which is an intangible, consensus concept. It is a representation of this intangible “intent to perform.” We will discuss these issues of representation further in Chapter 11.
A complex IT-based system is not needed if you are all in the same room! (Nor for that matter a complex process framework, such as ITIL or CObIT. There is a risk in using such frameworks at this stage of evolution — they add too much overhead for your level of growth). It’s also still too early for formal project management. The “project team” would be most or all of the organization, so what would be the point? A shared white board in a public location might be all that is needed (see Common list). This gives the team a “shared mental model” of who is doing what.
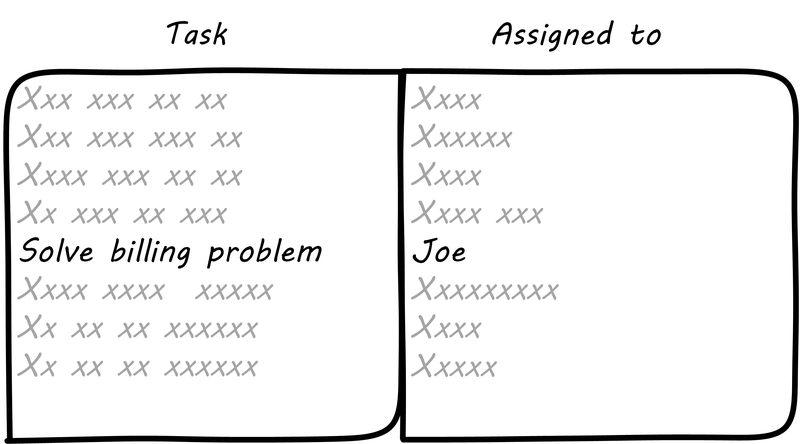
The design of the task board above has some issues, however. After the team gets tired of erasing and rewriting the tasks and their current assignments, they might adopt something more like this:
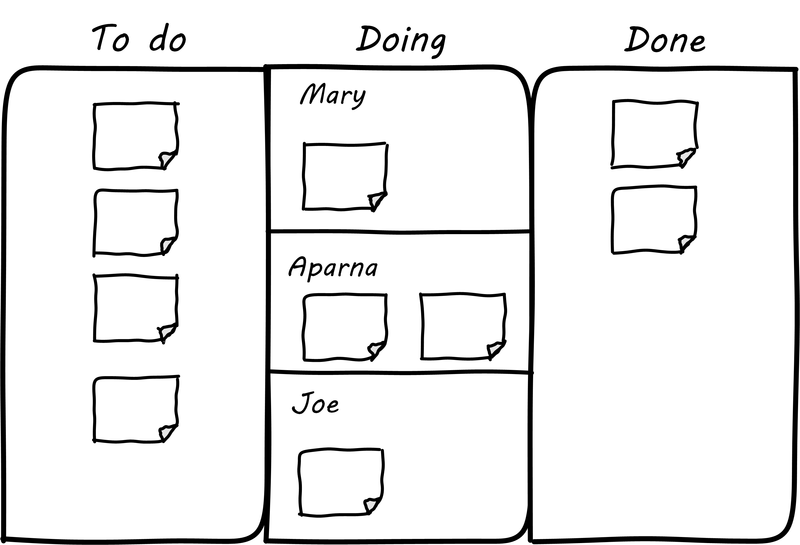
The board itself might be a white board or a cork bulletin board with push pins (see Simple task board). The notes could be sticky, or index cards. There are automated solutions as well. The tool doesn’t really matter. The important thing is that, at a glance, the entire team can see its flow of work and who is doing what.
()card wall)This is sometimes called a “Kanban board,” although David Anderson (originator of the Kanban software method [14]) himself terms the basic technique a "card wall.” It also has been called a "Scrum Board.” The board at its most basic is not specific to either methodology. The term “Kanban” itself derives from Lean manufacturing principles; we will cover this in depth in the next section. The basic board is widely used because it is a powerful artifact. Behind its deceptive simplicity are considerable industrial experience and relevant theory from operations management and human factors. However, it has scalability limitations. What if the team is not all in the same room? We will cover this and related issues in Part III.
|
Important
|
The card wall or Kanban board is the first channel we have for demand management. Demand management is a term meaning “understanding and planning for required or anticipated services or work.” Managing day-to-day incoming work is a form of demand management. Capturing and assessing ideas for next year’s project portfolio (if you use projects) is also demand management at a larger scale. |
5.3. Learning from manufacturing
Manufacturing? What do digital professionals have to learn from that? “Our work is not an assembly line!” is one frequently heard response. It is true that we need to be careful in drawing the right lessons from manufacturing, but there is a growing consensus on how to do this. Please keep an open mind as you read this chapter.
5.3.1. Kanban and its Lean origins
To understand Kanban let’s discuss Lean briefly. We’ve had a passing mention of Lean already in this book. But what is it?
|
Important
|
Lean is important. Regardless of your intended career path, it is advisable to read the great Lean classics, including The Machine That Changed the World, Lean Thinking, The Toyota Way, and Ohno’s own Toyota Production System. Toyota Kata is a more recent, in-depth analysis of Toyota’s culture. |
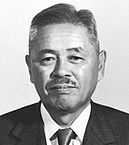
Lean is a term invented by American researchers who investigated Japanese industrial practices and their success in the 20th century. After the end of World War II, no-one expected the Japanese economy to recover the way it did. The recovery is credited to practices developed and promoted by Taiichi Ohno and Shigeo Shingo at Toyota (see Lean pioneer Taichi Ohno [2]). These practices included:
-
Respect for people
-
Limiting work in process
-
Small batch sizes (driving towards “single piece flow”)
-
Just-in-time production
-
Decreased cycle time
Credit for Lean is also sometimes given to U.S. thinkers such as W.E. Deming, Peter Juran, and the theorists behind the Training Within Industry methodology, each of whom played influential roles in shaping the industrial practices of post-war Japan.
Kanban is a term originating from Lean and the Toyota Production System. Originally, it signified a “pull” technique in which materials would only be transferred to a given workstation on a definite signal that the workstation required the materials. This was in contrast to “push” approaches where work was allowed to accumulate on the shop floor, on the (now discredited) idea that it was more “efficient” to operate workstations at maximum capacity.
Factories operating on a “push” model found themselves with massive amounts of inventory (work in process) in their facilities. This tied up operating capital and resulted in long delays in shipment. Japanese companies did not have the luxury of large amounts of operating capital, so they started experimenting with "single-piece flow.” This led to a number of related innovations, such as the ability to re-configure manufacturing machinery much more quickly than U.S. factories were capable of.
David J. Anderson was a product manager at Microsoft who was seeking a more effective approach to managing software development. In consultation with Don Reinertsen (introduced below) he applied the original concept of Kanban to his software development activities [14].
Scrum (covered in the previous chapter) is based on a rhythm with its scheduled sprints, for example, every two weeks. In contrast, Kanban is a continuous process with no specified rhythm (also known as cadence). Work is “pulled” from the backlog into active attention as resources are freed from previous work. This is perhaps the most important aspect of Kanban — the idea that work is not accepted until there is capacity to perform it.
You may have a white board covered with sticky notes, but if they are stacked on top of each other with no concern for worker availability, you are not doing Kanban. You are accepting too much work in process, and you are likely to encounter a “high-queue state” in which work becomes slower and slower to get done. (More on queues below).
5.3.2. The Theory of Constraints
Eliyahu Moshe Goldratt was an Israeli physicist and management consultant, best known for his pioneering work in management theory, including The Goal, which is a best-selling business novel frequently assigned in MBA programs. It and Goldratt’s other novels have had a tremendous effect on industrial theory, and now, digital management. One of the best known stories in The Goal centers around a Boy Scout march. Alex, the protagonist struggling to save his manufacturing plant, takes a troop of Scouts on a ten mile hike. The troop has hikers of various speeds, yet the goal is to arrive simultaneously. As Alex tries to keep the Scouts together, he discovers that the slowest, most overweight scout (Herbie) also has packed an unusually heavy backpack. The contents of Herbie’s pack are redistributed, speeding up both Herbie and the troop.
This story summarizes the Goldratt approach: finding the “constraint” to production (his work as a whole is called the Theory of Constraints). In Goldratt’s view, a system is only as productive as its constraint. At Alex’s factory, it’s found that the “constraint” to the overall productivity issues is the newest computer-controlled machine tool -— one that could (in theory) perform the work of several older models but was now jeopardizing the entire plant’s survival. The story in this novelization draws important parallels with actual Lean case studies on the often-negative impact of such capital-intensive approaches to production.
There is a tremendous wealth of material available on Lean history and theory, and the IT student is urged to become familiar with it. Often, IT professionals resist drawing lessons from non-IT fields, because of a perception that these other fields (especially manufacturing) are “deterministic” while IT systems development is too “uncertain.” In reality, manufacturing is less deterministic than IT professionals often perceive, while software development is, at its most uncertain, just another form of new product development, and/or research and development and therefore can be managed on that basis. Furthermore, much IT work is not R&D (e.g.,infrastructure provisioning), and that kind of work is even more suited for the application of manufacturing insights.

Between 2005 and 2012, I was a lead Enterprise Architect at Wells Fargo Bank, primarily concerned with IT delivery capabilities such as portfolio and service management. One day around 2007, I arrived at my office to find an envelope from my friend Gene Kim, then CTO of Tripwire. Gene and I had been corresponding for some years on high-performing IT, IT process improvement, and related topics. In the envelope was a copy of a book called The Goal, by Eli Goldratt [109]. I was a little mystified, but after reading the book, I began to understand.
Gene saw the potential of the Theory of Constraints in understanding certain aspects of IT management and used it as a template to write another remarkable and influential book, The Phoenix Project [153]. Rather than a manufacturing plant, the Phoenix Project centers on the struggles of the IT team at a medium-sized automotive parts manufacturer and retailer. From a state of chaos, uncontrolled work in process and resource constraints, the team applies Lean, Agile, and DevOps techniques to great effect. In my view, The Phoenix Project is one of the most important works in the history of IT and digital management – in addition to being an enjoyable novel. I am honored to have been one of the original reviewers. If you are considering a career in IT or digital, it is essential reading. See especially Chapter 30 for an interesting discussion of manufacturing lessons in an IT context.
5.3.3. Queues and limiting work in process
Queues matter because they are economically important, they are poorly managed, and they have the potential to be much better managed. Queues profoundly affect the economics of product development. They cause valuable work products to sit idle, waiting to access busy resources. This idle time increases inventory, which is the root cause of many other economic problems; queues hurt cycle time, quality, and efficiency.
Principles of Product Development Flow

Even at this stage of our evolution, with just one co-located collaborative team, it’s important to consider work in process and how to limit it. One topic we will emphasize throughout the rest of this book is queuing. What is a queue? (see A queue [3]). A queue, intuitively, is a collection of tasks to be done, being serviced by some worker or resource in some sequence, for example:
-
Feature “stories” being developed by a product team
-
Customer requests coming into a service desk
-
Requests from a development team to an infrastructure team for services (e.g.,network or server configuration, consultations, etc.)
|
Important
|
Queuing theory is an important branch of mathematics used extensively in computing, operations research, networking, and other fields. It’s a topic getting much attention of late in the Agile and related movements, especially as it relates to digital product team productivity. |
The amount of time that any given work item spends in the queue is proportional to how busy the servicing resource is. The simple formula, known as Little’s Law, is:
Wait time = (% Busy) / (% Idle)
In other words, if you divide the percentage of busy time for the resource by its idle time, you see the average wait time. So, if a resource is busy 40% of the days, but idle 60% of the days, the average time you wait for the resource is:
0.4/0.6= 0.67 hours (2/3 of a day)
Conversely, if a resource is busy 95% of the time, the average time you’ll wait is:
0.95/0.05 = 5.67 (19 days!)
If you use a graphing calculator, you see the results in Time in queue increases exponentially with load.
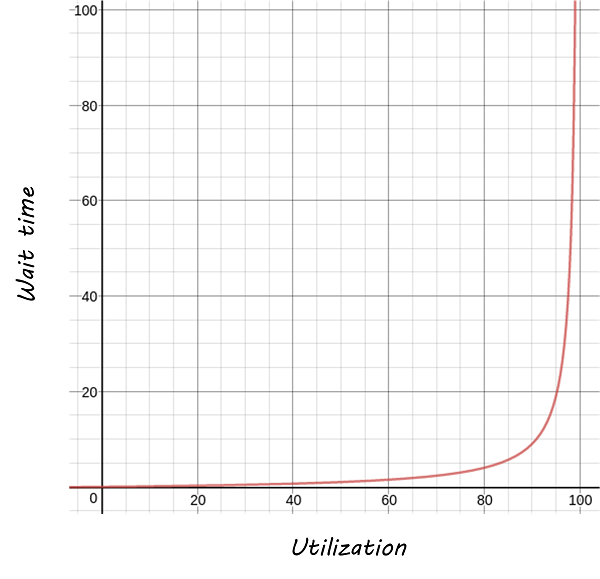
Notice how the wait time approaches infinity as the queue utilization approaches 100%. And yet, full utilization of resources is often sought by managers in the name of “efficiency.” These basic principles are discussed by Gene Kim et al. in the Phoenix Project [153] in Chapter 23, and more rigorously by Don Reinertsen in The Principles of Product Development Flow [220], Chapter 3. A further complication is when work must pass through multiple queues; wait times for work easily expand to weeks or months. Such scenarios are not hypothetical, they are often seen in the real world and are a fundamental cause of IT organizations getting a bad name for being slow and unresponsive. Fortunately, digital professionals are gaining insight into these dynamics and (as of 2016) matters are improving across the industry.
Understanding queuing behavior is critical to productivity. Reinertsen suggests that poorly managed queues contribute to:
-
Longer cycle time
-
Increased risk
-
More variability
-
More overhead
-
Lower quality
-
Reduced motivation
These issues were understood by the pioneers of Lean manufacturing, an important movement throughout the 20th century. One of its central principles is to limit work in process. Work in process is obvious on a shop floor because physical raw materials (inventory) are quite visible (see Physical work in process [4]).

Don Reinertsen developed the insight that product design and development had an invisible inventory of “work in process” that he called Design in Process (DIP). Just as managing physical work in process on the factory floor is key to a factory’s success, so correctly understanding and managing design in process is essential to all kinds of research and development organizations -— including digital product development, e.g., building software(!). In fact, because digital systems are largely invisible even when finished, understanding their work in process is even more challenging.
It is easy and tempting for a product development team to accumulate excessive amounts of work in process. And, to some degree, having a rich backlog of ideas is an asset. But, just as some inventory (e.g.,groceries) is perishable, so are design ideas. They have a limited time in which they might be relevant to a customer or a market. Therefore, accumulating too many of them at any point in time can be wasteful.
What does this have to do with queuing? DIP is one form of queue seen in the digital organization. Other forms include unplanned work (incidents and defects), implementation work, and many other concepts we’ll discuss in this chapter.
Regardless of whether it is a “Requirement,” a “User Story,” an “Epic,” “Defect," “Issue,” or “Service Request,” you should remember it’s all just work. It needs to be logged, prioritized, assigned, and tracked to completion. Queues are the fundamental concept for doing this, and it’s critical that digital management specialists understand this.
|
Important
|
These concepts of work in process and queuing are the basis for much of the rest of this book. Be sure you are completely comfortable with them. |
Finally, some rules of thumb:
-
Finish what you start, if you can, before starting anything else. When you work on three things at once, the multi-tasking wastes time, and it takes you three times longer to get any one of the things done. (More on multi-tasking in this chapter).
-
Infinitely long to-do lists (backlog) sap motivation. Consider limiting backlog as well as work in process.
-
Visibility into work in process is important for the collective mental model of the team.
There are deeper philosophical and cultural qualities to Kanban beyond workflow and queuing. Anderson and his colleagues continue to evolve Kanban into a more ambitious framework. Mike Burrows [45] identifies the following key principles:
-
Start with what you do now
-
Agree to pursue evolutionary change
-
Initially, respect current processes, roles, responsibilities, and job titles
-
Encourage acts of leadership at every level in your organization —from individual contributor to senior management
-
Visualize
-
Limit Work-in-Progress (WIP)
-
Manage flow
-
Make policies explicit
-
Implement feedback loops
-
Improve collaboratively, evolve experimentally (using models and the scientific method)
5.3.4. Multi-tasking
Multi-tasking (in this context) is when a human attempts to work on diverse activities simultaneously; for example developing code for a new application while also handling support calls). There is broad agreement that multi-tasking destroys productivity, and even mental health [57]. Therefore, minimize multi-tasking. Multi-tasking in part emerges as a natural response when one activity becomes blocked (e.g.,due to needing another team’s contribution). Approaches that enable teams to work without depending on outside resources are less likely to promote multi-tasking. Queuing and work in process thus become even more critical topics for management concern as activities scale up [5].

5.3.5. Scrum, Kanban, or both?
So, do you choose Scrum, Kanban, both, or neither? We can see in comparing Scrum and Kanban that their areas of focus are somewhat different:
-
Scrum is widely adopted in industry and has achieved a level of formalization, which is why Scrum training is widespread and generally consistent in content.
-
Kanban is more flexible but this comes at the cost of more management overhead. It requires more interpretation to translate to a given organization’s culture and practices.
-
As Scrum author Ken Rubin notes, “Scrum is not well suited to highly interrupt-driven work” [232]. Scrum on the service desk doesn’t work. (But if your company is too small, it may be difficult to separate out interrupt-driven work! We will discuss the issues around interrupt-driven work further in Chapter 6).
-
Finally, hybrids exist (Ladas' “Scrumban” [164]).
Ultimately, instead of talking too much about “Scrum” or “Kanban,” the student is encouraged to look more deeply into their fundamental differences. We will return to this topic in the section on Lean Product Development.
5.4. The shared mental model of the work to be done
Joint activity depends on interpredictability of the participants’ attitudes and actions. Such interpredictability is based on common ground — pertinent knowledge, beliefs, and assumptions that are shared among the involved parties. [155]
“Common Ground and Coordination in Joint Activity"
The above quote reflects one of the most critical foundations of team collaboration: a common ground, a base of “knowledge, beliefs, and assumptions” enabling collaboration and coordination. Common ground is an essential quality of successful teamwork, and we will revisit it throughout the book. There are many ways in which common ground is important, and we will discuss some of the deeper aspects in terms of information in Chapter 11. Whether you choose Scrum, Kanban, or choose not to label your work management at all, the important thing is that you are creating a shared mental model of the work: its envisioned form and content, and your progress towards it.
In this section, we’ll discuss:
-
Visualization of work
-
The concept of Andon
-
The definition of done
-
Time and space shifting
Visualization is a good place to introduce the idea of common ground.
5.4.1. Visualization
As simple as the white board is, it makes WIP continuously visible, it enforces WIP constraints, it creates synchronized daily interaction, and it promotes interactive problem solving. Furthermore, teams evolve methods of using white boards continuously, and they have high ownership in their solution. In theory, all this can be replicated by a computer system. In practice, I have not yet seen an automated system that replicates the simple elegance and flexibility of a manual system.
Principles of Product Development Flow
Why are shared visual representations important? Depending on how you measure, between 40% to as much as 80% of the human cortex is devoted to visual processing. Visual processing dominates mental activity, consuming more neurons than the other four senses combined [242]. Visual representations are powerful communication mechanisms, well suited to our cognitive abilities.
This idea of common ground, a shared visual reference point, informing the mental model of the team, is an essential foundation for coordinating activtity (see Two people and a Kanban board [6]).

This is why card walls or Kanban boards located in the same room are so prevalent. They communicate and sustain the shared mental model of a human team. A shared card wall, with its two dimensions and tasks on cards or sticky notes, is more informative than a simple to-do list (e.g., in a spreadsheet). The cards occupy two dimensional space and are moved over time to signify activity, both powerful cues to the human visual processing system.
Similarly, monitoring tools for systems operation make use of various visual clues. Large monitors may be displayed prominently on walls so that everyone can understand operational status. Human visual orientation is also why Enterprise Architecture persists. People will always draw to communicate. (More on visualization and Enterprise Architecture in Chapter 12).
Card walls and publicly displayed monitors are both examples of information radiators. The information radiator concept derives from the Japanese concept of Andon, important in Lean thinking.
5.4.2. Andon, and the Andon cord
Andon is a manufacturing term referring to a system to notify management, maintenance, and other workers of a particular quality or process problem. The centrepiece is a signboard incorporating signal lights to indicate which workstation has the problem. The alert can be activated manually by a worker using a pullcord or button or may be activated automatically by the production equipment itself. The system may include a means to stop production so the issue can be corrected. Some modern alert systems incorporate audio alarms, text, or other displays.
https://en.wikipedia.org/wiki/Andon_(manufacturing)
The Andon Cord (not to be confused with Andon in the general sense) is another well known concept in Lean Manufacturing. It originated with Toyota, where line workers were empowered to stop the production line if any defective materials or assemblies were encountered. Instead of attempting to work with the defective input, the entire line would shut down, and all concerned would establish what had happened and how to prevent it. The concept of andon cord concisely summarizes the Lean philosophy of employee responsibility for quality at all levels [200]. Where Andon is a general term for information radiator, the Andon cord implies a dramatic reponse to the problems of flow — all progress is stopped, everywhere along the line, and the entire resources of the production line are marshalled to collaboratively solve the issue so that it does not happen again. As Toyota thought leader Taiichi Ohno states:
Stopping the machine when there is trouble forces awareness on everyone. When the problem is clearly understood, improvement is possible. Expanding this thought, we establish a rule that even in a manually operated production line, the workers themselves should push the stop button to halt production if any abnormality appears.
Andon and information radiators provide an important stimulus for product teams, informing priorities and prompting responses. They do not prescribe what is to be done; they simply indicate an operational status that may require attention.
5.4.3. Definition of done
As work flows through the system performing it, understanding its status is key to managing it. One of the most important mechanisms for doing this is to define what is meant by “done simply.” The Agile Alliance states:
“The team agrees on, and displays prominently somewhere in the team room, a list of criteria which must be met before a product increment, often a user story, is considered “done” [7]. Failure to meet these criteria at the end of a sprint normally implies that the work should not be counted toward that sprint’s velocity.” There are various patterns for defining “done,” for example, Thoughtworks recommends that the business analyst and developer both must agree that some task is complete (it is not up to just one person). Other companies may require peer code reviews [196]. The important point is that the team must agree on the criteria.
This idea of defining “done” can be extended by the team to other concepts such as “blocked.” The important thing is that this is all part of the team’s shared mental model, and is best defined by the team and its customers. (However, governance and consistency concerns may arise if teams are too diverse in such definitions).
5.4.4. Time and space shifting
At some point, your team will be faced with the problems of time and/or space shifting. People will be on different schedules, or in different locations, or both. There are two things we know about such working relationships. First, they lead to sub-optimal team communications and performance. Second, they are inevitable.
The need for time and space shifting is one of the major drivers for more formalized IT systems. It is difficult to effectively use a physical Kanban board if people aren’t in the office. The outcome of the daily standup needs to be captured for the benefit of those who could not be there.
However, acceptance of time and space shifting may lead to more of it, even when it is not absolutely required. Constant pressure and questioning are recommended, given the superior bandwidth of face-to-face communication in the context of team collaboration.
But not all work requires the same degree of collaboration. While we are still not ready for full scale process management, at this point in our evolution, we likely will encounter increasing needs to track customer or user service interactions, which can become quite numerous even for small, single-team organizations. Such work is often more individualized and routine, not requiring the full bandwidth of team collaboration. We’ll discuss this further with the topic of the Help or Service Desk, later in this chapter.
5.5. Lean product development and Don Reinertsen
|
Note
|
We introduce Lean Product Development here and not in Chapter 4 because it is more about how the work is done, rather than what the content is. In particular, it requires an understanding of queuing. |
5.5.1. Product development versus production
The idea of software development as an assembly line manned by semi-skilled interchangeable workers is fundamentally flawed and wasteful [260].
C++ inventor
One of the challenges with applying Lean to IT (as noted previously) is that many IT professionals (especially software developers) believe that manufacturing (see Production [7]) is a “deterministic” field, whose lessons don’t apply to developing technical products. “Creating software is like creating art, not being on an assembly line,” is one line of argument.
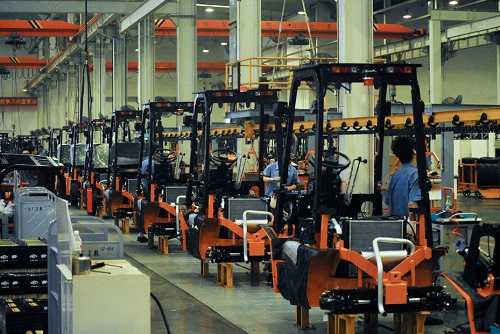
The root cause of this debate is the distinction between product development and production. It is true that an industrial production line, for example producing forklifts by the thousands, may be repetitive. But how did the production line come to be? How was the forklift invented, or developed? It was created as part of a process of product development. It took mechanical engineering, electrical engineering, chemistry, materials science, and more. Combining fundamental engineering principles and techniques into a new, marketable product is not a repetitive process; it is a highly variable, creative process, and always has been.
|
Warning
|
Never confuse production with product development. The approaches, measures, and concerns are radically different. This book considers it an “original sin.” |

One dead end that organizations keep pursuing is the desire to make research and development R&D, more “predictable"; that is, to reduce variation and predictably create innovations (Research and development [8]). This never works well; game-changing innovations are usually complex responses to complex market systems dynamics, including customer psychology, current trends, and many other factors. The process of innovating cannot, by its very nature, be made repeatable.
|
Warning
|
The concept of a repeatable “software process” is at best a risky one, and an idea that has caused much waste in the industry. |
In IT, simply developing software for a new problem (or even new software for an old problem) is an R&D problem, not a production line problem. It is iterative, uncertain, and risky, just like other forms of product development. That does not mean it is completely unmanageable, or that its creation is a mysterious, artistic process. It is just a more variable process with a higher chance of failure, and with a need to incorporate feedback quickly to reduce the risk of open-loop control failure. These ideas are well known to the Agile community and its authors. However, there is one thought leader who stands out in this field: ex-Naval officer and nuclear engineer named Donald Reinertsen who was introduced in our previous discussions on beneficial variability in product discovery and queuing.
There are many books on Agile development and management. Consider the following books, all well known and influential in the fields of software development and Agile:
-
David Anderson, Kanban: Successful Evolutionary Change for Your Technology Business
-
Craig Larman and Bas Vodde, Scaling Lean & Agile Development: Thinking and Organizational Tools for Large-Scale Scrum
-
Jim Highsmith, Adaptive Software Development: An Evolutionary Approach to Managing Complex Systems
-
Jez Humble, Joanne Molesky, and Barry O’Reilly, Lean Enterprise: How High Performance Organizations Innovate at Scale
-
Dean Leffingwell, Agile Software Requirements: Lean Requirements Practices for Teams, Programs, and the Enterprise
-
Steve McConnell, Rapid Development: Taming Wild Software Schedules
-
Roman Pichler, Agile Product Management with Scrum: Creating Products That Customers Love
-
Mary and Tom Poppendieck, Lean Software Development: An Agile Toolkit for Software Development Managers
What do they all have in common? They all cite Don Reinertsen. Reinertsen’s work dates back to 1991, and (orginally as a co-author with Preston G. Smith) presaged important principles of the Agile movement [253], from the general perspective of product development. Reinertsen’s influence is well documented and notable. He was partnering with David Anderson when Anderson created the “software Kanban” approach. He wrote the introduction to Leffingwell’s Agile Software Requirements, the initial statement of the Scaled Agile Framework. His influence is pervasive in the Agile community. His work is deep and based on fundamental mathematical principles such as queueing theory. His work can be understood as a series of interdependent principles:
-
The flow or throughput of product innovation is the primary driver of financial success. (Notice that innovation must be accepted by the market — simply producing a new product is not enough).
-
Product development is essentially the creation of information.
-
The creation of information requires fast feedback.
-
Feedback requires limiting work in process.
-
Limiting work in process in product design contexts requires rigorous prioritization capabilities.
-
Effective, economical prioritization requires understanding the cost of delay for individual product features.
-
Understanding cost of delay requires smaller batch sizes, consisting of cohesive features, not large projects.
These can be summarized as in Lean Product Development hierarchy of concerns.
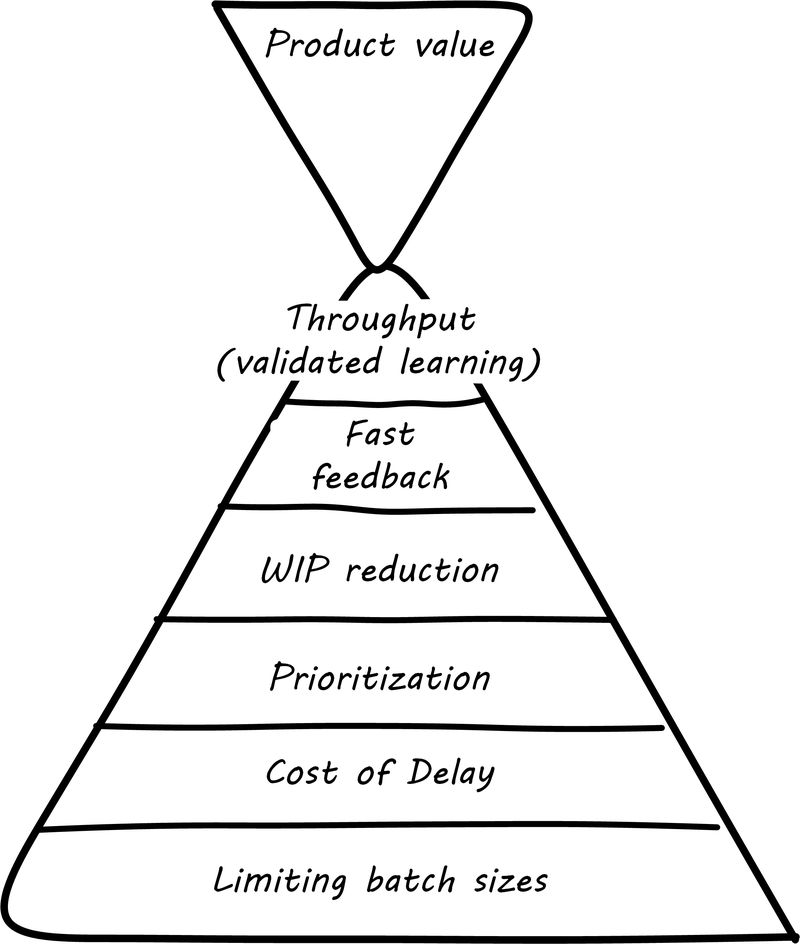
If a company wishes to innovate faster than competitors, it requires fast feedback on its experiments (whether traditionally understood, laboratory-based experiments, or market-facing validation as in Lean Startup. In order to achieve fast feedback, work in process must be reduced in the system, otherwise high-queue states will slow feedback down.
But how do we reduce work in process? We have to prioritize. Do we rely on the Highest Paid Person’s Opinion, or do we try something more rational? This brings us to the critical concept of cost of delay.
5.5.2. Cost of delay
If you measure only one thing, measure cost of delay.
Principles of Product Development Flow
Don Reinertsen is well known for advocating the concept of “cost of delay” in understanding product economics. The term is intuitive; it represents the loss experienced by delaying the delivery of some value. For example, if a delayed product misses a key trade show, and therefore its opportunity for a competitive release, the cost of delay might be the entire addressable market. Understanding cost of delay is part of a broader economic emphasis that Reinertsen brings to the general question of product development. He suggests that product developers, in general, do not understand the fundamental economics of their decisions regarding resources and work in process.
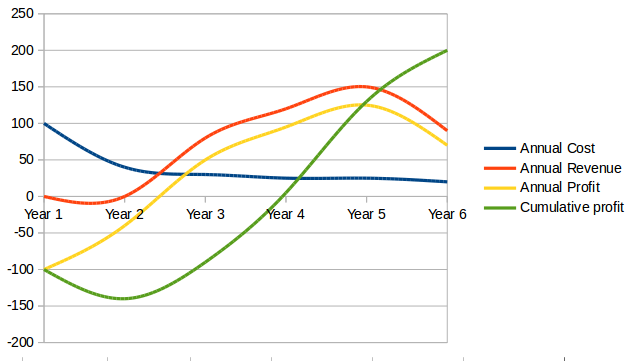
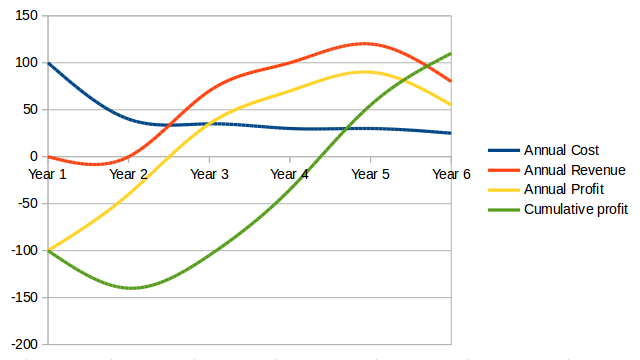
In order to understand the cost of delay, it is first necessary to think in terms of a market-facing product (such as a smartphone application). Any market-facing product can be represented in terms of its lifecycle revenues and profits (see Product lifecycle economics by year , see Product lifecycle economics, charted).
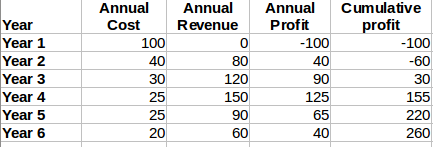
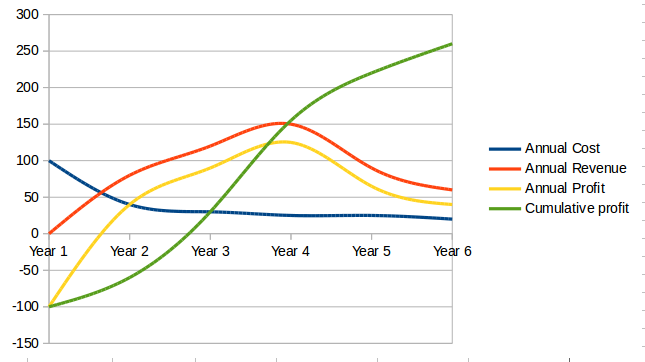
The numbers above represent a product lifecycle, from R&D through production to retirement. The first year is all cost, as the product is being developed, and net profits are negative. In year 2, a small net profit is shown, but cumulative profit is still negative, as it remains in year 3. Only into year 3 does the product break even, ultimately achieving lifecycle net earnings of 175. But what if the product’s introduction into the market is delayed? The consequences can be severe.
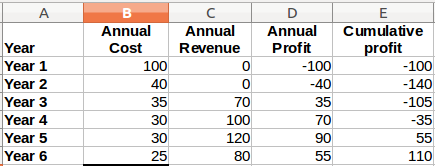
Simply delaying delivery by a year, all things being equal in our example, will reduce lifeycle profits by 30% (see Product lifecycle, simple delay, Product lifecycle, simple delay, charted).
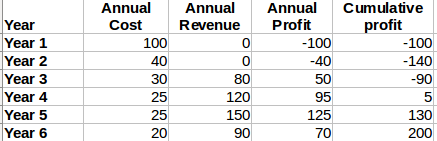
But all things are not equal. What if, in delaying the product for a year, we allow a competitor to gain a superior market position? That could depress our sales and increase our per-unit costs — both bad (see Product lifecycle, aggravated delay, Product lifecycle, aggravated delay, charted):
The advanced cost of delayed analysis argues that different product lifecycles have different characteristics. Josh Arnold of Black Swan Farming has visualized these as a set of profiles [17]. See Simple cost of delay footnote:[similar to [17] for the simple delay profile.
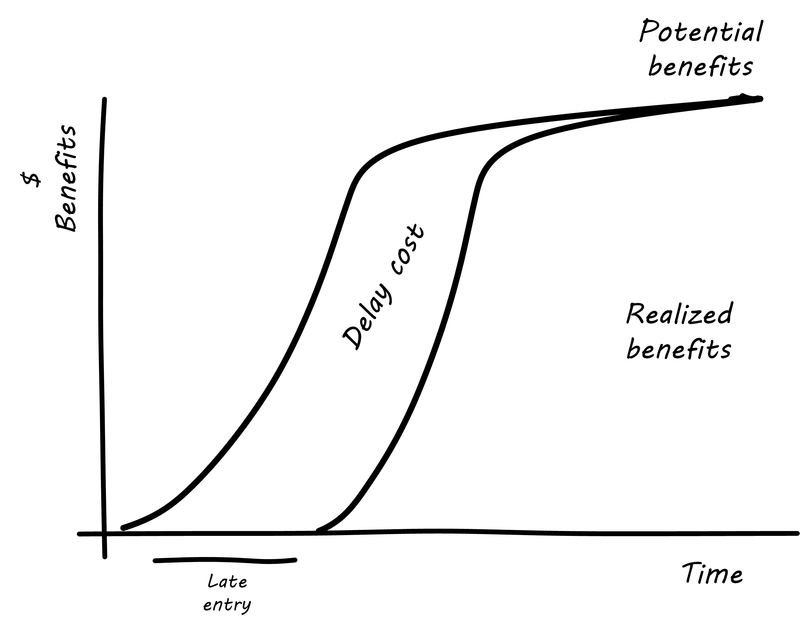
In this delay curve, while profits and revenues are lost due to late entry, it’s assumed that the product will still enjoy its expected market share. We can think of this as the “iPhone versus Android” profile, as Android was later but still achieved market parity. The aggravated cost of delay profile, however, looks like Aggravated cost of delay footnote:[similar to [17].
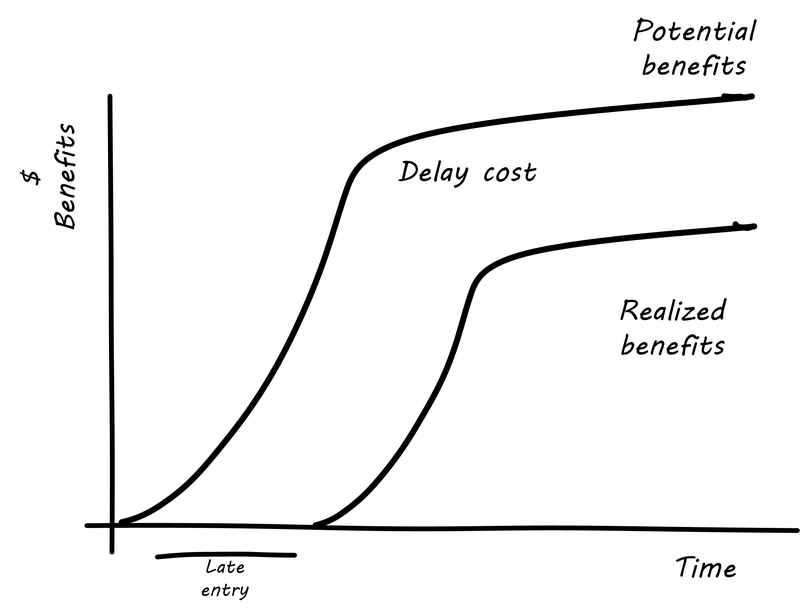
In this version, the failure to enter the market in a timely way results in long-term loss of market share. We can think of this as the “Amazon Kindle versus Barnes & Noble Nook” profile, as the Nook has not achieved parity, and does not appear likely to. There are other delay curves imaginable, such as delay curves for tightly time-limited products (e.g.,such as found in the fashion industry) or cost of delay that’s only incurred after a specific date (such as in complying with a regulation).
Reinertsen observes that product managers may think that they intuitively understand cost of delay, but when he asks them to estimate the aggregate cost of (for example) delaying their product’s delivery by a given period of time, the estimates provided by product team participants in a position to delay delivery may vary by up to 50:1. This is powerful evidence that a more quantitative approach is essential, as opposed to relying on “gut feel” or the Highest Paid Person’s Opinion.
Finally, Josh Arnold notes that cost of delay is much easier to assess on small batches of work. Large projects tend to attract many ideas for features, some of which have stronger economic justifications than others. When all these features are lumped together, it makes understanding the cost of delay a challenging proces, because it then becomes an average across the various features. But since features, ideally, can be worked on individually, understanding the cost of delay at that level helps with the prioritization of the work.
The combination of product roadmapping, a high quality DEEP backlog, and cost of delay is a solid foundation for digital product development. It’s essential to have an economic basis for making the prioritization decision. Clarifying the economic basis is a critical function of the product roadmap. Through estimation of story points, we can understand the team’s velocity. Estimating velocity is key to planning, which we’ll discuss further in Chapter 8. Through understanding the economics of product availability to the market or internal users, the cost of delay can drive backlog prioritization.
5.6. The service desk and related tools
As a digital product starts to gain a user base, and as a company matures and grows, there emerges a need for human-to-human support. This is typically handled by a help desk or service desk, serving as the human face of IT when the IT systems are not meeting people’s expectations. We were first briefly introduced to the concept in our Service Lifecycle (see The essential states of the digital service (or product)).
The service desk is an interrupt-driven, task-oriented capability. It serves as the first point of contact for IT services that require some human support or intervention. As such, its role can become broad from provisioning access to assisting users in navigation & usage, to serving as an alert channel for outage reporting. The service desk ideally answers each user’s request immediately, requiring no follow-up. If follow-up is required, a “ticket” is “issued.”
As a “help desk,” it may be focused on end user assistance and reporting incidents. As a “service desk,” it may expand its purview to accepting provisioning or other requests of various types (and referring and tracking those requests). Note that in some approaches, Service Request and Incident are considered to be distinct processes.
The term "ticket” dates to paper-based industrial processes, where the “help desk” might actually be a physical desk, where a user seeking services might be issued a paper ticket. Such “tickets” were also used in field services (see A “ticket” from early industry).
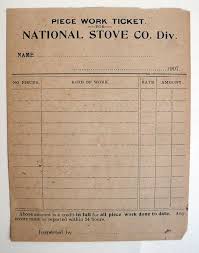
In IT-centric domains, tickets are virtual; they are records in databases, not paper. The user is given a ticket “ID” or “number” for tracking (e.g., so they can inquire about the request’s status). The ticket may be “routed” to someone to handle, but again in a virtual world what really happens is that the person it’s routed to is directed to look at the record in the database. (In paper based processes, the ticket might well be moved physically to various parties to perform the needed work).
A service desk capability needs:
-
Channels for accepting contacts (e.g.,telephone, email, chat)
-
Staffing appropriate to the volume and nature of those requests
-
Robust workflow capabilities to track their progress, and
-
Routing and escalation mechanisms, since clarifying the true nature of contacts and getting them serviced by the most appropriate means are nontrivial challenges
There is extensive material on managing Service Desks; the reader is referred first to the Help Desk Institute.
Work management in practice has divided between development and operations practices and tools. However, DevOps and Kanban are forcing a reconsideration and consolidation. Historically, here are some of the major tools and channels through which tasks and work are managed on both sides:
| Development | Operations |
|---|---|
User story tracking system |
Service or help desk ticketing system |
Issue/risk/action item log |
Incident management system |
Defect tracker |
Change management system |
All of these systems have common characteristics. All can (or should) be able to:
-
Register a new task
-
Describe the work to be done (development or break/fix/remediate)
-
Represent the current status of the work
-
Track who is currently accountable for it (individual and/or team)
-
Indicate the priority of the work, at least in terms of a simple categorization such as high/medium/low
More advanced systems may also be able to:
-
Link one unit of work to another (either as parent/child or peer-to-peer)
-
Track the effort spent on the work
-
Prioritize and order work
-
Track the referral or escalation trail of the work, if it is routed to various parties
-
Link to communication channels such as conference bridges and paging systems
The first automated system (computer-based) you may find yourself acquiring along these lines is a help desk system. You may be a small company, but when you start to build a large customer base, keeping them all happy requires more than a manual, paper-based card wall or Kanban board.
5.7. Towards process management
… one of the principal purposes of processes [is] to manage work without needing a manager and to reduce the cost and increase the value of outcomes of repetitive tasks. Good processes supplement management, augment its reach, and ensure consistency of quality outcomes.
The Art of Scalability
For a manufacturer, reducing variability always improves manufacturing economics. This is not true in product development.
Principles of Product Development Flow
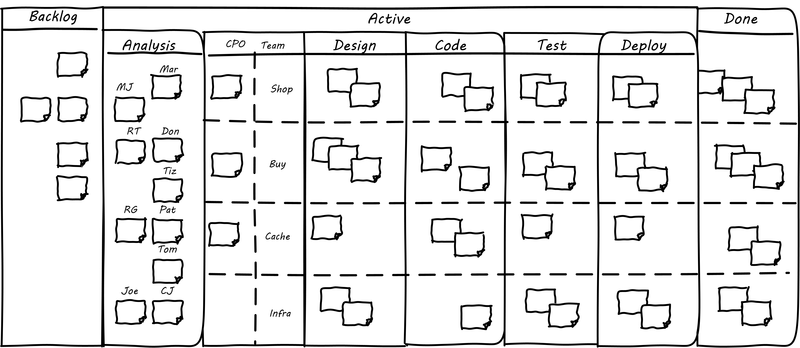
The Kanban board has started to get complicated (see Medium-complex Kanban board footnote:[Loosely based on Image from [161]). We’re witnessing an increasing amount of work that needs to follow a sequence, or checklist, for the sake of consistency. Process management is when we need to start managing:
-
Multiple
-
Repeatable
-
Measurable sequences of activity
-
Considering their interdependencies
-
Perhaps using common methods to define them
-
And even common tooling to support multiple processes
5.7.1. Process basics
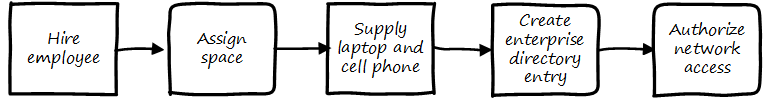
We’ve discussed some of the factors leading to the need for process management, but we haven’t yet come to grips with what it is. To start, think of a repeatable series of activities, such as when a new employee joins (see Simple process flow).
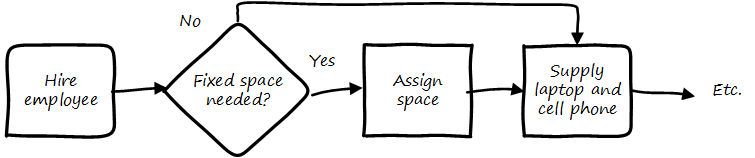
Process management can represent conditional logic (see Conditionality).
Process models can become extremely intricate, and can describe both human and automated activity. Sometimes, the process simply becomes too complicated for humans to follow. Notice how different the process models are from the card wall or Kanban board. In Kanban, everything is a work item, and the overall flow is some simple version of “to do, doing, done.” This can become complex when the flow gets more elaborate (e.g., various forms of testing, deployment checks, etc.). In a process model, the activity is explicitly specified on the assumption it will be repeated. The boxes representing steps are essentially equivalent to the columns on a Kanban board, but since sticky notes are not being used, process models can become very complex -— like a Kanban board with dozens or hundreds of columns! Process modeling is discussed in detail in the appendix. Process management as a practice is discussed extensively in Part III. However, before we move on, two simple variations on process management are:
-
Checklists
-
Case Management
5.7.2. The Checklist Manifesto
The Checklist Manifesto is the name of a notable book by author/surgeon Atul Gawande [105]. The title can be misleading; the book in no way suggests that all work can be reduced to repeatable checklists. Instead, it is an in-depth examination of the relationship between standardization and complexity. Like case management, it addresses the problem of complex activities requiring professional judgment.
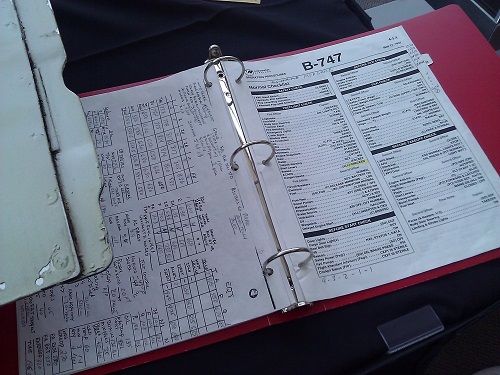
Unlike case management (discussed below), it explores more time-limited and often urgent activities such as flight operations (A Boeing 747 checklist [9]), large-scale construction, and surgery. These activities, as a whole, cannot be reduced to one master process; there is too much variation and complexity. However, within the overall bounds of flight operations, or construction, or surgery, there are critical sequences of events that MUST be executed, often in a specific order. Gawande discusses the airline industry as a key exemplar of this. Instead of one “master checklist” there are specific, clear, brief checklists for a wide variety of scenarios, such as a cargo hold door becoming unlatched.
There are similarities and differences between core Business Process Management (BPM) approaches and checklists. Often, BPM is employed to describe processes that are automated and whose progress is tracked in a database. Checklists, on the other hand, may be more manual, intended for use in a closely collaborative environment (such as an aircraft cockpit or operating room), and may represent a briefer period of time.
Full process management specifies tasks and their flow in precise detail. We have not yet got to that point with our Kanban board, but when we start adding checklists, we are beginning to differentiate the various processes at a detailed level. We will revisit Gawande’s work in Part III with the coordination technique of the submittal schedule.
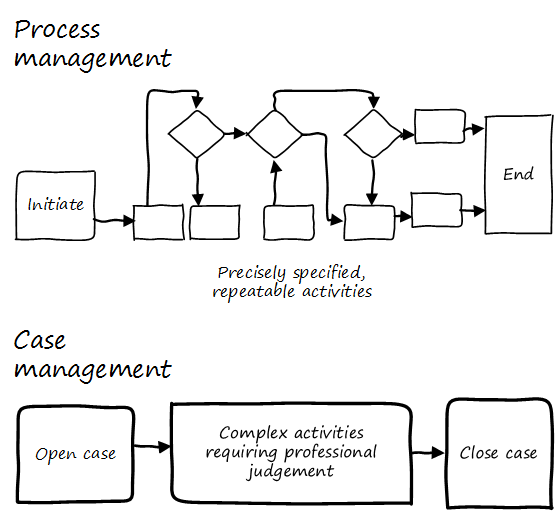
5.7.3. Case management
Case management is a concept used in medicine, law, and social services. Case management can be thought of as a high-level process supporting the skilled knowledge worker applying their professional expertise. Cases are another way of thinking about the relationship between the Kanban board and process management (see Process management versus case management).
|
Note
|
Do not confuse “Case” here with Computer Assisted Software Engineering. |
Noted IT consultant and author Rob England contrasts “case management” with “standard process” in his book Plus! The Standard+Case Approach: See Service Response in a New Light [88]. Some processes are repeatable and can be precisely standardized, but it is critical for anyone working in complex environments to understand the limits of a standardized process. Sometimes, a large “case” concept is sufficient to track the work. The downside may be that there is less visibility into the progress of the case -— the person in charge of it needs to provide a status that can’t be represented as a simple report. We will see process management again in Chapter 6 in our discussion of operational process emergence.
5.8. Conclusion
“Work management” may seem like an oddly generic title, but it’s important to distinguish the fundamental problem from more elaborate constructs such as process and project management. At the end of the day, “it’s all just work.”
Understanding work requires understanding tasks and their lifecycle, the characteristics of queues, work in progress, and the cost of delay.
5.8.1. Discussion questions
-
When have you been on a team that needed to have a shared mental model? How did you achieve this?
-
Where do you see queues in your daily life? Are they frequently in high-queue states? What could be done to improve them?
-
How do you keep track of tasks? Compare approaches with your group.
-
Do you choose Scrum, Kanban, both, or neither?
5.8.2. Research & practice
-
Think of a queue you encounter on a regular basis. How can you understand its cost of delay?
-
Research an automated, online Kanban tool (Trello, LeanKit, or similar). Compare it to a physical white board, ideally as a team. Which do you prefer and why?
-
Recall your product ideas from earlier discussions. How would you estimate its cost of delay? Can you estimate the cost of delay by feature?
-
(Advanced) Read some of Reinertsen’s The Principles of Product Development Flow and write up or present two or three key insights you gained.
5.8.3. Further reading
Books
-
David Anderson, Kanban: Successful Evolutionary Change for Your Technology Business
-
Mike Burrows, Kanban from the Inside: Understand the Kanban Method, connect it to what you already know, introduce it with impact
-
Rob England, Plus! the Standard+Case Approach: See Service Response in a New Light
-
Eli Goldratt, Jeff Cox The Goal: A Process of Ongoing Improvement
-
Gene Kim et al., The Phoenix Project: A Novel About IT, DevOps, and Helping Your Business Win
-
Donald Reinertsen, Principles of Product Development Flow: Second Generation Lean Product Development
Articles
-
Josh Arnold, Quantifying the cost of delay
-
Josh Arnold, cost of delay definition
-
Alex Salazar, So Long Scrum, Hello Kanban
-
Steve Reid et al., Ultimate Kanban: Scaling Agile without Frameworks at Ultimate Software
Research
-
Weick & Roberts [278], Collective Mind in Organizations: Heedful Interrelating on Flight Decks
Videos
-
Don Reinertsen, The Tactical and Strategic Art of Economic Models (Excellent discussion of the cost of delay)