Special section: Scaling the organization and its work
Avoid large projects. Start small and quickly develop a product with the minimum functionality. If you have to employ a large project, scale slowly and grow the project organically by adding one team at a time. Starting with too many people causes products to be overly complex, making future product updates time-consuming and expensive.
Agile Product Management with Scrum
As we begin the second half of this book, consider Pichler’s advice above. We have spent Chapters 1 through 6 (the first half of the book) thinking mainly in terms of one product and its dimensions. We are scaling now because we must; we have increasingly diverse product opportunities, or one product that has become so large it must be partitioned in some manner. Or both.
The two dimensions of demand management
To provide a framework for Part III, let’s start with this two-dimensional analysis illustrated in Two dimensions of demand management.
You should spend some time reviewing the graphic, which provides a unique way of understanding the work you are now experiencing as a "team of teams” or “manager of managers” in an IT-dependent environment of increasing size and complexity. We’ve come a long way since our discussion of work management. By the time we started to formalize operations, we saw that work was tending to differentiate. Still, regardless of the label, we put on a given activity, it represents some set of tasks or objectives that real people are going to take the time to perform, and expect to be compensated for. It is all demand, requiring management. Remembering this is essential to digital management.
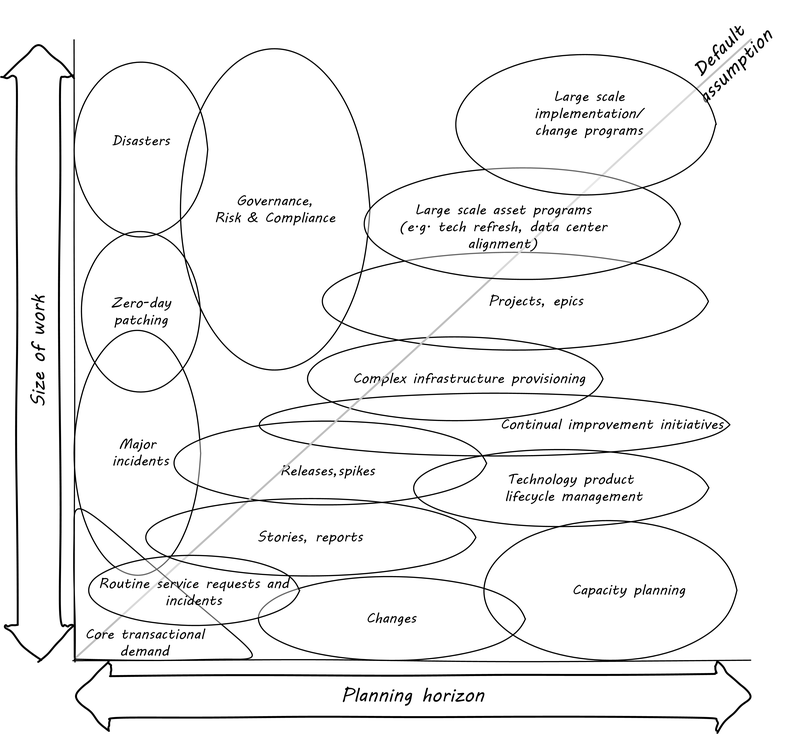
Let’s consider the various forms that demand may take. Understanding these demand forms will also help you develop a deeper understanding of an architecture of IT management, a topic I have explored in other works [25]. The diagram has two dimensions:
-
Planning
-
Granularity
Planning. As an organization scales, there is an increasing span in your time horizon and the scope of work you are considering and executing. From the immediate, “hand-to-mouth” days of your startup, you now must take concern for longer and longer timeframes: contracts, regulations, and your company’s strategy as it grows all demand this.
Granularity. The terminology you use to describe your work also becomes more diverse, reflecting in some ways the broader time horizons you are concerned with. Requests, changes, incidents, work orders, releases, stories, features, problems, major incidents, epics, refreshes, products, programs, strategies; there is a continuum of how you think about your organization’s work efforts. Mostly, the range of work seems tied to how much planning time you have, but there are exceptions: disasters take a lot of work, but you don’t get much advance warning! So the size of work is independent of the planning horizon.
The bubbles represent a “space” where one is likely to find that kind of work. As indicated by the central diagonal, it reflects an assumption that larger amounts of work are more likely to be planned further in advance. However, this is not always true. A large, unwelcome amount of required work that shows up with no planning is probably a disaster. Desired work (in the form of aggregate transactional demand) may also spike unexpectedly. Transactional demand considered across a long timeframe is capacity management. Work items of varying sizes lists various examples.
| Type of work | Description |
|---|---|
Core transactional demand |
This is the demand on the fully automated IT system for a given moment of truth: a banking account lookup, a streaming movie, a Human Resources record update |
Routine service requests and incidents |
Service requests are predefined, process-driven work items, rarely requiring creative thought or analysis. Incidents span a spectrum, but some are simpler and more routine than others, especially those stemming from user misunderstanding or error. |
Changes |
Changes represent modifications of established IT functionality or state. They represent some definite risk to one or more IT services, which is why they are planned on a longer lead time. However, they ideally remain relatively granular, which helps reduce their risk. |
Routine releases, stories, reports |
Releases and (in the Agile world) stories represent larger increments of functionality |
Projects |
A Project is a large, planned amount of work with a defined end date. It might create a Service, which also represents a commitment to a large, ongoing amount of work, perhaps comparable in scope to the Project. |
Major incidents |
Major incidents by definition are not planned. But they represent a significant amount of work to overcome. |
Some forms of work may lead to other forms of work. For example, Projects may manifest themselves as Stories, Releases, and Changes. This complicates the diagram a bit; we don’t want to “double-count” work effort. But not all Releases derive from Projects, and not all Project work (especially in complex environments) can be cleanly reduced to a set of smaller tasks.
The final point of this diagram: you only have so much capacity to execute the work it implies. If you have a disaster or a series of major incidents, this unplanned work may impact your ability to deliver user stories, changes, or even meet transactional demand. Trade-offs must be considered.
Adding a third dimension with Cynefin
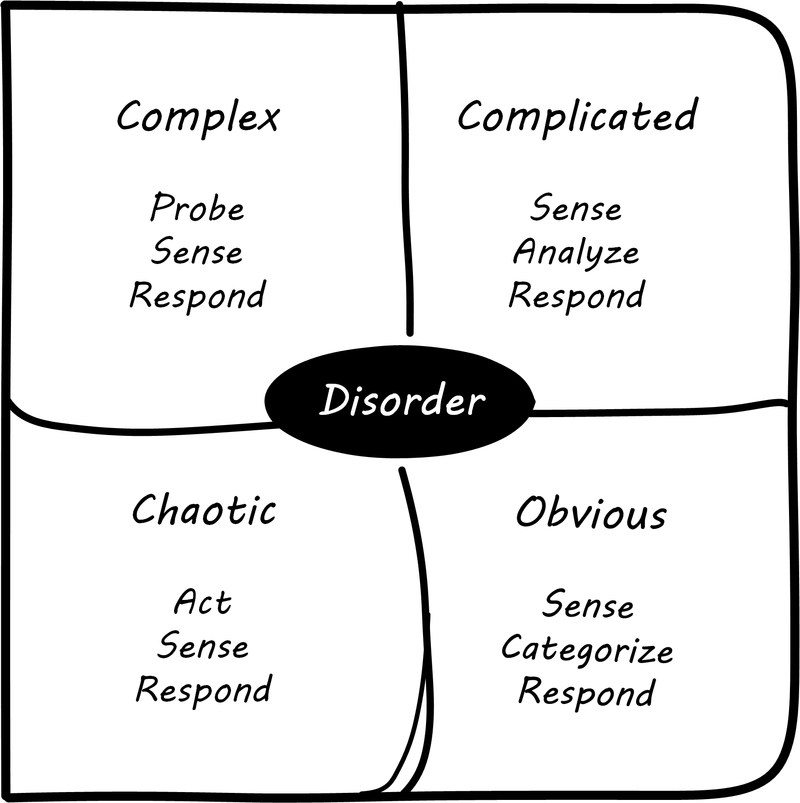
This third dimension of variability is challenging to understand and touches on our earlier discussion of systems thinking. A helpful framework to understand it is the Cynefin framework, by Dave Snowden and Cynthia Kurtz [163] (see Cynefin thinking framework footnote:[similar to [163]). Cynefin proposes that there are five major domains useful in understanding situations:
-
Simple/Obvious
-
Complicated
-
Complex
-
Chaotic
-
Disorder
The simple or obvious domain is straightforward, repeatable, and cause and effect are known. The concept of "best practice” applies. The mode of action is to sense, categorize, and respond.
The complicated domain requires analysis and expertise; there may be several right or at least serviceable answers. Rational thought is possible, and cause and effect relationships may be more challenging to understand, but still are applicable. Mode of action is to sense, analyze, and respond.
The complex domain is that of systems thinking. Cause and effect are apparent only in hindsight. Interdependencies complicate action. Reinforcing loops can quickly accelerate or conversely, counterbalancing loops kick in and prevent desired changes from happening. Both make linear assumptions hazardous. Mode of action is to probe, sense, and respond (“probe” being to make a small change). Much of modern product development and DevOps thinking is optimized for this domain because simple and linear approaches have so frequently failed.
In the chaotic domain, cause and effect are not apparent even in hindsight. The situation is completely unpredictable, and action is essential — better to act in any direction rather than being paralyzed. The mode of action is to act, sense, and respond.
Finally, disorder is considered to be the domain you’re in when you have not figured out which of the other four applies.
The two dimensional model above (Two dimensions of demand management) does not describe how uncertain or unpredictable the work is, however. The predictability of the work is also an independent dimension. You might have two projects, both taking the same effort. One of them you were able to predict easily, while the other one was not predictable — more precisely, your expected time, effort and cost were a long way off from what you wound up spending. (Usually in an unfavorable direction).
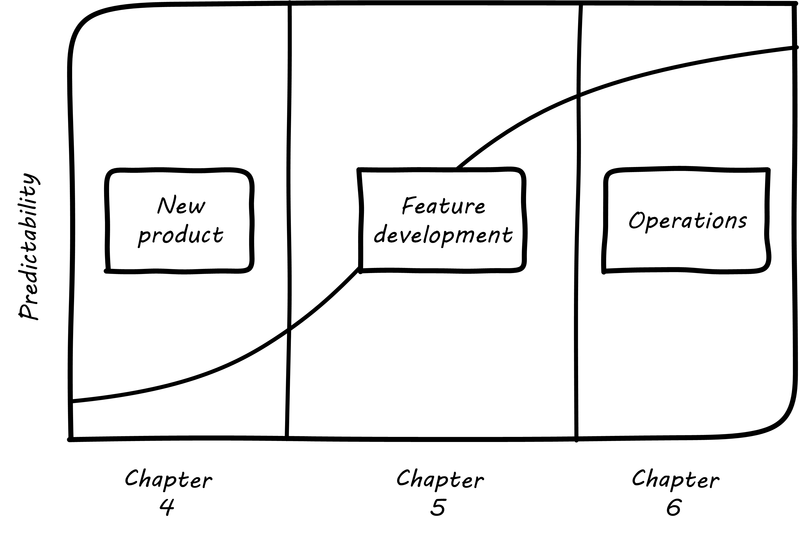
Part II (Chapters 4-6, which we just finished) can be viewed as a logical progression from the uncertainty of developing a novel product, to the day-to-day work of building its features, to its predictable operation. The “predictability curve” illustrated in Part II: increasing certainty (credit to Cantor) [1] increases as the digital product stabilizes and moves to a fully operational state.
This question of predictability, of the degree to which actuals track estimates and can be known in advance, will be an ongoing theme throughout Part III. As we scale up, our organization takes on more and more work of all kinds, from highly uncertain to very predictable. Understanding the differences in this “portfolio” of work is essential to managing it correctly. There has always been an element of risk; as a startup, your success was not guaranteed! You now find that you are managing different classes of risk simultaneously, and “one size fits all” approaches do not work.
You might have a program to upgrade the memory on 80,000 identical POS terminals across 2,000 retail stores. It’s going to take a lot of work; you’ll be “rolling trucks” in all 50 states! But you are sure that you can estimate this work with a high degree of accuracy; it has high predictability. In terms of the Cynefin framework, it’s an obvious (or maybe complicated) problem. On the other hand, creating a completely new POS system for your stores is an unpredictable effort. Your original estimate for this large program might be off by orders of magnitude. Its predictability is low. It’s a complex problem.
Or perhaps you are writing reports using a well understood database and reporting tool. This work will be likely more predictable work -— even if complicated in the Cynefin sense -— as compared to developing the first few stories on a completely new architecture. This is true even if the estimated size of the work is the same for both the reports and the new stories. As a dimension, variability is independent of the size of the work (although the two may be correlated).
One of the most challenging open questions as Agile and DevOps continue to increase their influence is organizations with larger portfolios of older, less risky systems, for example, systems developed by external vendors but still run in-house. Not everything is available or suitable to be run under a Software as a Service model. The staffing ratios and work models required for such portfolios may not necessarily support the ideal of high-performance, cross-functional teams. Nor will these systems benefit from high performance Lean Product Development techniques; such approaches might be overkill. The industry is just beginning to think about these issues.
The Betz organizational scaling cube
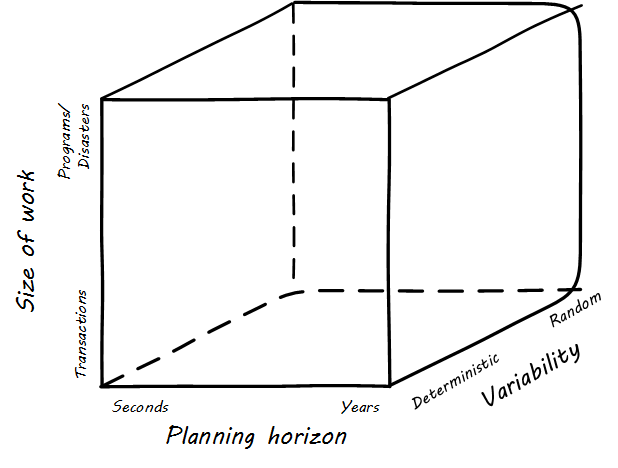
When we combine the three dimensions:
-
Size of work;
-
Time horizon; and
-
Predictability
we get the Betz organizational scaling cube (see Betz organization scaling cube [2]). It shows the three dimensions we’ll consider throughout Part III. The accompanying cube shows these dimensions visually. The three dimensions represent a space to understand work, resource, and planning as we scale the organization.
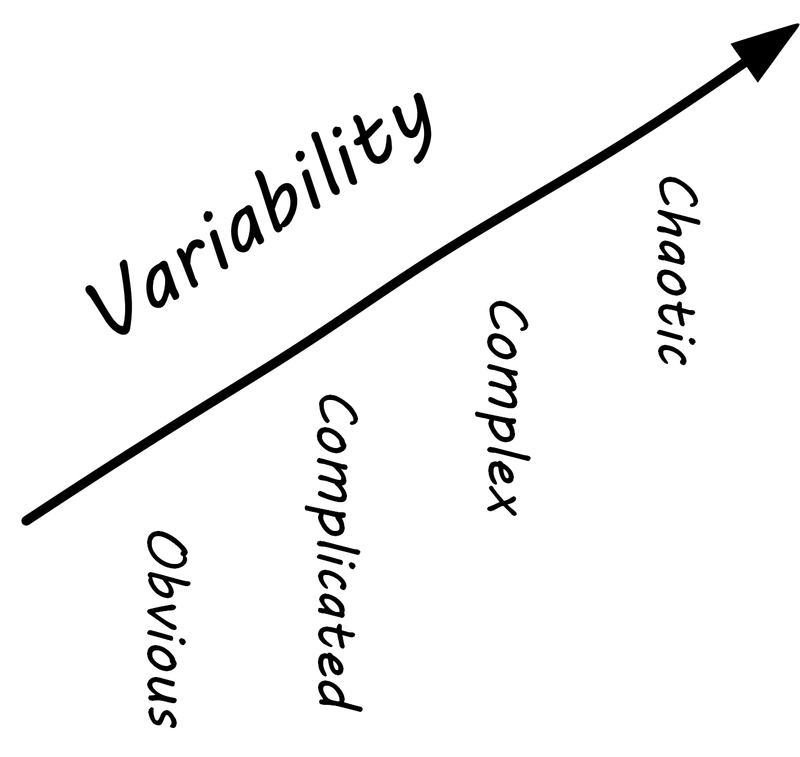
The z-axis of variability can be seen as a progression along the first four Cynefin domains (see sidebar). At the origin at lower left, we have predictable, small-grained work occurring in short “planning” horizons (e.g.,automated transactions running on computers). As we scale out to larger domains of work, longer timeframes, and greater variability in planning, we encounter the problems of growth, coordination, strategy, and the fundamental uncertainties of operating in a chaotic, competitive world.
Demand, supply, and execution
execution (n). 14c., “a carrying out, a putting into effect; enforcement; performance (of a law, statute, etc.)., the carrying out (of a plan, etc.).,” from Anglo-French execucioun (late 13c)., Old French execucion “a carrying out” (of an order, etc.)., from Latin executionem (nominative executio) “an accomplishing,” noun of action from past participle stem of exequi/exsequi “to follow out” (see execute).
In order to understand the concept of execution, we need to think about supply versus demand. Think about the kinds of demand described above. Each form of demand implies some kind of supply to meet it. For example, the demand that an automated transaction is to be executed requires the supply of appropriate computing capacity at the necessary place and time. The demand that a new story is to be supported as part of a software product feature requires the supply of a software development team’s time and attention. And a major product or project requires the supply perhaps of many teams as well as other resources (hardware and software assets, for example).
In the Betz organization scaling cube, work and execution converge to the origin at front lower left. An alternate view that helps us describe the chapter structure is the convergence point at the top of a pyramid (see Demand-supply-execute model). This rotated approach is compatible with the dual-axis value chain.
Bottom to top, this diagram tells a story of demand and supply as they progress through increasingly refined understandings to the specific execution of work and delivery of value. We have markets and regulations, which define and constrain the potential demand for the digital product. Markets are met with capital funding, human resources, strategies and product offerings, which lead to programs of work, projects, and platform decisions. These, in turn, lead to identifying user stories, writing software, configuring platforms, and executing changes, service requests, and work tasks.
That finer and finer grained demand stream converges with a finer and finer grained supply stream. Large blocks of capital are translated into strategic technology choices and vendor relationships, organizational structures and investments in skilled people. More detailed budgets and planning culminate ultimately in the availability of people, hardware, and software for given assignments, e.g., an empty slot on a Kanban board. The journey can start anywhere, with a large block of traditionally managed programmatic capital or a small round of seed funding translated directly into a two-pizza team with maximum autonomy, which then grows and leads to larger investments.
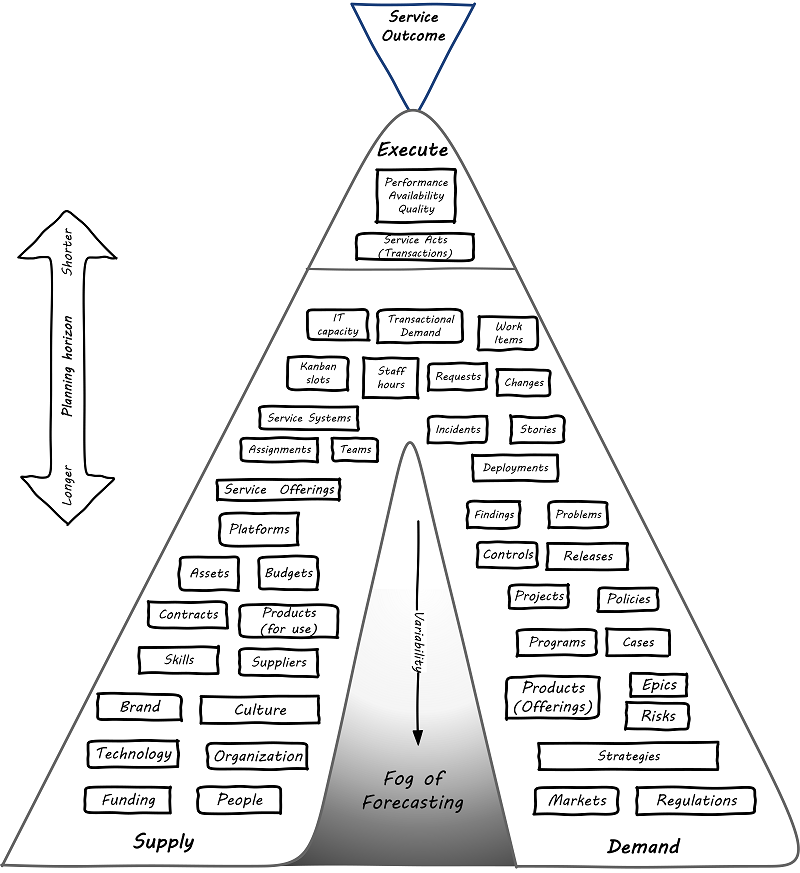
Ultimately the deployed IT service system is available for fulfilling transactional service demand which can be measured in terms of quality, availability, and performance. Execution, in this model, is defined as the irrevocable combination of demand with supply. The gap between the legs of the V is filled with the “Fog of Forecasting.” With the lower-level, larger grained abstractions it is more difficult to understand demand and supply, especially when product development (e.g.,novel software engineering) is involved. (Understanding the opportunities of large grained demand and matching those with significant supply is a strategy). As demand and supply converge to the point of execution, a finer and finer grained awareness is created of the impending work and whether it is likely to be successful — that is, if demand will effectively and efficiently be paired with supply.
Notice how the fog lifts as you get closer to actual execution. The closer we get to the point of execution, the better understanding we have of the team and individual level assignments across all queues and Kanban slots or their equivalent (e.g.,assigned and accepted work orders). Ultimately the demand represents the usage of the automated digital system’s capacity. Notice that in terms of the Betz cube z-axis, we still can have high variability at the point of execution, if we are considering a system executing many forms of work. In other words, surprises can happen at any time.
Part III chapter structure
The chapter structure of Part III can be visualized as in Part III Chapter structure.
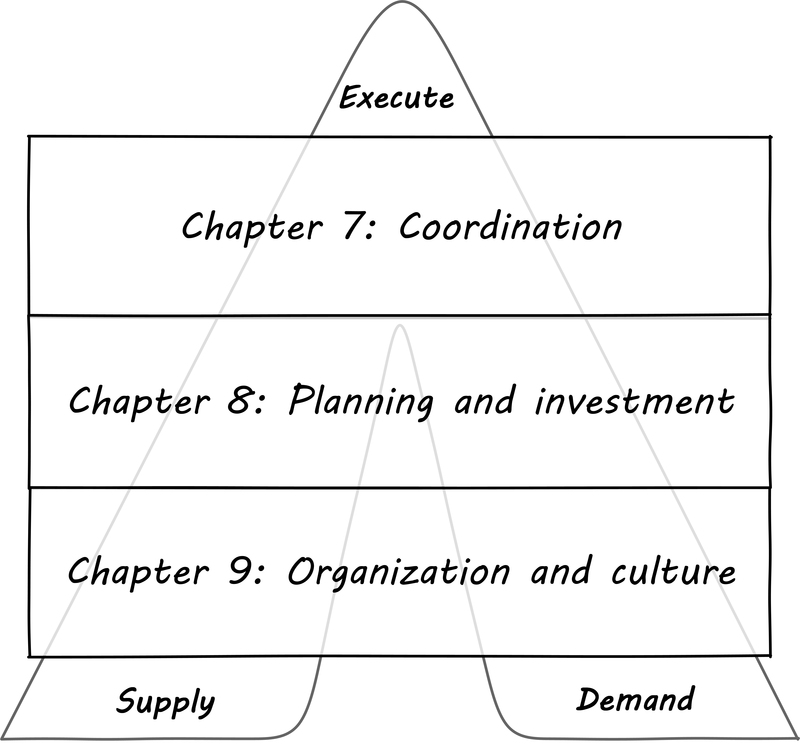
In thinking about how organizations develop as they scale, it is helpful to consider various timeframes:
Ongoing execution is the actual day-to-day work, however, conceived. At this point in our journey, the work includes a significant challenge of coordination (which we define and analyze in Chapter 7). It can include defined process activities, project deliverables, the flow of new product functionality, or ongoing improvement and governance. Ongoing execution is the “moment of truth” where estimation becomes actualized, supply meets demand, and in our is increasing in complexity.
Investment decisions are required to charter programs, products, features, and components, even in those companies that may be moving away from a traditional project cycle. Investments are usually understood in terms of budget planning, which traditionally has driven the project funding cycle. They represent some statement of intent for a larger scope of work to be performed and/or sustained, based on the organizational platform, which should be able to support multiple investments.
Organizational changes may take years, and require considerable effort and thought if they are to succeed. One does not change organizational structures lightly or (hopefully) frequently. Employee tenure is in general even longer.
Culture takes longest and is most difficult to change; it easily outlasts both organizational forms and even individual employees coming and going. Both culture and organization have self-reinforcing feedback loops which add complexity to any deliberate attempts to transform them.
The delivery models
In Chapter 4 we introduced the "3 Ps":
-
Product management
-
Project management
-
Process management
It is important that you review them. Sometimes, the concept of “program” is used (see below). We will call these delivery models: they are organizing paradigms for getting work done. They may depend on each other, but they each have clear industry identity and bodies of knowledge associated with them:
-
Product management has the Product Development and Marketing association and authors like Steve Blank and Marty Cagan.
-
Program management has the AXELOS Managing Successful Programmes guidance
-
Project management has the Project Management Body of Knowledge and the PRINCE2 guidance from AXELOS.
-
Process management has the BPMN and BPEL standards and authors like Geary Rummler, Roger Burlton, and Paul Harmon.
We order the delivery models by their variability. What does that mean? Products and programs have the highest variability. Their outcome may differ considerably from the initial vision that drove them. Projects, in theory, should be reasonably plannable -— their schedule and cost are managed in terms of “plan versus actual” and differences, ideally, should be well controlled and understandable. Finally, process management strives to minimize variation, and in its most rigorous form uses statistical control to do so. If we matrix the delivery models with the timeframes we get Timeframes and delivery models.
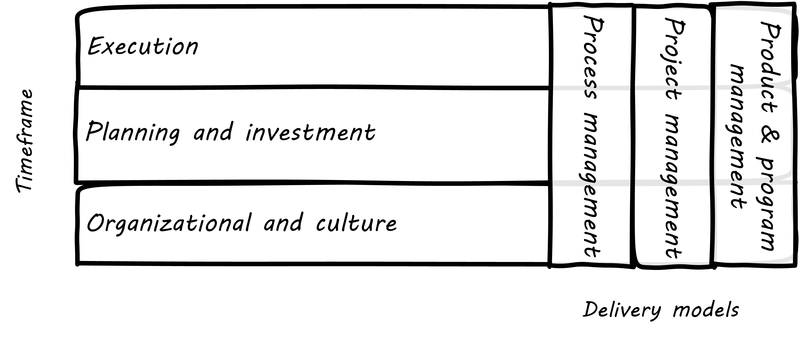
The relationships between the timeframes and delivery models are complex:
Investments are made in products first, which may or may not need projects and/or processes. Rigorously planned projects or detailed, repeatable processes are not, in fact, optimal for product discovery — a mistake the IT profession has fallen into over and over again. Products are best thought of in terms of discovery and empirical hypothesis-testing. If the hypothesis fails, the investment should be cancelled. So, the “product” concept is both shorter and longer lived than the average project, which is typically understood on an annual cycle.
Project management also may take place without processes, as it may be based on one-time “deliverables” that are not repeatedly produced.
Finally, to support a process requires portfolio investment and organizational structure, but no project may ever be involved. Whether a product is implied by the existence of a process is an interesting question we will think about.
Clearly, we must think carefully about the relationships between these dimensions. That, in a nutshell, is the purpose of part III.